Forum Replies Created
- AuthorPosts
Alex @ Logical Invest
KeymasterHello William,
We start processing signals today at night after markets are closed and all dividend calculations are finished – then we send them out on the 1st of the month, normally around 7-8am EST.
You can also calculate signals by your own using QT, see here:
https://logical-invest.com/quanttrader-application/portfolio-backtesting-builder-main-windows/#conssignals
https://logical-invest.com/quanttrader-application/interactive-brokers-portfolio-rebalance/KeymasterHi Ronald,
thanks for the follow up!
Our strategies do not go to cash, but rather stay invested in safe havens which at least give you the opportunity to get some additional yield. Indeed the current USD strength coupled with an ever-stronger equity market hurts the gold performance, but that can change very quickly again.
KeymasterHello Ronald,
thanks for the question, which allows me to get a bit deeper into the topic.
1) From a fundamental point of view I’m with you, the expected further reduction in rates has already been priced in, and probably rates bounce back. This indeed would hurt gold prices, but more so long term bond prices.
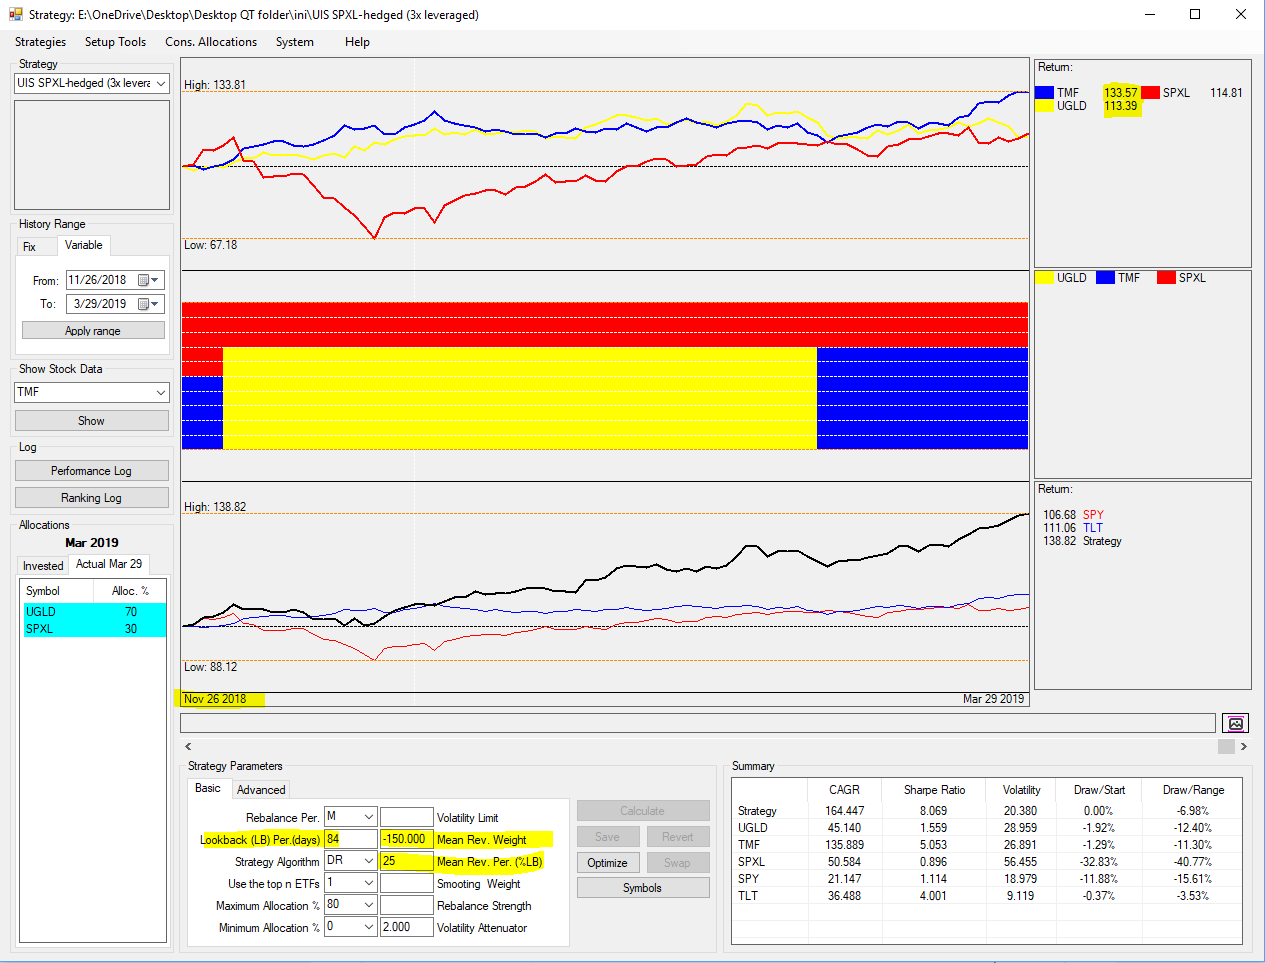
2) From a technical perspective, our algo for the UIS3x gives a fairly strong weight on the mean reversion part, that is what went up heavily is expected to give back. Which is the case for TMF, which went up more than 33% since Nov 26 (start of the lookback of 84 days), but the most part of that has been in the month of March. Our algo reduces the return of the last 21 days from the return of the full lookback of 84 days, so in sum Gold looks better.
I attach two screenshots from QuantTrader, first the price curves for the lookback period, and second the ranking registry, note the performance column shows the net of the 84 days – 21 days performance.
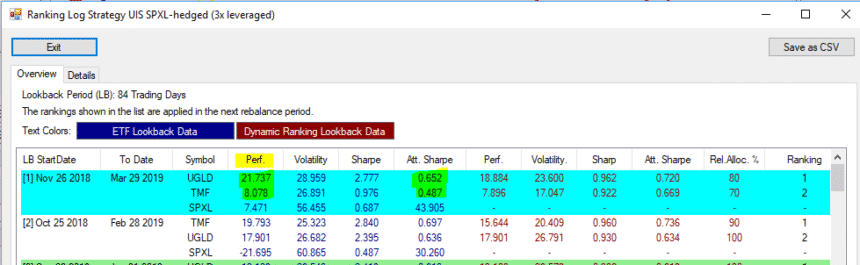

To your second question: When looking at volumes and liquidity of ETF always keep in mind these ETF are backed-up by bonds and physical gold. So any strong price movement would be immediately arbitraged away by the market or the market makers. So even with an order of $5 million you should not be able to make the market if you place it as limit order and have a bit of patience.
KeymasterGood morning John,
indeed there is a change, see here for details as announced in todays newsletter: https://logical-invest.com/quanttrader515s/
We changed the way QuatTrader handles the mean-reversion part of the strategy, this most importantly impacts Nasdaq. With the new calculation we better exclude stocks which have sudden jumps for example due to merger or acquisition announcements, and on the other hand do not penalize stocks which short-term under-perform but then revert to the mean.
KeymasterHello, Alex
What happend with NAS100 strategy on the website? Now it looks more agressive, with more CAGR, volatylity an maxDD.
For example, one week ago I made a portfolio
BRS 10.0%
MST3 30.0%
GSRS 23.0%
NAS100 25.0%
USSECT 12.0%This portfolio since 2006:
One week ago: CAGR 18%, maxDD 9%.
Today: CAGR 21%, maxDD 19%KeymasterHello RD,
we were doing some tests with the new QuantTrader release which incorporates some new features and data source. See details here: https://logical-invest.com/quanttrader515s/
We will publish the new signals until tomorrow morning, the allocations have been updated as before until you see the March signals.
Best,
AlexKeymasterRealmente no los vas a encontrar, para el SPXL hay versiones de dos veces apalancamiento únicamente, para bonos y oro no hay.
Puedes hacer dos cosas:
1) Utiliza las señales de la version sin apalancamiento, e.g. UIS y usa el margen de tu cuenta para apalancar.
2) Crea tu propia estrategia con EuroStoxx, bonos europeos (bunds?) y oro con QuantTrader. Me imagino que estas basado en EUR, asi tambien evitas riesgos por tipo de cambio.KeymasterHola Juan Carlos,
si, es todo un problema, y la verdad también estamos batallando con ello.
Para muchos ETF vas a encontrar otros basados en el mismo indice, pero luego te vas a enfrentar con que la historia de datos es muy limitados, es decir únicamente unos pocos años. Esta pagina es util para encontar ETF por indice que tengan al menos 5 años de datos (agrega columna 5yrs %): https://www.justetf.com/en/find-etf.html
Una vez que tengas ETF similares con buena disponibilidad de datos puedes utilizar nuestras estrategias. Otra opción es utilizar nuestro QuantTrader para adaptar nuestras estrategias o crear unas nuevas. Te voy a dar aceso a Quanttrader para los próximos tres meses para que puedas intentar. Te mando un mail directo.
KeymasterHello Tony,
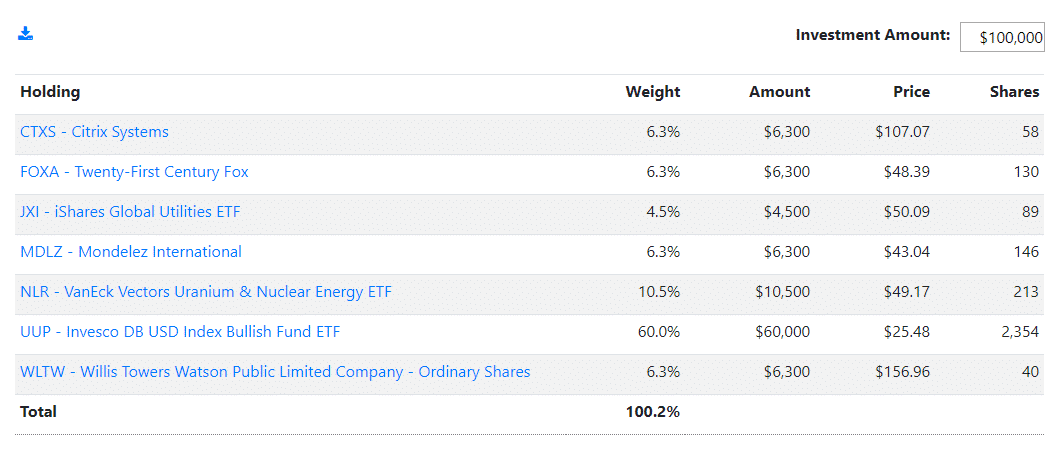
to replicate the holdings of the moderate portfolio in QT, just use the “condolidated allocations” in QT, select 50% GSRS and 50% in Nasdaq 100 and you should get the following, which matches what our app shows, well, despite we round to one digit in the app:
QT:
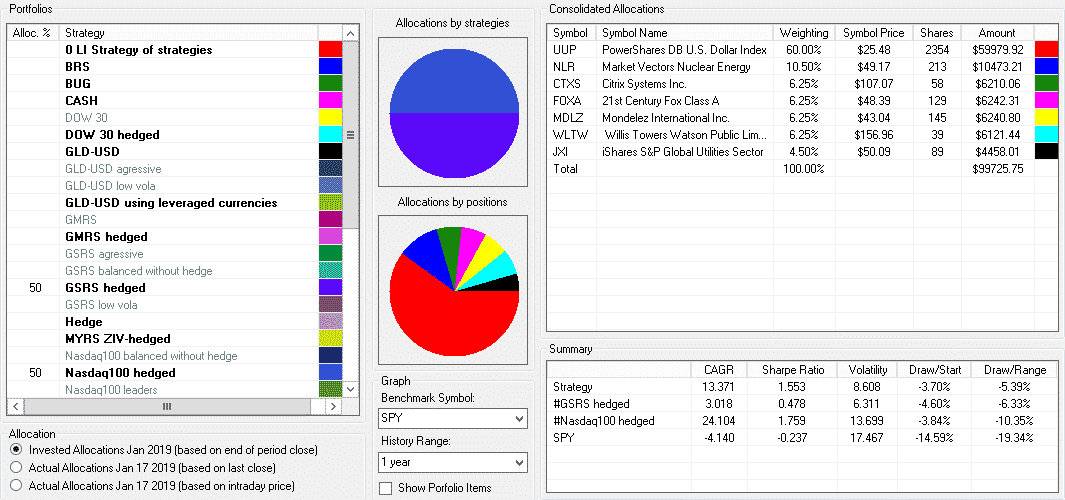
App:
Contact me at alex @ logical-invest.com if you need a hand,
Best, AlexKeymasterHi Anthony,
no, these are not yet the Jan allocations, sorry for the confusion. See this thread for more details: https://logical-invest.com/forums/topic/nasdaq100-dec-18-update-performance-issue/#post-57151 and this post re the changes for 2019: https://logical-invest.com/strategy-changes-for-2019/
KeymasterYes, ESRX has merged with Cigna, you should see now shares of CI and cash as below in your account. We’re going to reflect this in the Jan update.
“Shares of Cigna and Express Scripts ceased trading on the New York Stock Exchange (NYSE) and NASDAQ, respectively, on December 20, 2018. Beginning tomorrow morning, shares of the new combined Cigna (“New Cigna”) will start trading on the NYSE under the stock ticker symbol “CI.”
At the closing of the transaction, each outstanding share of Cigna common stock (other than certain excluded shares) was converted into one share of New Cigna common stock, and each outstanding share of Express Scripts common stock (other than certain excluded shares) was converted into (1) 0.2434 of a share of New Cigna common stock and (2) the right to receive $48.75 in cash, without interest, subject to applicable withholding taxes. Immediately following the closing of the transaction, former Cigna stockholders own approximately 64 percent and former Express Scripts stockholders own approximately 36 percent of the shares of New Cigna common stock outstanding.”
KeymasterHello Supal, the Top Dow strategy is allocated in the following portfolios:
https://logical-invest.com/app/strategy.php?symbol=Moderate
https://logical-invest.com/app/strategy.php?symbol=DD15
https://logical-invest.com/app/strategy.php?symbol=Vol10
https://logical-invest.com/app/strategy.php?symbol=Vol7Whether a strategy gets included into one of our default portfolios only depends on the optimization algorithm, that is which strategies best allow the optimizer to obtain the best result fulfilling the constraints.
For example, the configuration of the “Max CAGR with volatility less than 10%” is just that: Which combination of strategies show the best historical return (CAGR) while having a historical volatility of less than 10% – in the observed period, which by default is Jan 2007 to present. You can see the full definition always in the “Methodology & Assets” description of the portfolios.
We will update the portfolios twice a year with the updated data history – or when significant changes in our strategy offering occur, like in this case.
Hope this answers your questions.
KeymasterGood morning R D, well, that and some other requested features are kind of our Christmas gift for the community. The Dow30 strategy is already in the app and also incorporated into portfolios, where applicable.
KeymasterDudo que Portfolio Visualizer tenga un algoritmo como el que utilizamos nosotros, asi que probablemente no. Pero nuestra aplicacion QuantTrader te permite visualizar todos los reportes que necesitas para verificar los resultados.
KeymasterHola Diego, todos nuestros sistemas estan 100% abiertos y publicados. La forma mas facil de visualizarlas es utilizando nuestra aplicacion QuantTrader – y aqui unos videos que te ayudaran a utilizarlo.
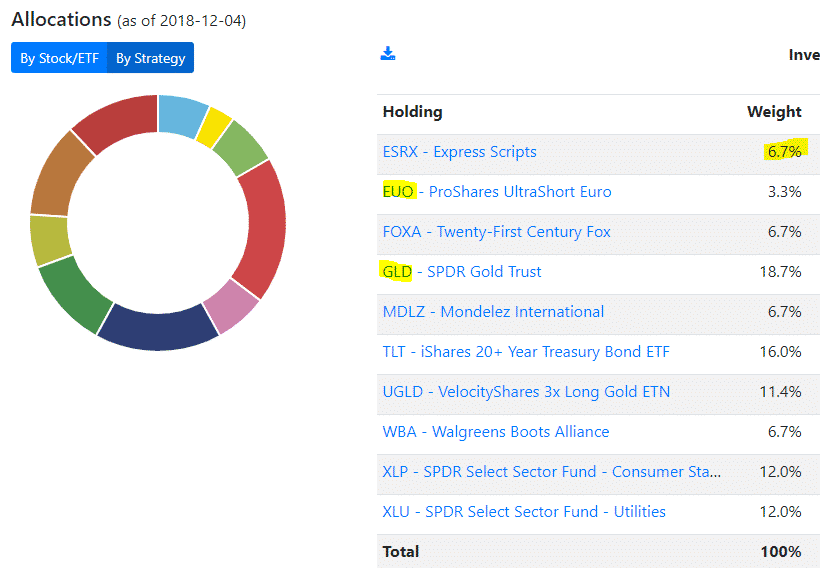
KeymasterThanks for the comment, have added one decimal to the holding.
Here the updated allocation viw for the moderate portfolio, see the holdings of GLD and EUO:
 Keymaster
We changed the former list to a graphical visualization. Simply click on “Allocation” or “Holding” in the graph to see the allocations at strategy and/or ETF level.
 Keymaster
Good morning Miguel,
here a Screenshot of the BRS strategy including TBF. Adding an outright short bond goes a bit against the philosophy of the strategy. Short bonds are long-term looser as the dividends from interests create a positive bias, again long-term, when the yield curve is expected to go up as currently then it may make sense.
You can see that there is no big difference in the performance anyhow, so we would rather not include it.
KeymasterThanks, was not aware of this paper.
Here is another one, oldie but goldie: Volatility at World’s End
KeymasterHi Daniel,
a straight stop-loss does not work, in a spike you are stopped-out at the wrong moment and lose disproportionate more than you earned from the premium you collected before. Here another way, but requires day-to-day monitoring, which might be prohibitive for you.
Setup a long vix buy order for 3rd or 4th month with buy-limit in 20 to 25 range (20k for future). This works as stop-loss for ZIV or short futures. Once you’re in then you would need to monitor manually, either close-out both, or close short and ride-out the long – very event driven (just another tweet or sth serious?). Futures have better liquidity and spread than ZIV, especially is sudden spikes, so we prefer future buy-order over a stop-loss.
If you want to derisk generally, then trade Vix future spreads instead of ZIV ETF, our preferred way is short 3rd/4th month, long 5-7th month.
KeymasterThe best is to use our QuantTrader app, there we have all three UIS strategies (simple long, 3x long, 3x short) and the signals vary among them as stated.
Download QuantTrader from here, then log-in with the web credentials.
KeymasterHi BW, thanks for the comment!
Agree, execution cost and slippage need to be considered, but as they vary by broker, exchange and account volume we decided not to include them by default.
In QuantTrader >> System >> Settings you can add a global % to be considered, see here for details.
KeymasterSure, here full story: https://logical-invest.com/video-tutorial-quanttrader-a-complete-walk-through-for-new-users/
and here the part of the video on optimization: https://youtu.be/hYIac2PoD2YKeymasterHi Gordon,
thanks, indeed a compelling idea. We did already some research, see here: https://logical-invest.com/top-performing-etfs/
This is quite easy to model in QT, just reduce the number of strategies used in the “Strategy of Strategies” to three and use a lookback of less then 20 days to trigger monthly rebalancing or 60 for quarterly, the sub-strategies will stay with their lookback and other parameters.
We will follow up in a separate post.
Best,
AlexKeymasterMost Mexican companies, at least the IPC ones, are available in Yahoo, so you can download them into QT:
https://finance.yahoo.com/quote/CEMEXCPO.MX?p=CEMEXCPO.MX
Just setup CEMEX using symbol CEMEXCPO.MX
KeymasterThis is very convenient: https://www.barchart.com/etfs-funds/quotes/SPY/constituents?page=all
KeymasterHello Richard,
indeed needed to increase the decimals in the solver parameters, some solutions converged with very small percentages that should not be there. Should have noted, sorry for that. Have finished reviewing also the other things on my list, here the new file: https://logical-invest.com?gfid=15
As an early heads-up: One smart community members has managed to come up with a brilliant brute-force optimization routine. Much faster, more options and much more elegant than my Excel monster :-) We hope to get it into an online version soon.
The US sector rotation strategy signals are ok, they do not add to 100% as the strategy is 26.7% in cash this month if you use the 3x levered ERY ETF. See signals here: https://logical-invest.com/the-us-sector-rotation-strategy-investment-for-may-2018/
KeymasterHi Richard, thanks, that makes sense. I´m basically finished with the review of the PB, just fighting with some last details in the graphs, sorry if it takes longer then expected.
Here the current version with updated optimization and formulae review – so we’re using the same base while I finish up: https://logical-invest.com/?gfid=15
KeymasterThanks for the recommendation. Let us look into using SCZ and MDY, we´ll post the results here next days. We can also built you a custom strategy with these two to use in QuantTrader, just email me at [email protected] if interested.
KeymasterHi Charlie,
we switched to the new presentation of results during the rebalance period due to feedback from other users, the former daily results seemed to be too detailed and confusing.
So for the time being you can only view the daily performance graphically (not the exact values) if you select some weeks for the chart range.
I hope this is acceptable as a compromise.
KeymasterHi Stefan,
Indeed, the CAGR should be 28.3%, attached an Excel example with the exact data and formulae.
Cannot reconcile the 34% you mention, would you send me your sheet to [email protected] so I can check?
Thanks,
Starting Value 100 8/15/2008
End Value 1131 05/01/18
Total Return 1031%Days: 3,546
yrs 9.74
CAGR: 28.3%KeymasterThanks Richard, give me a day to review and upload a new version with comments.
KeymasterHello John,
thanks for letting me know. From looking at the screenshot there is something off in the cell “Constraint Min”, which shows #NUM. Probably either from a previous run which did not finish or a manual input? Try downloading a fresh sheet, then it should work.
Anyhow just looking into it and some other issues Richard pointed out here: https://logical-invest.com/forums/topic/portfolio-builder/#post-52143
Will upload an updated version shortly.
All the best,
AlexKeymasterThe default value for the volatility attenuator is 1, e.g. if left blank the “modified sharpre ratio” we´re optimizing for becomes the standard sharpe ratio.
Here much more about the nuts and bolts involved, see especially video 3.5: https://logical-invest.com/video-tutorial-quanttrader-a-complete-walk-through-for-new-users/
KeymasterAgree with your comments, it´s a bit like a gigantic tug of war between two forces of wisdom:
– Strong fundamental growth, inflation around 2% target, full employment, thus risk of inflation, thus more hikes anticipated
– Maybe too high valuations (cracks in growth story), tax “goodies” aleady priced in, aggressive hikes might damage equity valuations, so FED probably careful, so maybe long-term yields already overshoot hike expectations. Plus yuuge rate differential between US and Japan/EU pulling money into US treasuries, thus keeping yields lower.Hard to tell how this is playing out, so keeping some treasuries is reasonable – especially as the now infamous short term correlation which broke down in recent months has been working better recently again.
KeymasterThanks for the comment, indeed the different naming is confusing – but it’s all one single strategy: Selecting the Top 4 from Nasdaq 100 and adding a hedge component.
The signals on the website are the same as from the “Nasdaq 100 Hedged” in QuantTrader”, where you can also see the unhedged “Nasdaq 100” sub-strategy. Will clean up the naming and descriptions as suggested.
KeymasterThanks for the good discussion! HEWC volume indeed is small and has further dropped the last days. But technically speaking, QT has a close price for all days, e.g. there are no “empty” days which might create data issues, see screenshot.
Also there are constantly bid/ask available with a 5 cent spread, so trading the ETF with a limit order (or IB Algo), so trading 1600 shares, which corresponds to a 100k investment in the WorldTop4 (100k * 0.4 HEWC / 25 per share) should not be a problem. Keep in mind this – as other index pegged ETF by rule cannot deviate substantially from their underlying index – else this would be arbitraged away inmediately – so LI investors are not “making the market” here.
If liquidity still is a concern, there is no real alternative as a hedged MSCI Canada ETF, obviously EWC as a non-hedged ETF has much higher volume – at the cost of FX exposure.
KeymasterOur “modified sharpe” considers also upside volatility, see here for math. We could do variations of that in future, but honestly would not even be on Top100 list right now – list get’s longer each day.
I´ve done some backtests using Sortino Ratio before and there are circumstances where it absolutely makes sense and delivers better results, especially when using single and “bumpy” stocks, but generally do not feel it would be much of a boost in the mostly ETF based strategies. That’s out of the hips, honestly have not backtested our strategies using Sortino for a while now.
KeymasterHi Daniel, the consolidated signals are available from the “members area” menu, just deleted the direct link from the portfolio builder to avoid non-subscribers getting an empty page.
Also QuantTrader uses our “modified sharpe ratio” approach, e.g. considers up- and downside volatility.
KeymasterThanks, we´ll update the Nasdaq list with the next release. For the time being you can replace it manually in the QuantTrader.ini. Just search&replace all instances of PCLN with BKNG.
KeymasterThe Online Portfolio Builder is limited in functionality compared to the Excel tool. In the Online tool you can:
– Visualize the pre-optimized portfolios and their statistics,
– Change allocations using the “Custom Portfolio” tab and calculate statistics on the flyBUT: You cannot run an optimization using target variables and constraints as in the Excel Portfolio Builder.
This is simply impossible due to the computation power required. It takes the Microsoft Solver around 4 minutes to compute on optimized portfolio offline on a fast computer, or 30 minutes for all pre-configured portfolios, and the MS Solver is quite a clever and speedy guy :-). This cannot be done in an online tool, or at least not with the means we have available.
We might be able to implement a brute-force optimization algorithm in QT in the future using a step-size mechanism as we do in our strategies, but this is not in the Top10 items on our prio list.
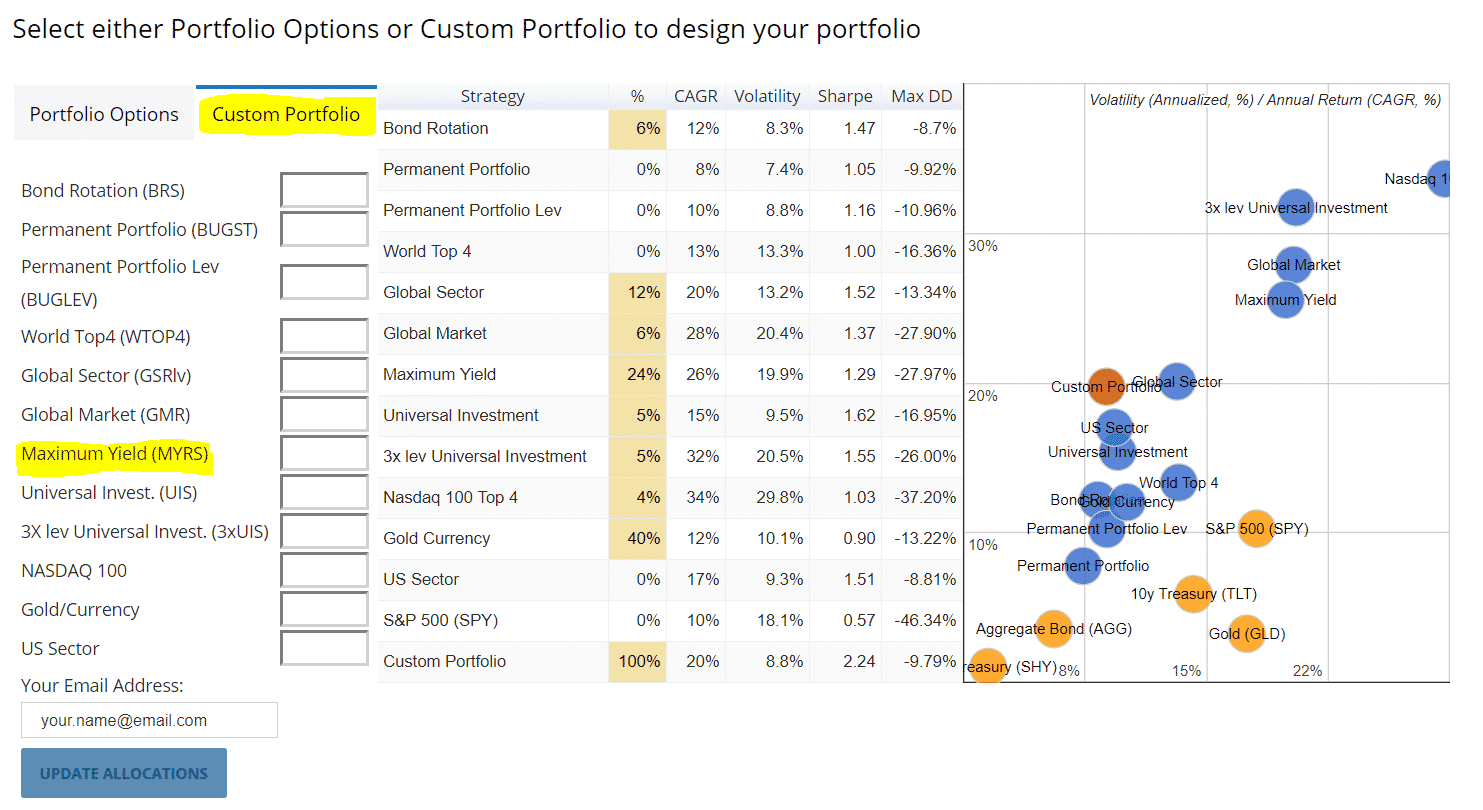
So for the time being please use the pre-configured portfolios in the Online Builder as starting point for adapting them towards your own custom portfolio like shown here: https://logical-invest.com/wp-content/uploads/2018/03/Custom-Portfolio.png.
To run optimizations excluding certain strategies or setting custom constraints please use the Excel Tool: https://logical-invest.com/?gfid=15
Also let me highlight another point I have on my mind since we updated the hedges in the strategies, and this has been point of discussion in the past. The Portfolio Builder uses HISTORICAL (aka “frozen”) allocations and performance statistics as a subscriber would have been invested. This means changes to the strategies like in the new hedge mechanism are only reflected going forward – not for the past. This makes sense as our long term subscribers can see the past as they have been invested in – but might be confusing when looking for a new portfolio going forward – with changes in the strategies.
In contrast, QuantTrader uses the most recent strategy configuration for its backtests, e.g. each time you change a parameter the historical data changes. This is useful for setting up a new strategy, but prone to permanent over-fitting if not used properly – and does not reflect the reality of a subscriber having been invested in a strategy or portfolio.
So now that you can use both tools, it´s a good practice to compare the performance statistics from the Online Builder with the backtested performance in QuantTrader. Simply put your strategy allocations into the Consolidated Signals tool in QuantTrader to see how the new hedges would have worked in the past, here a tutorial: https://logical-invest.com/consolidated-signals-interactive-brokers-portfolio-rebalance-tool/
KeymasterHi Stefan,
regarding 1) we´re just doing some video tutorials and will cover the optimizer in detail. Same to 2) not yet, in progress.
For 3) training, I´m sure Frank will happily meet with you when around Zurich area. But either of us can walk you through using Skype at anytime.
KeymasterRichard, thanks for the feedback! Will include the meta-strategies into QT, and again promise: PB will stay till we´ve all prominent features in QT! :-)
KeymasterAbsolutely correct, Mark, thanks for the summary!
Indeed I was going to include the pre-configured portfolios from the Online Portfolio Builder as meta-strategies into QT, but then Frank was quicker assembling the new Consolidated View – which basically gives you the same ability inputting the %s of your online portfolio. As meta-strategies you would not be able to change the fixed allocations, while in the Consolidated View you can blend as you like and save them, so think this is much better.
So I think this is not necessary anymore – if there is no other feedback.
KeymasterHello Gordon,
our strategies are mainly based on the modified sharpe ratio, e.g. return and volatility. Mean reversion is so far rather an add-on to catch short-term price action reversals. Interesting enough, it works both for positive and negative weights, e.g. subtracting short term “over-shoots” that might revert to the mean, but also adding short term “under-valued” which might pick-up again.
So you see how it works, the formulae is simplified: Sm = (Rl + (MRw * Rp)) / V ˄ f, where MRw is mean reversion weight, Rp the return during the mean reversion period.
To your question:
1) Currently these variables are not considered in the optimization, and probably adding them would considerably slow down the brute-force optimization, so not on the to-do list for now
2) I normally use only short term periods, e.g. 2 to max 6 days, depending on the overall lookback period. Weights mostly +100 or -100.Honestly never tried bigger values like +/-300 weight and 20 period, curious how these work, please share further findings.
KeymasterThe pricing options, e.g. last period close, last close and intraday affect only the consolidated signals, not the backtest. Backtest is always based on selected trading frequency (monthly, bi-weekly..), and executed at the close. To delay backtest use the options in Settings, e.g. cut signals delayed by x days, trade delay x days.
KeymasterFor those wondering where ZIV might stand assuming a recovery in the VIX term curve (or if things worsen), here a quick and dirty estimation: https://docs.google.com/spreadsheets/d/1NqhMq4wpt6WT5LQohVjkPNSlOIkXf2eQ515zcpzeNH8/edit?usp=sharing
Just input your assumption of future VIX term curve in the green cells to get a very rough idea where ZIV price might be. Very rough as this ignores daily rolls, roll losses and further math. But hope it gives you an idea just based on F4-F7 prices.
The sheet is protected, but you can make a copy in your own google drive (“save a copy”).
KeymasterThanks for the confirmation, Edmund. Here the link: https://logical-invest.com/ziv-myrs/
KeymasterPetr,
it´s a tough risk / benefit calculation right now for MYRS, here my thoughts, no advise though:
Risks:
As Frank pointed out, the current macro environment is very split. On one hand great GDP, good Earnings, Growth plan, stimulus, etc. On the other hand the inflation and yield threat. Markets have recovered a bit, but there is the risk of another down-leg, which might push mid-term VIX curve even higher, so serious threat to ZIV.Benefit:
For ZIV to recover its YTD losses (ignoring the roll losses in this simple calculation), the mid-term curve would have to get back to the 12-15 level (F4-F7), and honestly I do not see this in the next weeks. If the mid-term curve would get down to a 15-17 range (F4-F7), ZIV should get to about 75, max 78. That´s a 7-8% from the current level, but far from the 94 we had on Jan 12.Also, if and as long the term-curve remains flat or even gets steeper, then the roll-losses will further eat into ZIV.
So, question is how much further down we might get from a macro perspective, vs how much you can possilby recover sitting out the ZIV losses. Or from a different perspective, is ZIV the best holding to benefit from a further recovery?
My personal call is also to rather step out of MYRS for a while (even if it hurts a lot!) and look for a broad diversified portfolio to cover both up and down scenarios.
KeymasterHey, here comes the challenge, like it. Mine is not much of a surprise if you watched the recent video tutorials and previous comments. I´ve been following the Max CAGR <15% volatility with slight variations for quite a while now. But since some months felt the low vol "trap" was growing with spectacular returns but muted volatility in 2017 so did a management-override to lower the MYRS portion and put some protective puts in place early Jan this year. Probably still not enough, dog food got a bit sour recently, but sticking to plan so far ...
02/08/2018 at 6:19 am in reply to: Any Alternative for UGLD, cause Merrill Edge is blocking it #49950KeymasterWe´re aware that different brokers and pension plan sponsors have some limitations, the problem is that these are not uniform and it´s a little boy-scout exercise to find out which broker or sponsor allows which instruments. For example some strictly do not allow any leveraged or inverse ETF, some just restrict MLP/commodity pools.
So we need your support in screening alternatives, looking for similar track record (adjusted to leverage) and reasonable liquidity and expense ratios, then check with your broker/pension plan sponsor.
The sites are best for US investors:
http://www.etf.com/etfanalytics/etf-finder?segment=sg_Leveraged+Commodities:+Precious+Metals+Gold
http://etfdb.com/screener/#page=1&asset_class=commodity&commodity_types=Gold&leveraged=2x&inverse=falseFor EU investors and MIFID II compliant funds please use:
http://tools.morningstar.co.uk/uk/etfscreener/default.aspx
http://www.morningstar.de/de/etfs/A quick look at a 5yrs chart shows you how well the alternatives track the ETF, example: https://yhoo.it/2nNfjPn
Again, we´re looking into it also with support of EPG, but we appreciate your support.
For UGLD you can indeed use GLD, but then need to buy three times the suggested allocation. Either using a margin account, or if not possible reducing all other positions so they total 100%. See here for the math: https://logical-invest.com/forums/topic/gold-currency-strategy/#post-45287
KeymasterAllow me to re-post this from another post, maybe a bit of light in troubled waters:
I can surely understand the frustration looking at my own account!
This probably took all by surprise, but here is the thing: As many followers will recall, we were in a similar situation in August 2015 – when some stepped out, and missed the recovery and right part of the chart in 2016 and 2017.
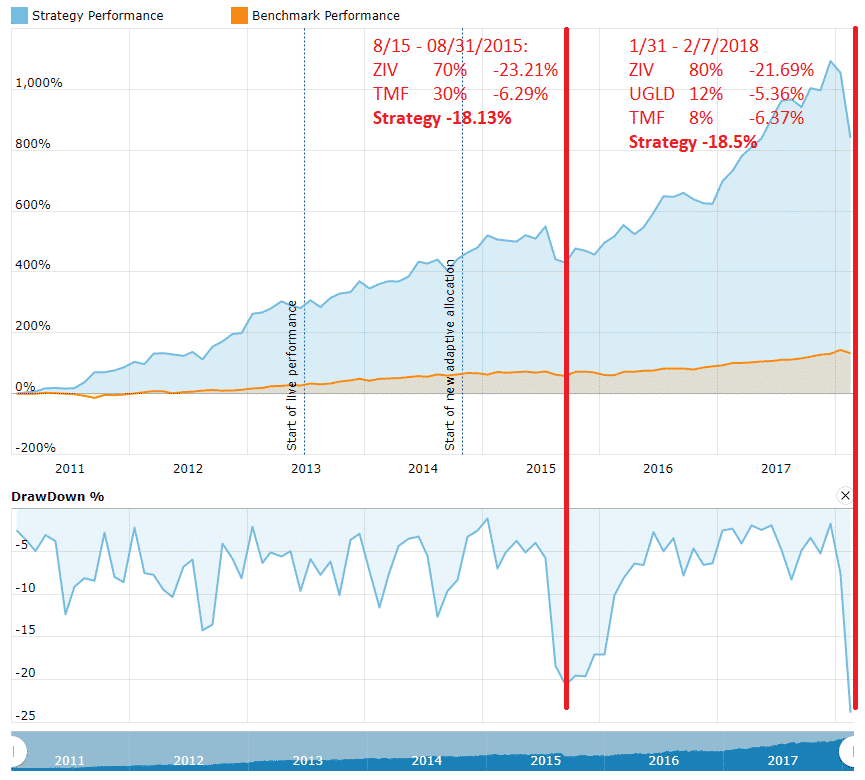
Indeed this marks a new max drawdown for MYRS from the top on Jan 8th. But the move is so far well within the historical volatility range of MYRS. If the VIX term-curve keeps on coming down this might look much better at the rebalancing day end of next week. Stepping out at current lows is not recommended.
KeymasterI can surely understand the frustration looking at my own account!
This probably took all by surprise, but here is the thing: As many followers will recall, we were in a similar situation in August 2015 – when some stepped out, and missed the recovery and right part of the chart in 2016 and 2017.
Indeed this marks a new max drawdown for MYRS from the top on Jan 8th. But the move is so far well within the historical volatility range of MYRS. If the VIX term-curve keeps on coming down this might look much better at the rebalancing day end of next week. Stepping out at current lows is not recommended.
KeymasterIndeed, would also appreciate a time travel to Jan 2017 right now :-)
KeymasterYes, the data in the return table of the online builder is based on weekly data, so Feb will start showing up mid next week. For daily data look at QT, the strategy pages or the excel offline tool.
KeymasterI´m working on a small tool to extend the most used tickers with recent inception by synthetic data automatically. Got a first version ready, but still doing some testing and verification.
Idea is to have an batch input list like:
TLT VUSTX (which means extend TLT data by the mutual fund Data using a return multiple of 1)
TMF TLT 2.8 (which means extend TMF history by TLT using a return multiple of 2.8)
ZIV ZIV_S 1 (which means extend by the synthetic data we´ll make available on our server)
.. same for SPXL, UGLD, and all other tickers which currently hamper longer backtests..Output will be synthic symbols like TLT$, TMF$, ZIV$ which you can use in backtest versions of strategies.
Will first develop as small app in order to allow Frank to work on other QT “hot list” items, but then hopefully we get it into QT later.
Hope to have the tool ready next week, then I need some brave and geeky subscribers to test and verify. Interested volunteers pls send a note to [email protected].
KeymasterHi Mark,
indeed there was a change in the allocations for the US Sector strategy between our online signals and what QuantTrader showed after the close.
Based on feedback we received by email we looked into it in detail, and it´s due to timing differences when we cut the online signals in QuantTrader. Also it´s based on a very marginal call in the ranking algorithm, the difference in the ranking is only a fraction of a percentage, which is basically saying it´s an “either or” call and both are statistically the same.
Main reason for this “timing difference” is that the data adjustment for splits and dividends at the data providers are done a couple of hours after the close. As we try to have the signals out for breakfast US time there might be still minor adjustments in the raw data when we cut the signals. We thinks it´s a good balance between speed and accuracy to stick to the current time-table.
KeymasterThanks for the feedback, appreciated. We´re just softly starting to motivate the use of QuantTrader. We´ll keep adding the requested features and provide training as requested – before we retire any of the other tools.
KeymasterHi Daniel,
yes, we had some problems with the Online tool in the early morning US time with UGld and US Sector not being properly displayed. I see this is when you were most busy, sorry for that. QuantTrader is much more stable as it is an integrated application, not relying on the several queries I´m doing here. Once our followership gets acquainted to using the brand-new Consolidated Signal functionality in QuantTrader we´re going to phase out this online tool.
Glad to get your feedback on the QuantTrader functionality, can download here.
KeymasterThanks, fixed!
KeymasterThe description and price of UGLD was not properly populated, that’s fixed now, sorry for the glitch. MYRS is 80% ZIV, 8% TMF and 12% UGLD, but the table moved due to missing UGLD description.
01/30/2018 at 9:18 pm in reply to: Using synthetic data or external data sources in QuantTrader #49599KeymasterHi Derrick,
you can probably use GLD data, multiply daily returns by 2.8 and then calculate prices backwards using the last available UGLD price, see TMF/TLT example I´ve posted in Excel. Have not done this for UGLD yet, so to be sure also calculate forward to see how good it matches. Bit of fiddling around in Excel, but works fine – we´re looking into how to automate this further.
Pls share your findings with the crowd. :-)
KeymasterOk, let me see how to most easily do a downloadable sheet in IB format. And heard you, EPG will approach you to see how to limit your suffering % wise :-)
Was talking about OTM put/calls on SPY (or IWM), currently cheap as never due to low vol and low put/call ratio.
KeymasterHi Daniel,
let me see if I can export in the IB format, but actually it’s probably quicker and safer if you do manually. My biggest concern is safety, e.g. prefer everybody spending a minute more and making a conscious reality check before uploading. For example if you’re holding other stuff in your account beside LI strategies (let’s say 70% LI, 30% others) you must manually reduce the percentages in the upload file to total 70%, and either set the other percentages to total 30% or leave them blank in the IB Portfolio Rebalance tool.
The format itself is simple just 5 columns with 2nd being ETF/Symbol, 3rd exchange (SMART) and 4th the %allocation, example:
DES, GLD, STK, SMART/AMEX,11.4Attached an example file, what I normally do is to download/export the current allocation and then fiddle in the new percentages, save as csv, import, trigger orders, set to IBAlgo (if not default), adjust limits, pray, count to ten, and hit transmit..
I very much enjoy automating things, but this 5 minute routine makes me sleep better .. and protects me from divorce.. :-)
Re limit orders: Yes we’ve backtested many different options, but it always boils down to getting whipsawed, e.g. selling low and missing re-entry. With the “mini-crashes” we had more frequently in recent years this can happen in question of some minutes.
If you want to protect “tail-risks”, e.g. harsh crashes better do a free or low-cost collar with options, e.g. buy -10% long term (6mo, 1yr) puts and finance them (partially) selling +10% (or lower) calls. Can do this free or for around 1% of assets depending on protection, and with the low volatility and upside skew it’s a good time.
KeymasterWit the inclusion of ACWV (iShares Edge MSCI Min Vol Global) we try to cover all regions which do not have a specific ETF. But you can try by yourself using the QuantTrader free month trial here: https://logical-invest.com/rent-a-strategy/backtesting-software-quanttrader-free-trial/
KeymasterHi William,
the Maximum Yield strategy is already quite aggressive without leverage, and we would not recommend anybody to invest more than 15% of net-worth into it. Now, leveraging an already 3 times leveraged bond ETF and a short volatility component would make this really a wild ride, independent of borrowing expenses and costs for leveraged ETF.
The historical volatility of 22% and a max drawdown of above 20% are further increasing when applying leverage, while the return will not increase linear due to borrowing costs.
I’d strongly suggest you consult with a registered investment advisor before doing such an investment, and rather have a look at some more balanced portfolios using our Portfolio Builder.
KeymasterHi Richard, simple reason was that Frank was faster uploading the new version than me updating the download page. See here, latest version is always first in the version log.
KeymasterIf you’re not yet subscribed you can see the past allocations here: https://logical-invest.com/portfolio-items/us-sector-rotation-strategy/
Once subscribed you get them by email and can also see them here: https://logical-invest.com/blog/strategy-signals-simple/
KeymasterWe received an e-mail from Michael O:
The 3X leveraged universal investment strategy returned 80% in 2008, amazing! The Nasdaq seems to outperform the S&P 500 most of the time so why not have a strategy that uses a leveraged ETF that tracks the Nasdaq like TQQQ?
Here a quick test of the strategy using TQQQ, with the same parameters as the SPXL strategy, indeed looks very good, see below. It does not beat TQQQ performance wise, but very much lowers volatility and drawdown, thus Sharpe is much higher with 1.8. Can´t go easily back before inception of TQQQ in 2010, this is something to be checked with synthetic TQQQ data.
The screenshot is from our software QuantTrader, can try out for a month for free here: https://logical-invest.com/rent-a-strategy/backtesting-software-quanttrader-free-trial/
KeymasterHi Marcin,
could it be that you have connections to the North Pole? Heard rumors that Santa is preparing exactly that :-)
KeymasterHi Patrick, some months ago I also wondered and did some quick tests, sadly do not have the analysis and charts anymore, will try to redo later. My findings then were basically two, here just as notes w/o data support:
– The increasing coordination among central banks to steer monetary easing and (intended) tightening has caused a lot of “macro-events”, which make it hard to find long-lasting trends in broad global equities as employed by the GMRS. See especially 2015 where the strategy basically hopped from one ETF into another, as trends were “broken”. Same happened to a lot of other momentum based strategies out there.
– Correlation between broad global equities is further increasing, this has already been a fact in down-turns (GFC, EU, China, etc), but I observed it´s also more and more increasing in calm times. Again, this is hitting most GMRS due to the involved broad ETF, while in more specific industry or country ETF there are still trends and low correlations.
What to do? Honestly think we still need to wait. 2017 so far has been too strong in broad indices (everything going up) as to be able to draw conclusions from the good performance. Once we see a bit more volatility in markets we should see how trends and correlations behave. For the time being GMRS is still a very solid diversifier in a broad portfolio, you can see how it complements other strategies in the Portfolio Builder.
KeymasterYeah, the 64k was me, sorry for that ;-)
KeymasterHi Daniel,
for the time being EPG is the only adviser offering our strategies under MAs, we´re discussing some other options, but not yet ready. Pricing is a question of scale, we´ll definitely reduce the % once reaching some 40-50m USD – but not yet there. For a 150k amount the 0.9% is close to a wash for our all strategy subscribers, only 30 USD more a month to have your account managed, we feel that´s not bad to start with, but indeed will share future scale effects with our subscribers.
In IB I use the “Rebalance Portfolio” tool, where you can simply upload the tickers and target % to rebalance. It then creates the orders, which you can default to “IB Algo Adaptive” in your config, and just let them run with one click. I do not want to fully automate this as it takes some practice and always should be monitored by the account holder. But after some practice you can rebalance in just 5 minutes or so.
Attached the CSV for rebalancing a Max CAGR <15% Vola portfolio as of yesterday. After uploading you just have to review other positions, e.g. set YCS to cero, or adjust % down if you´re not trade 100% of your account with this allocations, e.g. have other positions.
Here the help in IB: https://www.interactivebrokers.com/en/index.php?f=20160
KeymasterI normally prefer doing direct FX, so short either Yen or Aussie. The fees from the borrowing are lower than the sum of ETF cost and leverage effect, and I see the FX effect directly in my “virtual FX account” which is helpful as I also have some other currencies. The latter is not much of a benefit if you only run USD normally.
KeymasterHi Mark, I hear you and this is really a pain in the neck. It´s just that using Gold and FX is such a nice hedge, but indeed hard to trade in deferred accounts. We also keep looking for alternatives, please drop us a line if you find something at your end.
KeymasterHi Nelson, indeed, quite some movements last days, and today once again. Prices in the online tool are updated once an hour.
KeymasterHi Daniel,
the Gold/Currency switched to 50% CROC, and indeed that’s the first time since 2015, see here: https://logical-invest.com/portfolio-items/the-gold-etf-currency-strategy/
KeymasterHi Mark,
thanks for the hint, seems the input file caching was too long, so you always pulled an old version. Have updated now and just pulled with last date 11/29/2017, please give it a try to see if it works properly.
The input file from our server is this here, you can also use for other purposes or to validate it should add the last day about mid-night after last close: https://logical-invest.com/wp-content/csvrepository/PortfolioBuilderExcel2.csv
All the best,
AlexKeymasterUpdate November 2017:
We’ve created a new download page for QuantTrader updates, please see in future here.
The last version is: 507S
Updates:
– Now intraday prices work again
– Consolidated Prices now lets you display 3 different allocations
1) Invested allocation based on the end of month prices. This is the allocation we give in our newsletters
2) Actual allocation based on the last close
3) Actual allocation based on the last close and the actual intraday price
If you intend to invest at last close prices, then you should start QuantTrader the last traiding day of th
month, about 1 hour before close (about 3pm). Now you calculate the allocations using the actual allocatio
based on the actual intraday price (selection 3). This way you can be pretty sure that there are no change
for the allocation compared to the official one which we calculate using the closing price
But be aware that for strategies with many stocks like Nasdaq100, the ranking can still change within th
last trading hour
– In the system settings you can define the provider for intraday prices. You have the choice between IEX an
Google. Yahoo which was our provider until now does not deliver intraday prices anymore.KeymasterWe’ve created a new download page for QuantTrader updates, please see here.
KeymasterHmm, not an easy question if you’re referring to short term, e.g. <1yr. For current income probably going either dividend stocks (which is not really our main interest) or shorter bonds / munis (also not really our expertise).
We're rather medium/long term focused, so if your outlook is >1yr (with sufficient cash or income for expenses) then a broad and diversified portfolio of our strategies in my opinion is the best balance between capital growth and withdrawal rate.
KeymasterThanks for the comment, appreciate you’re looking deep “under the hood”!
Indeed there is a fix needed, but bit more complicated so let me have a detailed look and upload a new version. The formulae was intended to adjust the effective trading days for the strategies which started after 2008 (MYRS, 3xUIS, GLD-USD), but indeed now change all CAGR. The overall effect is small, but indeed needs to be corrected. Give me some days..
—————
P.D. Always appreciate further input or enhancements of the Excel tool, this is really meant as a toolbox for the community, so keep it going, Excel gurus out there ….KeymasterHi Patrick,
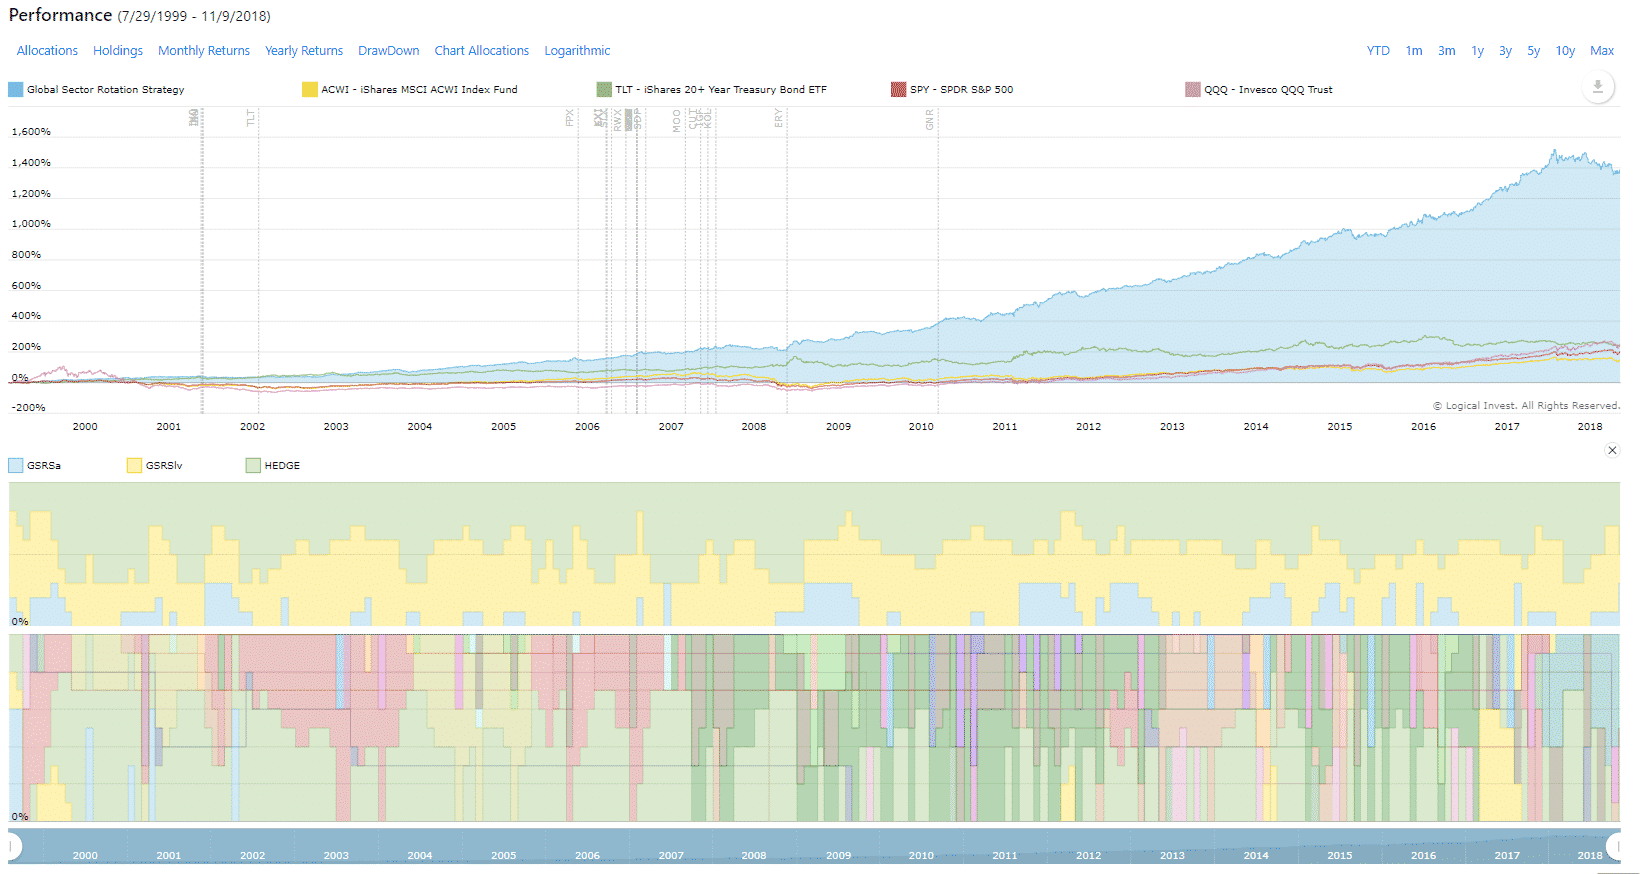
correct, we only publish signals from the inception day of the earliest available ETF, in many cases either TMF, ZIV or other one limit the availability. We could use synthetic data, but due to potential inaccuracies have so far opted not to do that. For all strategies but MYRS we have published these backtests as separate posts, MYRS does not make much sense before 2011 as only then with the inception of the volatility ETF the vola trading became popular for retail investors. Looking into 2008/2009 of course would be interesting from an academic perspective, but is of little practical use.
KeymasterHi Derrick, thanks for the comment, fully agree.
The danger indeed is not so much when volatility builds up over several weeks, but rather the sudden drops from macro-events like in August 2015. In this case the lookback period and bi-weekly rebalancing does not allow the strategy to rebalance to bonds, thus the hedge is not much of use. On the other hand, trying to rebalance quicker or making the system more responsive with shorter lookback results in whipsaw, where you sell cheap and buy-back high.
I just wanted to highlight that these risks are part of short-volatiliy strategies, thus the allocation should be in a safe proportion to overall account and net worth.
KeymasterHi Daniel,
yesterday you queried twice the Max Sharpe portfolio, where ACWV is included, and today only MYRS. Good hint, will try to include the strategies of the custom query, give me some days.
Overall is the tool now easier to handle? Any feedback is appreciated.
P.D. The log is only for this kind of analysis, not doing anything else with the data and delete it regularly. Can use [email protected] as email input if any concern :-)
KeymasterExactly, that might be a highly profitable game – if world end is postponed again, as yesterday. Either buy ZIV, or directly short the mid-term VIX futures after a big jump. Again, this is not for the faint-hearted!
Let´s say VIX 4th month futures are around 19 before the event, then suddenly jump to a level of +30. If you bet this was not world-end, then you might short at 30, wait till they come back to a level of 20 and make tons of money.
Whats the problem? They might not come back, but further climb – see levels of 50 in 2008, and then move sideways for some time: Then you are eating into margin, and if not properly backed as you bet too much, even get a margin call – out, finito, hasta la vista. :-)
Here link to synthetic data for Vix curve and deritvate ETFs back to 2004, the best source to by knowledge, but always take with a grain of salt: http://investing.kuchita.com/2014/10/23/ziv-historical-data-and-pricing-model-since-vix-futures-are-available-2004/
And below chart with 4th month future, VIX spot and ZIV, so you see the difference. In 2007/8 indeed ZIV would have dropped from levels of 60 to 10, minus 83% leaving you with 17$ out of 100$ invested.
And also todays quote around 10:30 am EST so you see the nice reversal from yesterday – if calm continues and Vix curve comes down then ZIV will be back to prior levels – if.
All the best,
AlexKeymasterGood Morning Daniel,
The MYRS mid-month signals are always published during the night/morning of the 16th (UST), so a couple of hours after your post – now are in, and no change in %.
Not sure I get your point about ACWV, it’s not part of MYRS. Please clarify.
KeymasterAnd because the proof of the pudding is in the eating, today is another nice example of above.
See how a 0.76% drop in SPX triggers a 23% increase in VIX spot, a 2.9% increase in the March 18 VIX future – while TLT (TMF) go nicely up by 0.9% (2.7%) – so at least up to now off-setting the 2.53% drop in ZIV.
BUT if today is the dooms day some have been waiting for, this will probably not hold. If still alive will post the same after close :-).
KeymasterThe assumption is that TMF will absorb some losses if/when ZIV goes down, and that’s a fairly yuuuge IF.
Remember, ZIV is shorting the 4th,5th and 6th future of the VIX term curve, so each dollar these increase is a dollar hit to ZIV (ignoring some other effects).
I´m just looking at the Term curve, and you can see in attached chart that compared to Oct 31st the futures went up by about 1.5 (actually 1500, as multiple is thds) – this explains the dip in ZIV. Now, one thing must be clear when investing in inverse / short volatility: If some fecal mass hits the fan, even these medium term futures can go through the roof and resulting losses are theoretically unlimited – the ETF ZIV probably would be terminated and something between 0 and estimated 20% would be payed out. That’s the ZIV part, now to the hedge.
TLT or it´s triple TMF up to our research is the best hedge when shorting volatility (beside some exotic option or future things which normally are out of the reach of retail investors). The a historical correlation of -0.45 to S&P500 comes from two effects: 1) Economic cycle and interest rates, but more importantly 2) “flight to safety” when things go down.
Now, there are three main problems with that:
1) We´re investing in inverse volatility, not the S&P500, and as stated above, there is a yuuge lever (formally beta) between both, e.g. if S&P500 dips by 1% VIX goes up 1% times X, and this X can be exponential, so the above stated correlation which provides a hedge to S&P500 will fall short in extreme movements of the VIX term curve. But again up to our research bonds are the best hedge for retail investors.
2) Correlation is not causality: Means there is no direct cause-effect relation between TMF and ZIV. As in recent days BOTH can go down due to fundamental reasons (rate hike expectation / China/ Japan in our case). How long? Depends :-) Sometimes both can decouple for months, see the correlation chart.
3) The allocation between ZIV and TMF depends on the medium-term optimization the algo is doing. If we´re 80% into ZIV like in the current allocation (because of relatively muted medium-term volatility ), then the 20% TMF are not too much of a hedge if volatility suddenly spikes as the last days).
So, as we´ve repeatedly stated, before investing in MYRS:
– Make sure you really and deeply understand what it is and how it works – and I mean “really and deeply”
– Do not invest your home and pension into this strategy – it´s meant as a complementing return boost for a well-balanced portfolio – I personally would never ever invest more than 15% of my net worth into this, and I´m not retired yet (well, a bit :-))Answers in short: Yes you should be concerned (that’s a natural process), level depending on your “really and deeply” understanding of, and % allocation to MYRS. And no, MYRS has at least the potential to take your last trouser from you in a bear market, will this happen? Who knows.
Attached the charts, hope to continue discussion.
All the best,
AlexKeymasterKeymasterHi William,
scaling into a strategy when you first start with it is actually very effective – both for your stomach as you get comfortable with it, but also statistically as you “average-in” as you describe, so avoid betting on prices in a single point of time.
Re timing issue: Yes indeed, but everything is expensive and at historical highs – and waiting at the sideline with 100% cash is always a bad idea. What you can do it to go more conservative with your overall portfolio while your confidence in the strategy and markets increases.
KeymasterJust save the ini file into your QuantTrader folder, then use the “load” option from the menu in QuantTrader.
KeymasterThe MYRS is price-action based, e.g. the ranking of the ETF drive the allocation – we´re not directly looking at the VIX curve, which is roundabout 80% of time in contango.
And here an article by Frank of why we prefer ZIV over XIV.
KeymasterKeymasterTo add a technical perspective, if you look at the Vix term curve, especially the F4-F7 contango – or difference between the fourth and seventh month future, this is a good indicator for the MYRS performance harvesting the “roll yield” in normal times, when the curve is not inverted.
KeymasterUp to our knowledge the limitation is only for inverse leveraged ETF in pension accounts, e.g. IRA or 401k. With a standard account you should be able to trade the ETF CROC with a limit order as stated above.
If you cannot trade CROC or use leverage, then the only way is to use FX without leverage, and re-calculate your allocation so you mantain the original leverage in CROC and YCS, so reduce GLD accordingly to stay within 100%.
KeymasterI´m getting an average spread of 10 cents when looking for today, so you could set a limit order at mid-point or even below and wait some minutes if it fills. If you use interactive broker, you can use the “IBOrder – SMART”, which will move your bid slowly for a best fill – probably other brokers have similar tools.
Alternatively, if you have an margin account and can trade FX, you can sell/buy AUD in the double amount or % allocation to mimic the 200% inverse leverage – then you benefit from much higher volume and basically no spread.
KeymasterThe “Invested” tab is the past allocation, e.g. from last rebalancing. The “Actual” is the current, a.g. as you would rebalance if today was rebalancing day.
KeymasterMichael, thanks for the flowers!
As long as the inverse correlation of the employed bonds to equities hold, it´s actually better to use them as hedge. Using cash means you take “skin-off-the-market”, so probably after a dip have already lost some in equities and will probably loose the re-entry.
Staying in bonds, you normally will off-set part of the dip – or even gain some money.The only way we still use a cash-component is to set a volatility constraint on portfolio level. You can test your own variants of cash as exit or as volatility constraint using QuantTrader, see here for a free month.
10/19/2017 at 4:49 pm in reply to: Brokerage blocking me from trading ZIV, is there an alternative? #46830KeymasterHi Aatif,
There is no replacement for ZIV, sadly it´s the only ETN in this category. You might get a waiver exemption from your broker, sometimes they do that – just ask loud and clearly. You might use VIX futures, but that´s a completely different game and bit complicated.
All the best,
Alex- AuthorPosts
