Forum Replies Created
- AuthorPosts
Alex @ Logical Invest
KeymasterTim, we do not expect our strategies loosing their edge because of too many people trading it, the volumes are just too big than our community moving the market.
KeymasterWe´re working on an automated solution using separately managed accounts, this will be interesting for followers too busy for manual rebalancing.
KeymasterHello Ivan,
Firstly, thanks for your interest in our strategies!
The 2x leverage in the portfolio builder is actually only simulating the leverage you would apply in your account. For the signals it is indeed a straight forward multiplication, but the portfolio change a bit due to underlying trading costs and different math when combining strategies. So, yes, it would be up to you applying the X times leveraged signals in your account.
We have no real experience using CFD’s as this is not needed when playing “safe” with max leverage of up to two times. Also we would not use them due to higher transaction costs (as you rightly point out) and them performing different than plain vanilla ETFs. Leverage is a dangerous game even using standard ETF, and even more when using leveraged ETF, this is why we do not advise any subscriber to excessively leverage or use exotic instruments.
Hope this does not discourage you, glad to further discuss,
All the best,
AlexKeymasterHello Ivan,
currently there is no way of running backtests excluding certain symbols as mentioned above. You might be right about your point of paying interest for bond CFD’s, wonder how that math looks like in detail (vs. reduced cost of capital as you do not invest in full instrument but only difference), would you share?
We will release out QuantTrader software at a more accesible price in future, then you couild do your own backtest.
Please give us some time though, have some things on the burner currently.
KeymasterHello Ivan,
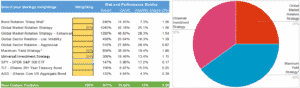
we´re currently not publishing this as an indicator, but the raw data is in the allocation return tables (Below Strategy Charts):
For the Nasdaq it would look like this:
Hist Return Distribution
Top 10: 180.04%
NFLX 39.85%
TMF 38.81%
NVDA 23.96%
ILMN 15.40%
GMCR 14.59%
AAL 11.06%
CHTR 9.90%
REGN 9.57%
AMAT 9.02%
BIDU 7.89%
Bottom 10: -40.61%
MU -1.70%
SPLS -1.77%
CELG -1.97%
VIP -2.10%
CSCO -2.68%
MYL -2.89%
ADSK -6.02%
WYNN -6.04%
SIRI -6.72%
GOOGL -8.71%Others: 124.55%
Total: 263.98%KeymasterHello Ivan,
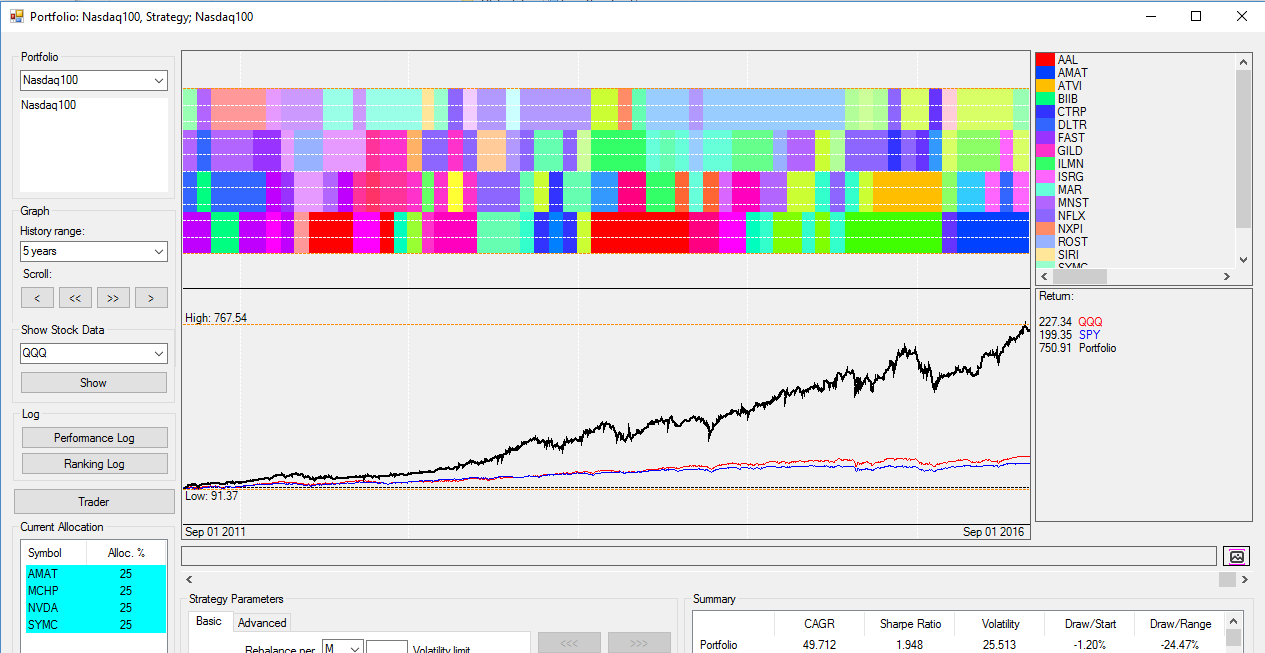
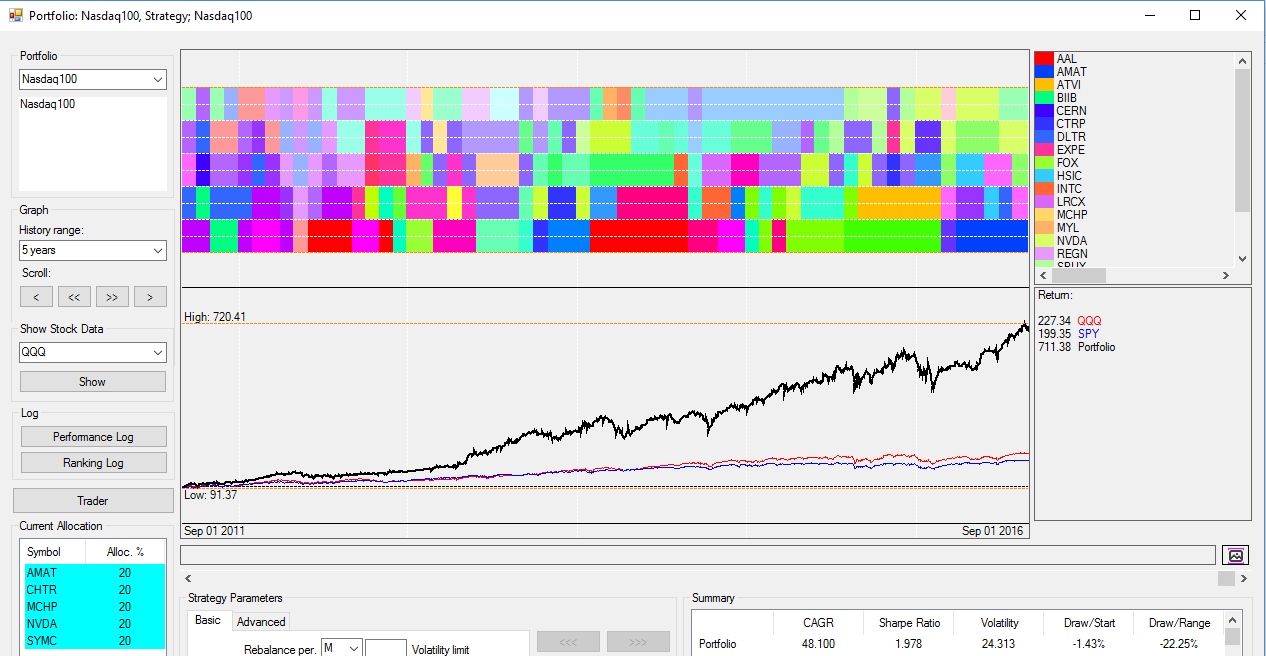
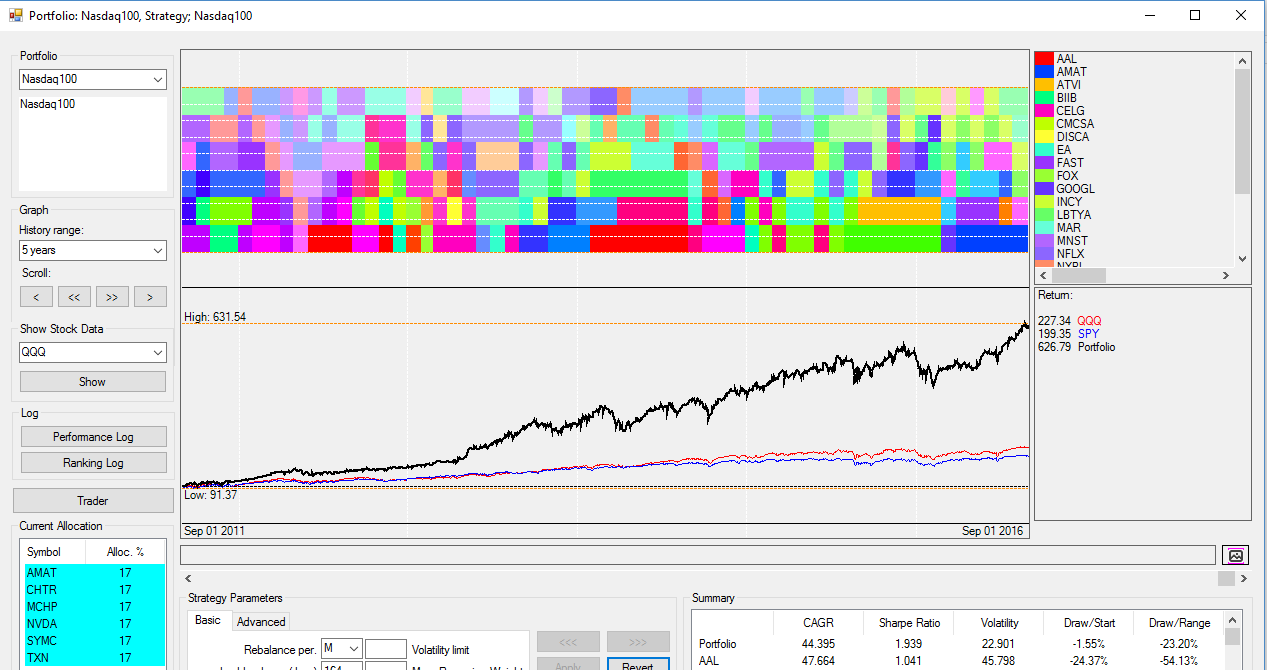
you can chose to invest in more than the Top4 shares, this is one of the reasons why we publish the ranking tables. We choose Top4 as balance between diversification and rebalancing effort, normally you would also diversify with a different strategy not to be too much in equities only.
The performance change between Top4,5 and 6 does not change much, only after more than 10 there is a significant drop. See here backtests for Top4, Top5 and Top6 for the last 5 years.
KeymasterSentient, last weeks were a wonderful example for this trade. Could you make use of the trade?
 Keymaster
XMonika, please refer to the Sept newsletter for the recommendation to go partially to cash.
There are two effects which are affecting Max Yield currently:
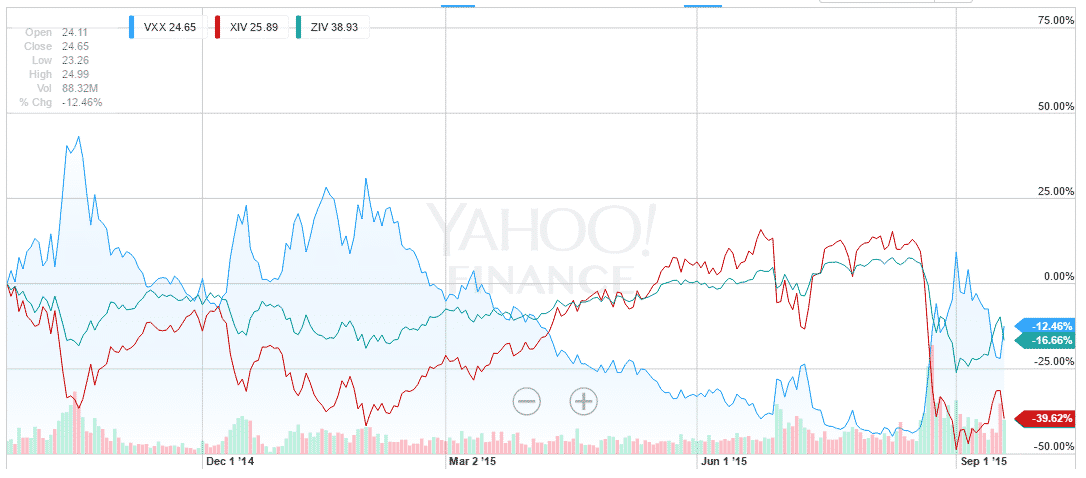
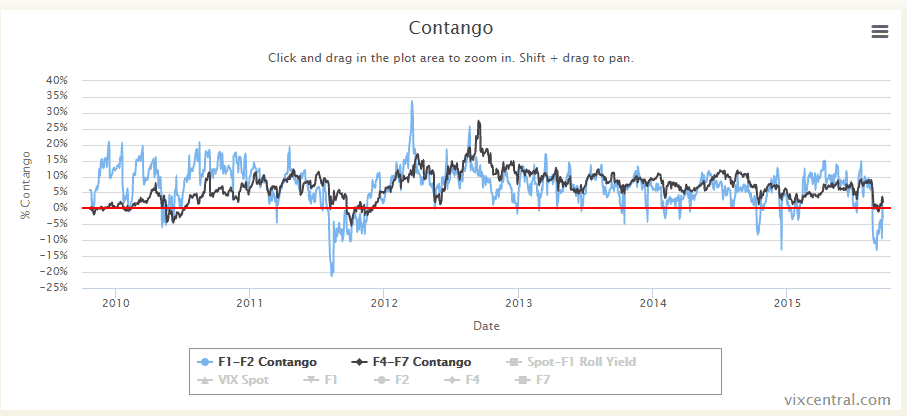
– For the first time since 2012 we’re again in a backwardation mode, e.g. VIX 7 month futures below 1 month. This explains the crash in ZIV this month and also the inexisting premium from the roll-overs.
– Basically no trend in any market with high volatility resulting from China and FOMCIndeed a very ugly environment for Max Yield currently, but we are still confident in the underlying assumptions in the long term.
 Keymaster
Richard, sorry for the delay, but we’ve not been able to get to a stable version yet – but continue the development.
KeymasterAll, thanks for sharing your perception for discussion in the forum. As we have outlined in the monthly newsletters, this year indeed is a very ugly environment for our rotational strategies:
– Yellen / FED risk-on/off since February due to anticipation of rate hikes
– Europe / Greece risk-on/off environment during whole 2015
– Commodity crash (WTI, PM, FM, agri)
– China crashIn a nutshell, there is no trend in any market!
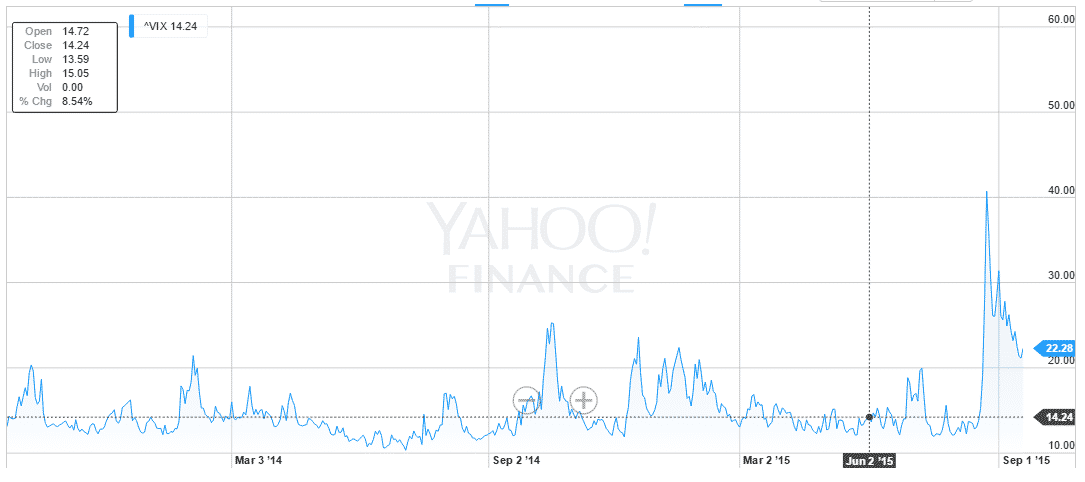
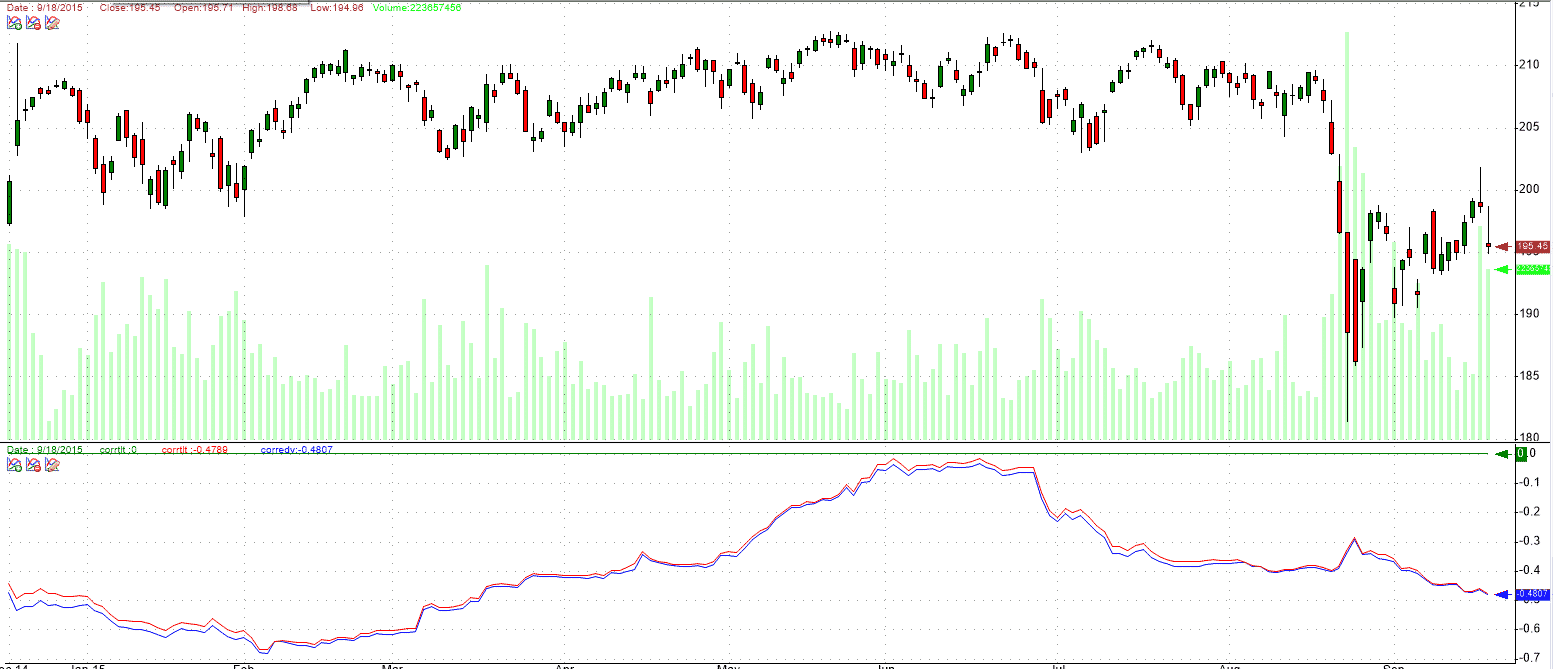
Volatility has been very low beginning of the year, but then suddenly jumped during last months:
For the first time since 2012 we’ve been in backwardation:
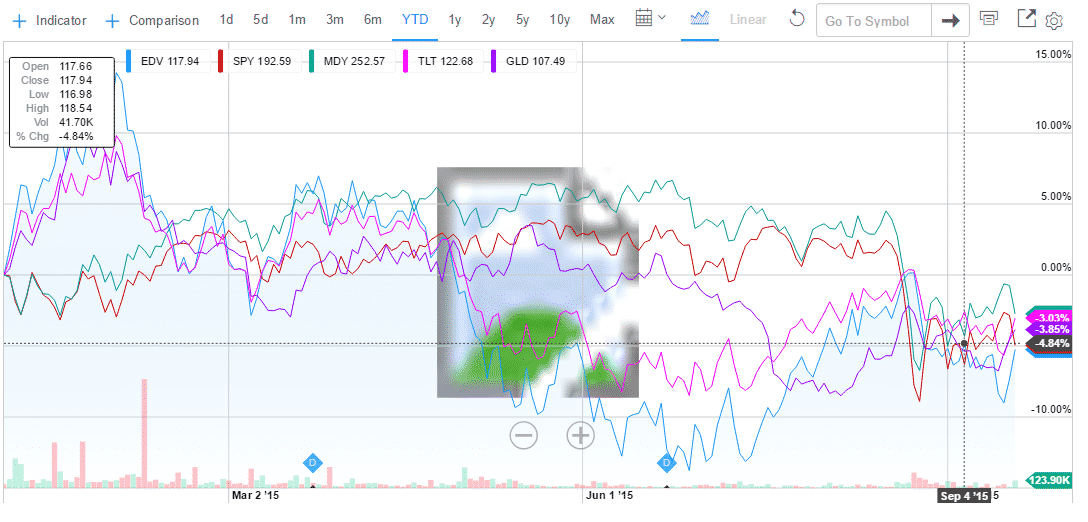
The only think which gives us some relief, is that the negative 60d correlation between SPY and TLT/EDV still holds. So even if it could not prevent the smaller corrections this year, we’re confident it will aliviate the effect from any major crash. Note we’re not talking about any hike in rates, but bonds acting as safe haven in case of any crash, e.g. attracting the money-flow and moving up by demand (independent of rate).
 Keymaster
Hi Sentient,
Franks’s comment was referring to some additional trading he is doing beside the published MYRS strategy. He indeed is betting that in case of spikes in VIX in generally calm market, the overreactions we’ve seen recently will lead to gains from short term mean reversion. So the “spike” of VIX above the level of 22% – which he determined as his threshold – in a generally calm market (avg 13-16%), in a contango market would be the “specs”.
To be clear, this is not referring to the backtested quantitative MYRS strategy, but rather a discretionary bet – quite succesfull during the last 12m though. So keep in mind this can always backfire if suddenly you end up investing into a major turmoil – do not take this as investment advice.
KeymasterRichard, thanks for the excellent suggestion, will add it to our list for developments.
KeymasterHi Sentient,
thanks for the excellent post and detailed questions, which I answer on bold below:
THESIS: The post-crisis rally in U.S. equities has run far and long, and we should expect lower returns for the next several years. In addition, it is difficult to imagine that bond yields will continue to decline during this period.
–> We choose bonds as “crash correction” not because of their current absolute pricing or performance, but we expect them to be the safe heaven of choice in any major market turmoil – independent on how they are priced immediately before. In this sense, we do not bet on pricing before or after a rate hike.
QUESTION: Which strategies might be expected to perform best in this type of expected market conditions?
–> We have noticed this year that the bull market has flattened out in 2015, and major markets are going sideways – while stress signals come from commodities and some overseas equity markets. Hard to predict where this will go, therefore we just do not try to predict, but remain invested in a broad portfolio of strategies.
I list below the strategies that I prefer given the thesis above, but am very interested to hear the opinions of others.
MYRS: In a sideways or slowly grinding market, the VIX futures should remain in a state of contango and we can still capitalize on the monthly roll yield.
–> Yes, but you can see the contango to go down since 2011, e.g. performance boost from inverted volatility being reduced recently.
Top 4 World: If the U.S. Stock market under-performs over the next few years, perhaps it will pass the baton to some other country or countries.
Global Market Rotation: Similar argument as Top 4 World strategy.
Global Sector Rotation: In any sideways market, one can usually find individual sectors that out-perform.
–> On the three above: Yes, our effort is to make different investment options available that should work in any market environment. Choosing a broad portfolio of strategies using our Portfolio Builder should provide the best setup for stable results with reduced volatility.
As you raised some rather broad and deep questions, I would be very interestes to see comments from other followers also. If needed let’s open a different forum topic on this.
All the best,
AlexKeymasterHi Tapan,
sorry for the delay in my response. We decided not to include the World Top 4 Strategy in the beta signal consolidation sheet, as it would add another 40 ETF to the already long list, and make the sheet bearly workable. We´re still working on a better consolidating mechanism and will come back soon.
KeymasterSupal,
the World Top 4 Strategy is now included in both online and offline Portfolio Builder, see here
We decided not to include it in the beta signal consolidation sheet, as it would add another 40 ETF to the already long list. We´re still working on a better consolidating mechanism.
KeymasterHarvey,
we generally do not recommend using our strategies with options, and therefore do not provide details guidance for it. Main reason is the additional complexity in running backtests with option chains, which would be needed to verify the results.
KeymasterThierry,
the same as the other strategies we changed the underlying algorithm to the “adaptive allocation” in Oct 2014, e.g. the strategies will always allocate to two global sectors AND bonds (TLT) by optimizing the modified sharpe ratio. For details on the algorithm, please refer to the following article: Adaptive Allocation.
Sorry if this was not sufficiently made clear so far.
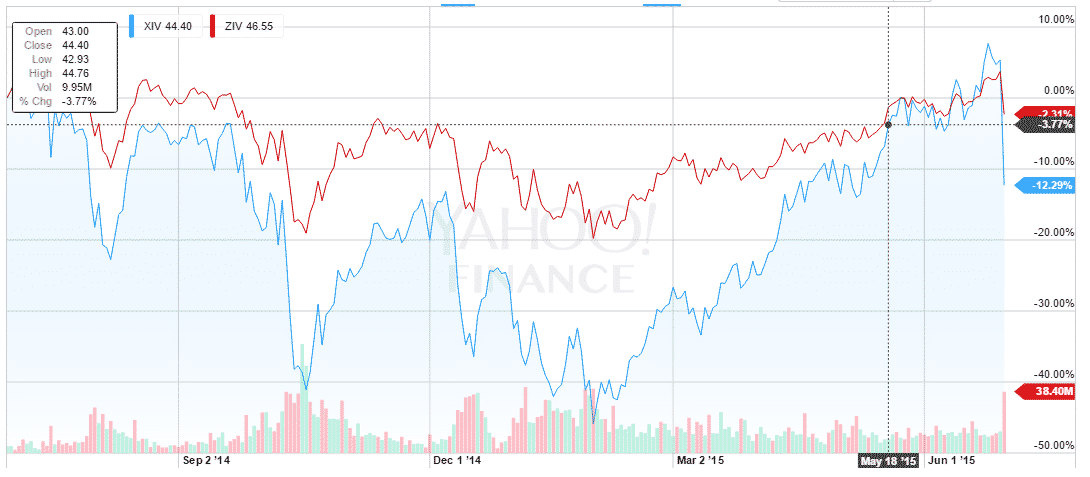
KeymasterDeshan, compared to ZIV, the 4-7m inverted volatility, XIV, first month inverted volatility is drastically more volatile with some rather erratic price movements within a month timeframe, see below. This makes it little useful for “lazy” monthly or bi-monthly rotation strategies like we normally use. There are other blogs offering highly aggressive Volatility strategies on weekly or even daily mode, have a look at our blogroll.. Also keep in mind that we’re using inverse volatility more for harvesting the “frear premium” from the contango, than for the VIX price swings, and this effect is much stronger on the right half of the VIX term curve, e.g. ZIV.
 Keymaster
Gselsidi, thanks for the proposals, appreciated!
We are doing some work on a commodity strategy, specifically precious metals as you mention. However so far our analysis shows this would rather be used to complement an existing portfolio with a smaller percentage, than being a main driver of growth. Reason is that the equity lines from our tests do not show a reliable smooth growth path, but rather “years of opportunity” which then fade again, thus making it more feasible as an opportunistic mix rather than a constant adder. This is also the reason we have not published anything in this respect so far. Another issue is that some commodity markets suffer from roll-effects created by the underlying future markets, for example the oil market since prices went south last year, so it’s harder for our momentum algos to detect the underlying long lasting trends.
On your proposal to use a short SP500 instead of bonds, this is a bit tricky to implement. Recall that our “crash protection method” relies fundamentally on the “save havens” which receive the money flow in crisis time. A strategy where you go long SPY when risky assets show a positive tendency and shift into short SPY when things go down might make sense as a rotation concept (inverting momentum), but does not offer any crash protection as itself. Another argument against shorting risky assets is that long term markets go up, thus by betting on falling prices you always loose – longer term.
I really appreciate your ideas and not arguing against them – just trying to show some of the results from similar tests so far. Hopefully we can discuss further and come over these hurdles jointly in our discussion.
KeymasterSip, existen indices synteticos que teoricamente nos permiten hacer los backtests desde el 2004, aqui una fuente y blog muy interesante: http://investing.kuchita.com/
Pero la verdad – y ya expresado anteriormente – los sistemas basados en volatilidad empiezan a funcionar solamente despues de la crisis del 2008/09 cuando se lanzaron mas ETF derivados, y entramos en una etapa de “backwardation” que aun dura pero de menos efecto, vease aqui: http://vixcentral.com/#fragment-c. Asi que estrategias basados en ZIV son realmente oportunistas; y en algun momento pueden dejar de funcionar – nosotros lo monitoreamos obviamente.
Hemos hecho el backtest desde el 2004, pero no pensamos publicarlo para no confundir la audiencia.. Posiblemente a futuro valdra la pena hacer un articulo..
KeymasterHola de nuevo Ana,
hemos publicado bastantes articulos y comentarios sobre el ratio sharpe modificado, y como compara con diferentes indices. El articulo mas extensivo es el que introduce la UIS. Ademas en mi articulos introduciendo la “Hell on fire” encuentras unos links a otros blogs/grupos que han replicado la formula y la comparan con otras estrategies.
Dejame saber si al leer estos te quedan dudas especificas, con gusto puedo hacerte una comparacion con un indice o estrategia individual. Si te gusta modelar los dastos tu misma, en el Excel Portfolio Builder encuentras todas las series de tiempo de todas las estrategias en un formato muy conveniente. :-)
KeymasterHola Ana,
por el momento no tenemos sistemas basados en ETF Europeos. La razon principal es la liquidez del mercado americano, lo cual se refleja en spreads y costos mucho menores comparado con la EU. Ademas los costos de transaccion con brokers americanos es menor a 1 USD para 100 acciones, mientras que la misma transaccion te puede costar arriba de 30 EUR en Europa. Asi que aunque Vangelis, Frank e yo somos basados en EUR (SFR), manejamos nuestros sistemas basados en USD y en las bolsas americanos. Utilizamos a veces hedges por opciones o futuros para manejar el riesgo, pero no siempre.
Hemos pensado implementar nuestris sistemas basados en ETF europeos, pero anticipando: Los resultados en EUR son menores que en USD. El dolar, o tipo de cambio dolar / euro en si es un activo que cambia los resultados.
KeymasterHi Tapan, thanks for the hint! Found and corrected it. Can´t protect the sheet enough, there is always someone who finds a new way to overwrite a cell unwillingly :-) Sorry for that!
KeymasterHola Vicente,
si puedes utilizar CFDs, pero es importante considerar los spreads, costos de transacción y limitaciones en la liquidez antes de hacerlo. Depende mucho de la bolsa y el broker que utilizas, pero generalmente los CFDs tienden a ser más costosos en la operación, sin embargo requieres menos capital. Por lo mismo es difícil hacer un comparativo en concreto, así que tengo que dejar esta tarea a ti..
Me han contactado otros interesados habla-español, así que ojala y podemos fortalecer este foro para tener un intercambio más frecuente.. Por favor denme sus comentarios si faltan herramientas u otro apoyo por mi lado..
KeymasterPatrick,
this will take some more weeks, we´re releasing another strategy in between.
Also I´m still struggling to get reliable historical borrowing costs and availability data.
KeymasterStephen, I cannot change your perception, only continue to give you all the facts and elements so you change it by your own. This is why we publish all backtest and live performance data with a lot of transparency and hopefully clarity. Happy to chat live over Skype on any remaining doubt, can reach me under AlexanderHorn672
All the best,
AlexKeymasterRichard, just fixed the vola formulae which were not compatible with Excel 2007, pls try again. For fixing the ‘refresh quotes’ I’m a bit handicapped as I have no Excel 2007, pls send me some screenshots where the macro stopped (‘debug’ when error appears), or let me see your sceen live over skype (AlexanderHorn672), then I can update the VBA.
You can include pics posted on dropnote or other services using the ‘link’ functionality, or just send me to [email protected] and I post them.
Thanks for your patience, the different Excel versions are a bit hard to bring together..
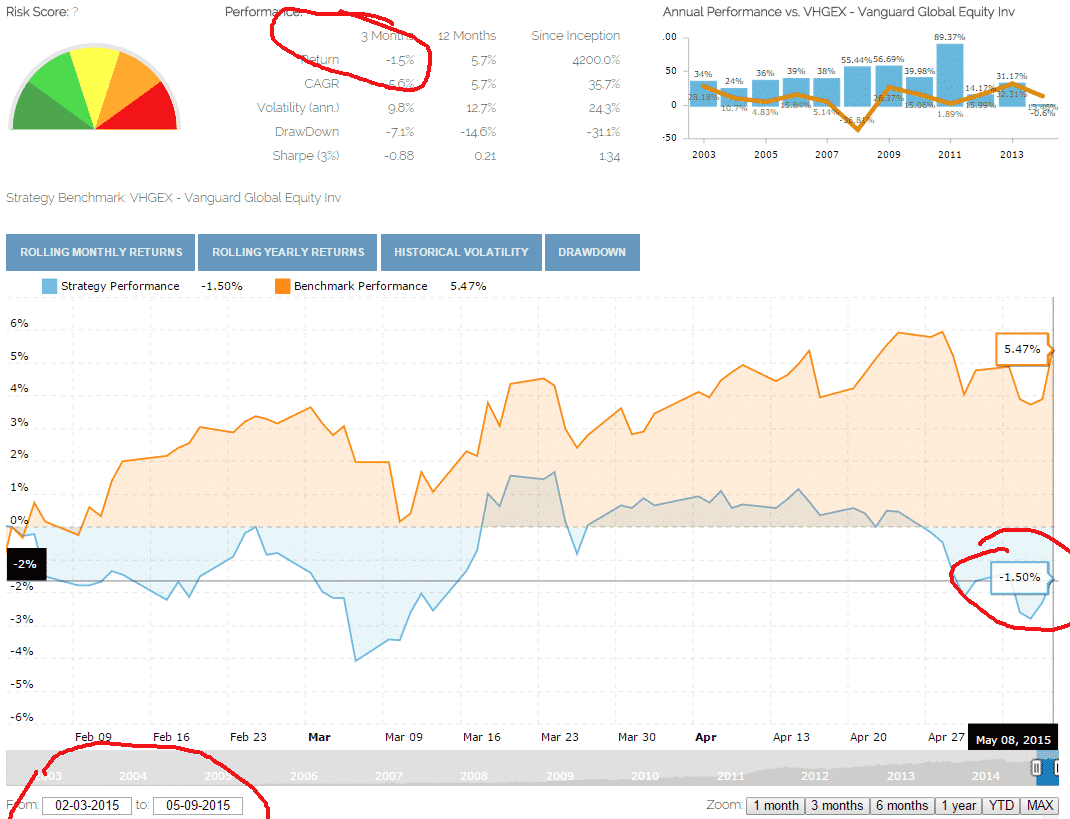
KeymasterStephen, the tweet you mention was a static snapshot I took on 3/19, covering the 3months before also for the other strategies. My idea was to update the tweets every month, but that was a bit to ambitious with our current backlog of things to publish. Will update them to show performance since inception, this requires less maintanance, and avoids the perception we’re publishing wrong or cherry-picking the numbers.
On your other observation, the statistics in the performance table uses a 66 days (22 trading days/m * 3) window which is a common simplification, while the chart by default uses true 3 calendar months, this explains the difference. This is a technical imperfection we’ve not been able to eliminate yet, but below two screenshot to show you the reconciliation as of today.
Finally, sorry for not responding your previous message, had some notebook free ‘Cinco de Mayo’ days at the beach, promise improvement going forward.. normally we proud ourself for a quick turnover in responses even if one partner is out, but failed you here..
Selecting ‘3months’ window in chart, e.g. 02/08 – 05/09 –> 0.28%:

‘3months’ = 66 trading days in performance statistics, e.g. 02/03 – 05/09 –> -1.5%:
 Keymaster
Hi Richard, great, pls give me feedback if you encounter any bug or other difficulty, still trouble shooting this..
Here the link: https://logical-invest.com/wp-content/csvrepository/Portfoliobuilderexcel.xlsm
KeymasterThanks for the feedback, glad you like it.
Yes, please send me your downloaded file + screenshots of the errors to [email protected]. As commented before, this is a bit of a debugging game due to different Excel versions and language settings – will take a while and need input from the US to China to Russia and a bit of Brazil if possible :-). Also pls try to open your solver manually, so to make sure it is properly installed. Should be on the Excel ‘data’ tab, or install in Excel settings.
The (hopefully slight) difference in the results comes from the different granularity of the online version. The more I would like to run it on daily data like in our backtester and the Excel version, it’s just to slow – so I’ll leave it with weekly data. The tests I’ve done show really marginal differences at the CAGR level, pls let me know if you see something different. At the MaxDD level they are higher, see here for more explanation: https://logical-invest.com/forums/topic/monthly-drawdown/
KeymasterHi Ilya,
same as most (all?) other sites, we do not include the tax effects into our backtests, so returns are gross tax. Main reason being that the individual tax rate varies very much depending on your location and account used. As example, just for an US investor the tax exposure between a savings account, and a deferred account like 401k, IRA or special purpose vehicle can cary from 0 to 30%, and this is not considering any tax-loss-harvesting.. For non-US investors it further depends on double tax treaties, home country regulation and whether you can claim witholding taxes from the ISR… So this is something each investor has to calculate by themselves, or with the help of a tax consultant..
Another point I’m missing in the comments above, is what scenarios you are comparing. Example: If you decide to invest in bonds, you are subject to capital gain and dividend taxes, automatically. In this scenario, you’re still better off using our bond rotation strategy compared to a buy&hold approach, simply because returns gross and after tax are better. The tax excempt US muni bonds might aleviate some of the tax burden, but this is again somehthing which only applies to a section of our followers.
If you are an international investor then indeed the dividend withholding tax might scare you away… same for buy&hold or our suggested approach..
Hope this clarifies, happy to continue the discussion
KeymasterWe’ll dive more into borrowing costs in Part II, when we look at shorting the -3x ETF. For the time being, also have a look at the cost at IB: http://bit.ly/1C9BjRc
Guess you have seen the discussion at seekingalpha, also there quite some comments on that topic: http://seekingalpha.com/article/3050016-hell-on-fire-the-3x-leveraged-universal-investment-strategy-part-i#comment-50996466
KeymasterSimon, same thing for Frank, Vangelis and myself, and we’re looking into this also for our own account, and certainly there are other interested non-US investors. Selling off a day before exDiv might be an option, but the leg risk might eat your benefit away. Keep in mind that normally the allocation only changes gradually.. Might be worth a look in detail with a backtest, which we’ve not done.
We’re currently exploring futures, or ETF futures, but their price / signal behaviour is very different to the ETF because of rolls and other effects. So, we also have no clear answer to this… but keep exploring ourselves.
KeymasterStephen, I also noticed the relative difference and went into detail when setting this up. The reason is the following.Definition of Sortino Ratio
As the portfolio builder is based on weekly data, for the downside volatility (StDev) we’re only considering the weeks where the performance was negative (r<0). In the MYRS, indeed only 147 out of 377 weeks under observation had a negative return, and the annualized standard deviation of these returns was (only) 9.62%.
Which means Sortino Ratio = CAGR / (Downside Volatility) = 54.65% / 9.62% = 5.68 (as of week March 30, 2015).
Interesting enough that the absolute value of the Sortino Ratio therefore can change drastically depending on the granularity of the analysis, e.g. monthly, weekly, or daily. This is one of the main reason why the Sortino Ratio should only be used for a relative analysis of assets or portfolios.
I left the calculation sheet for the downside volatility open in this sheet, have a look by yourself.
Happy to discuss in detail
KeymasterThanks for testing and giving feedback!
The Solver message is a custom VBA I put in for testing compatibility of different Excel and Solver versions. So if there is a problem, or Solver is not installed, users get an error message, that’s the main purpose. Will take the ‘positve’ confirmation out in one of the next updates. Feel free to take the msgbox() line our in VBA for the time being, there is no protection in.
On the #Name error, would you mail me your workbook once quotes are updated? Most probably a date format or other region setting error. I’m working on a German Excel install with US region settings, but sometimes this just does not work as it should… (beside being a great excuse for my frequent typos..)
KeymasterMatt, do your mean like this? Slicing and dicing on the timescale and then getting CAGR,Volatility, Sharpe, etc for the selected timeframe?

Stay tuned for the infamous ‘Gold Version’… :-)
KeymasterGreg, yes, based on several suggestions the equity lines in the Portfolio Builder show the ‘adaptive allocations’ in GMRS, MYRS and BRS.
In contrast, on the charts of the individual strategy pages we highlight when these new algorithms were introduced, and show the allocations a long time follower would have been invested in, so kind of ‘fixed’ history.
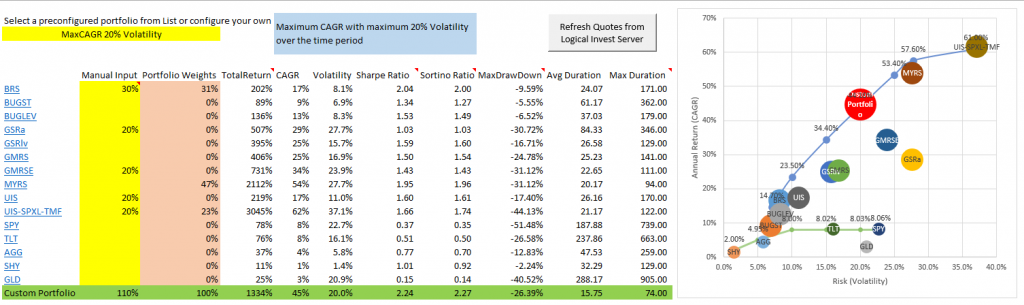
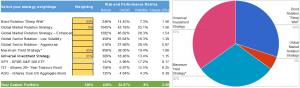
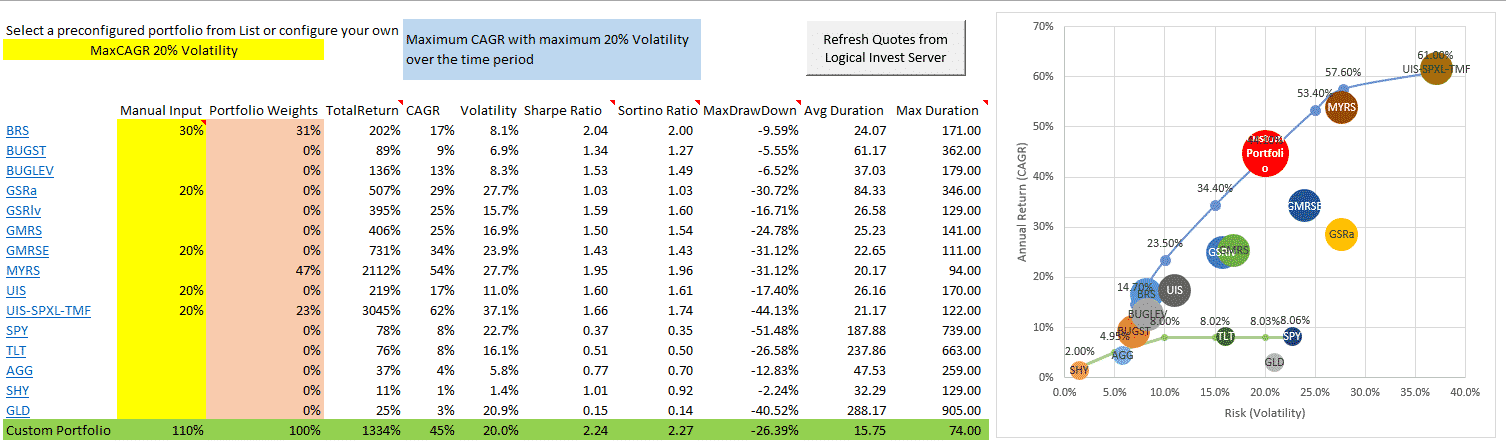
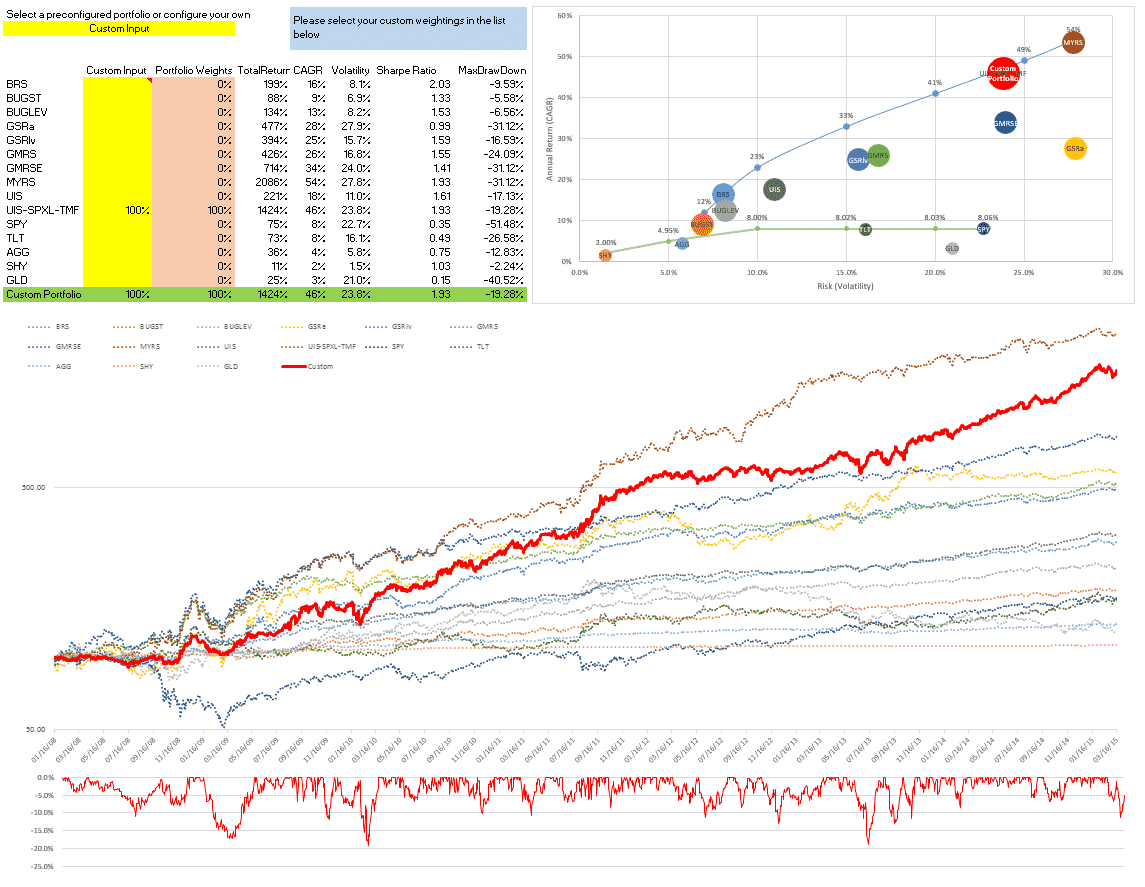
KeymasterQuick update today:
– Now including 3x UIS (SPXL/TMF) with synthetic 3x leveraged ETF backtest from 2002
– Updated efficient frontier accordingly to show the quite amazing new possibilities with only blending in 10-20% of this strategy.
– Also online builder will be updated.Full post in progress with target this weekend.
Link same as above, and here a screenshot:
 Keymaster
Yes, you are correct. This periodic rebalancing – to keep stable fixed weights – means you add to the lagers taking from the top-performers. I have no particular article about this in mind, but generally there is a lot on rebalancing portfolios on the web – one of the items MPT academics most love.
On MYRS maybe I did not properly explain myself. In Jan – Feb this year the enormous jumps in volatility (ZIV) and fixed income (EDV) would have caused a big divergence between rebalancing the strategy itself monthly, bi-monthly, weekly or even daily. We use bi-weekly just because of these volatility jumps, e.g. to be more reactive compared to the other monthly strategies. Now, with this periodic rebalancing at the strategy level being in place already, the effect of changing the rebalancing period at the portfolio becomes less significant.
Now, what about reverting this – adding to the leaders, taking from the lagers, e.g. a ‘trend-following approach? This is exactly what we’re about to finish and publish – our (long-teased) Meta-Strategies. Main argument for ourselves is that strategies might outperform or contrary stop working in different market environments – and you nicely see this even in the 2008-2015 period in the charts. So we dynamically allocate more to the leaders, and even might not allocate anything to a (relatively) underperforming strategy. You can see some preliminary ideas in the post above.
KeymasterMatt, thanks for the hint, back working again. Overwrote a field in an update yesterday night.
KeymasterVery good question, and actually not as trivial as your might think – one of the major considerations I had when launching this version based on weekly data – compared to the previously monthly.
The equity curves of the underlying strategies are based on monthly (bi-monthly for MYRS) rebalancing. When blending them together, I’m currently taking the easiest path – which is weekly rebalancing. In practical terms, the difference in results between weekly and monthly is neglectable – as the underlying strategies are rebalanced monthly and there the lower correlation between the different ETF would indeed cause larger differences (as we have seen in the MYRS recently, for example)
Using only yearly rebalancing, or even without any rebalancing would indeed lead to completely different and unrealistic results.
In future we’ll show you the ‘consolidated signals’ also at each month end – when the underlying strategies rebalance – but you will also see the daily changes in shares thereafter, in case you want to rebalance the overall portfolio more frequently, or trade later than the rebalancing date.
Hope this explains, happy to extend more.
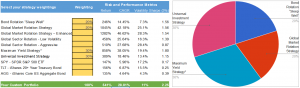
KeymasterAfter getting the online version and the signal consolidation working had some time to work on the Excel:
Last Version:
Offline Excel Portfolio Builder V0.2 (overwrite, same link as above)Updates:
– Incorporated the feedback received from Daniel M., thanks for that!
– Included 3x UIS into optimized portfolios, we’ll publish post and signals shortly
– ‘Efficient Frontier’ recalculated including 3x UIS and Friday data.
– Added MaxCAGR with <20% and <25% volatility
- Some smaller debugging on VBABased on Daniels' feedback, it seems that the MAC Solver does not like the VBA. So reaching out if there are other Apple geeks who might be interested in recoding a bit to make it run on Mac also. Either post here, or drop me a line.
Any feedback or interest to 'co-develop' is appreciated, just let me know.
KeymasterHi Jorr, thanks for your suggestion!
A MaxCaGR would just go 100% into Max Yield, so you can use that equity curve and leverage it by your needs.
Have just included the MaxCAGR with 20% and 25% volatility constraint in the online version, seems you can stomach this – because the Drawdown is corresponding. Also, I’ve now included the UIS 3x leveraged version in the optimized solutions, we’re close to get this published. With this I also updated the ‘efficient frontier’ dots, you can nicely see the effect of including the 3x UIS.
For more advanced portfolio optimizations, please have a look at the ‘offline’ Excel version, there your can specify which strategy or market proxy to include, specify min/max weightings by strategy, put targets to minimize/maximize and put constraints in, and do a lot of other ‘magic’ with the Excel solver. This is still a first version, which runs fine on my computer, but might behave different depending on Excel and OS version, but anyhow, if you are a geek, this is what you need. Have a look at the forum thread, would be great to get your input to further develop this tool with you and other interested.
KeymasterThanks for the comment, actually just yesterday received a similar one, so let me expand.
Due to the late inception of the 3x leveraged ETF (TMF in April 2009), I extended the timeseries using standard UIS back to Jan 2008 to match the other strategies. We do the same for MYRS, but had properly explained, which I missed to do so far in the case of 3x UIS – now included. So the maxDD in 2008 of 16.95% is indeed from UIS, and applies also to 3x UIS due to the extension. I will extend by using synthetic TMF and SPXL data instead, this indeed is confusing.
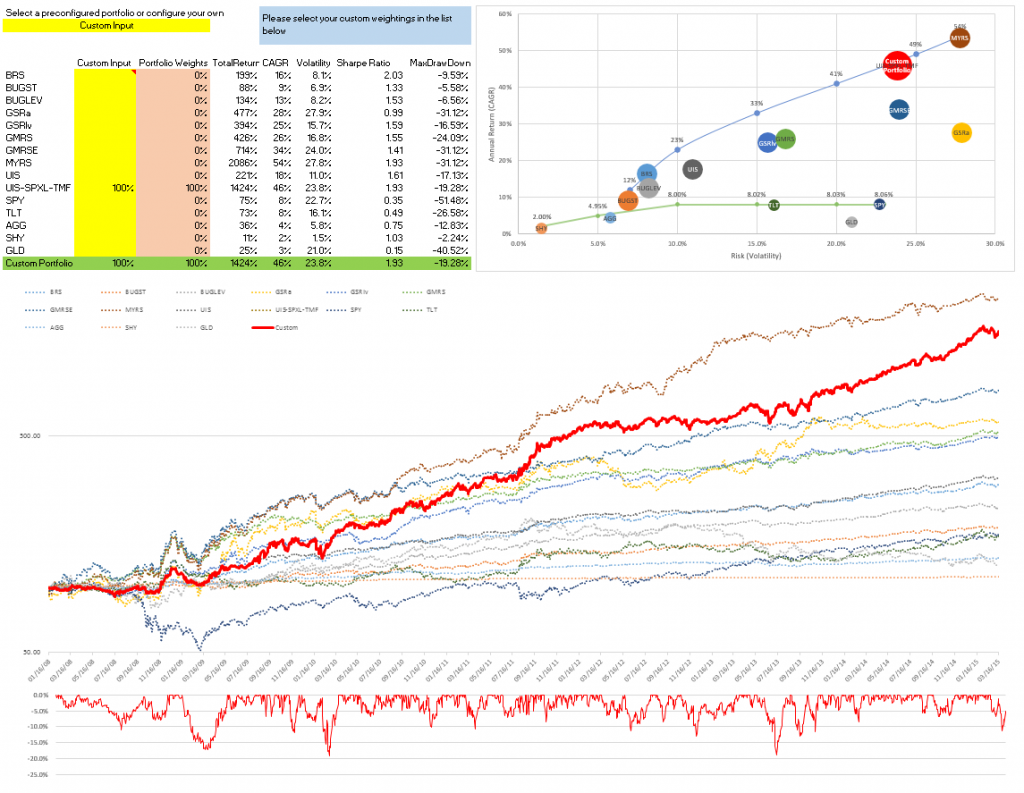
Generally, the UIS SPXL-TMF version is interesting also from a different angle. Using the SPY-TLT signals and then executing with SPXL-TMF leads to inferior performance compared to running the signals directly for SPXL-TMF. This comes from the roll-loss of the leveraged ETF, where the daily leverage leads to tracking errors compared with the underlying ETF.
This – and the interest shown by you in the forum – led us to include the signals as a separate ‘version’, which we will make available shortly as part of the UIS subscription.
Also due to the roll-loss of the leveraged versions, I’m just exploring the best way to extend them back to at least 2002. I’m currently inclined to use a sum of squared differences approach, which you can see in the two excel files for SPXL and TMF. Happy to receive feedback on this approach.
KeymasterHi William, thanks, great you like it. Should work fine in Excel 2003, but once you open you need to confirm you want to enable the edit mode and allow makros (Standard Excel Messages). In some versions you need to adapt your ‘security setting’ to allow makros.
Here some links:
All versions: http://www.exceltrick.com/how_to/enable-macros-in-excel/
From our friends at MS: https://support.office.com/en-gb/article/Enable-or-disable-macros-in-Office-documents-7b4fdd2e-174f-47e2-9611-9efe4f860b12If this does not work, then I can share a downgraded version, but will not support some advanced features, so let’s try this first.
KeymasterSam, yes this is what I meant. This strategy for my taste should only be let’s say a 5%-10% (x3 leverage = 15%/30%) of portfolio. Just my personal 2 cents..
Don’t forget that the backtest is only from Jul 2009 due to availability of ETF, not sure if I would have stuck to this strategy during 2008/09 crisis with a 3x leverage at a higher exposure. Agree that the rebalancing benefit is an argument for going short (if available at reasonable costs).
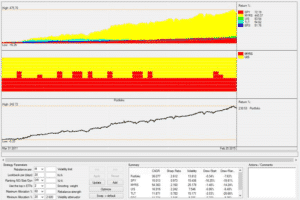
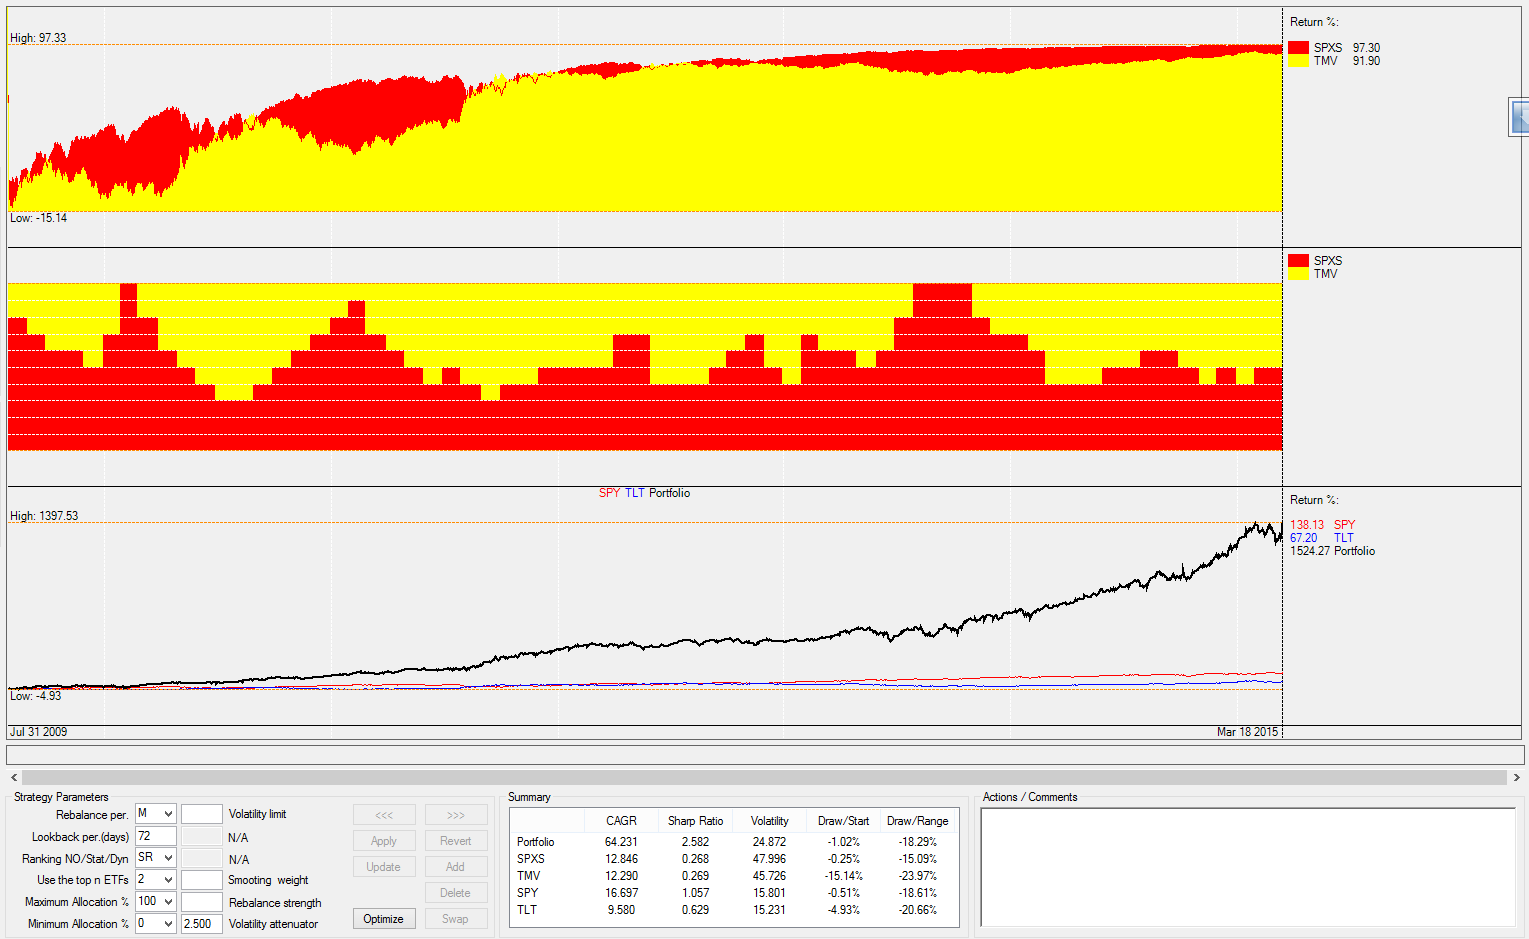
KeymasterHi Tim, here a screenshot of the SPXS / TMV version, hope this helps. Very aggressive strategy, I would only use this as an additional ‘fun factor’ with a small share of my overall portfolio.
(click to enlarge)
 Keymaster
Michael, thanks for the f/up on the UIS SPXL/TMF version.
Due to the demand, we’ll launch this as addition to the plain ETF UIS, and I’ve built it into the next Portfolio Builder version we’re about to launch. Attached a screenshot of the UIS SPXL/TMF backtest, which also gives you a preview of the next portfolio builder.
Btw, I’m planning to send the draft portfolio builder in Excel to some interested beta-testers this weekend before launching on the site, if somebody is interested to jointly check, debug and improve pls drop me a line either here or through the Contact form.
 Keymaster
Michael, sorry for making you wait with the meta-strategies. The concept is finished and we’re just working on finetuning the initial strategies we’ll publish and the presentation on the web-page. Should take another 2-3 weeks, hopefully..
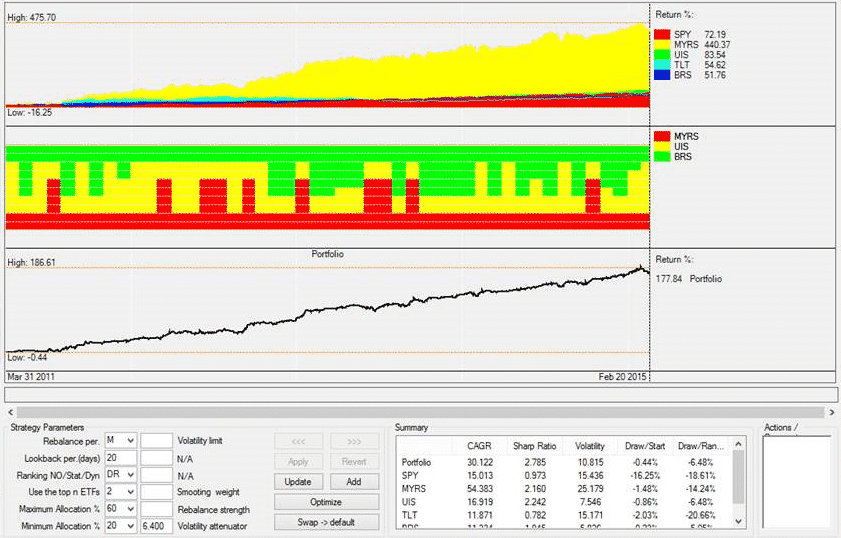
But in order to give you a preview, here (drum rolls please..) are some examples of what is possible with this concept. By no way the final versions, and need obviously longer backtest..
Look at the middle chart, which shows the dynamic allocations, and then the especially how nicely the sharpe ratio goes up. Click on images to expand.
Maximum Yield + Universal Investment + Bond Rotation:

Maximum Yield + Universal Investment:
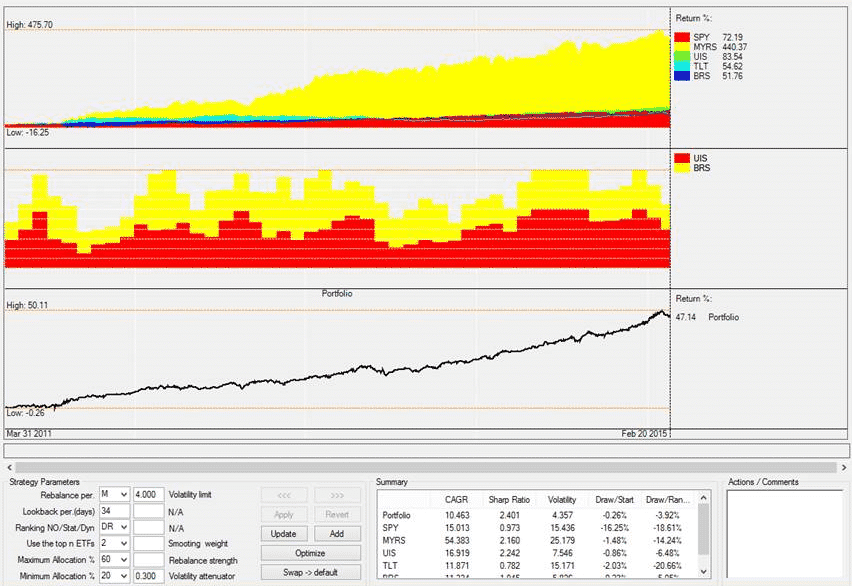
Universal Investment + Bond Rotation with a 4% (ultraconservative!!) volatility limit. See how the total exposure varies over time:
So, please give us some more time to finish up properly, but also let’s start the discussion of what you’d like to see in regard of blends and features.
KeymasterMatthew, see the ‘small print’ below the portfolio builder chart.. Before inception of MYRS in Jan 2011, we use GMRS data to extend the timeseries till Jan 2008. This is needed, as we want to show at least 7 years of simulation and include the 2008/09 financial crisis.
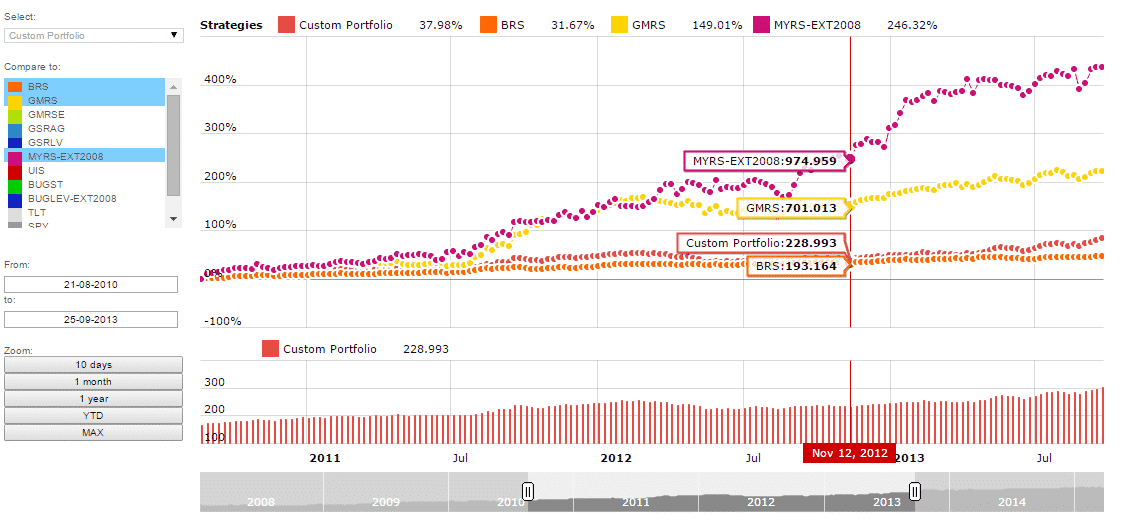
KeymasterRay,
thanks for the great question, there are two explations. First the portfolio builder uses a base of 100 (to be able to show a log scale), while the strategy pages use base 0. See for example the Bond Rotation Strategy, showing 248 versus 148. Second, the portfolio builder uses a common start date of Jan 2008 due to different inception dates of the strategies. This is why for example the GMR shows only part of the overall history, thus less total return.
KeymasterMike, yes, all ‘adaptive’ strategies use what is commonly called ‘walk-forward-testing’, i.e. the lookback period and the ‘f-factor’ change over time. We use generally a 1 yr timeframe for the walk-forward-testing, e.g. each year the strategy finds the optimized values with the highest performance over the last 12 months, and uses them going into the next year. This ensures that for example the lookback period gets shorter in times of relatively high volatility, and longer when markets are calm.
Additionally, the walk-forward-testing is recognized as one of the most effective ways to minimize the ‘curve-fitting’ problem many backtests have, as you slice the strategy backtest into yearly buckets which are tested independently from each other.
Look at my comment from yesterday on our new adaptive Bond Rotation Strategy, there you see further details and a ‘parameter heatmap’ which shows you the areas of parameter stability: https://logical-invest.com/new-enhanced-bond-rotation-strategy-adaptive-bond-allocation/
KeymasterHi Richard, first post, thanks!
I’ve also tried to find a reliable data source for CUSIP because as you said it should be the easiest to map the ETF. However, at the end only paid S&P data might do this.If you have found another source please post for the benefit of other readers.
What I use to map US/EU ETF is the following list from XETRA FRA, it contains all important ticker, index and other data, best I’ve found so far. The ‘Xetra’-Symbol + exchange (ex .DE) gives you the historical quotes in Yahoo finance. Not sure if you’re invested in UK or DE, anyhow hope it helps.
Update: Here complete list of US ETF with CUSIP and ISIN
KeymasterRon, today had a discussion by email on the same topic and the ‘why’ of the recent dip in TLT/EDV/Bonds, maybe of help in addition to Frank’s reply.
Generally the market analysts seem to agree that the expected FED interest hikes are already properly priced into the Bond and Tsy instruments, at least to the ‘how much’ extend. Looking into the yield curves this seems understandable to me. What is happening right now is that the expectations of the ‘when’ these hikes are coming is moving the whole yield curve forward, last in early Feb with the FED statements. By my own logic – and assuming the ‘how much’ is priced in, this should then rather be a one-time movement, thus not affecting the further development this year. This might change by any next FED announcement, we’re really driven by the central banks right now, recall May 2013.
For yield curves see for example here: http://bondtutor.com/currentYC/currentYC.htm
KeymasterMike, this is a technical glitch in the Yahoo data, not real market data (compare in Bloomberg for example). We have algorithms in place to filter this kind of errors, so they do not hit our strategies. But we obviously cannot correct Yahoo data in the charts we also show here
KeymasterMichael, if there is a general interest in a leveraged or short ETF version of the UIS we could certainly built this, publish the backtest and include signals in the strategy posts also. I’m a bit hesitant to include further options in the portfolio builder though. It’s already quite crowded with the strategies that have the most followers, so adding further alternatives might create confusion in my eyes.
In addition to the long promised and finally kicked-off next version of the online tool, I’d rather propose to make an excel tool available for the advanced users, so you can also do your own optimizations and tracking. We could include more timeseries like the requested there, build in some solver optimizations for example, and share somewhere for open collaboration. For some stuff excel is just more flexible, also like the things I still owe Daniel from the post above.
Deal? Also happy to be convinced otherwise..
KeymasterMichael,
re your question on the timeseries in the portfolio builder, sorry for the late response. The data used is based on the former strategies, and only since late last year the new adaptive strategy signals have dropped in. However, as the portfolio builder is rather a ‘forward-looking’ instrument, I agree that we should use the backtested data from the adaptive strategies.
For consistency to our long-term followers we’ve so far stuck to our principle to ‘fix the past’, e.g. not change any signal or performance data even if the strategy had evolved. With the new portfolio builder (just approved final specs and design and kicked-off built yesterday, Yuppie!!) we will use the adaptive strategy signals. Finally, you will see the difference not to be significant, we’ve done some test already.
KeymasterYes, this is neither intuitive nor easy to calculate across different strategies. We thought about making an excel sheet available, but now rather opted to kick-off what we call our “gold version”, where the site will allow you to choose weightings by strategy and options like the EDV/TLT replacement and then do the math for you.. Will take some weeks, but hope this helps medium term…. OMG, another teaser we’ll have to deliver on :-)
But for the time being, here an example in excel. Look at the formulas on how to “rescale” the capital requirement. Keep in mind that we consider EDV like a ‘leveraged’ TLT, so you either need more capital, or rescale the overall position to maintain the “mix”. This ‘leveraged’ is technically not quite right, but it demonstrates the effect you’ll have when replacing EDV by TLT due to ther different duration and coupon.
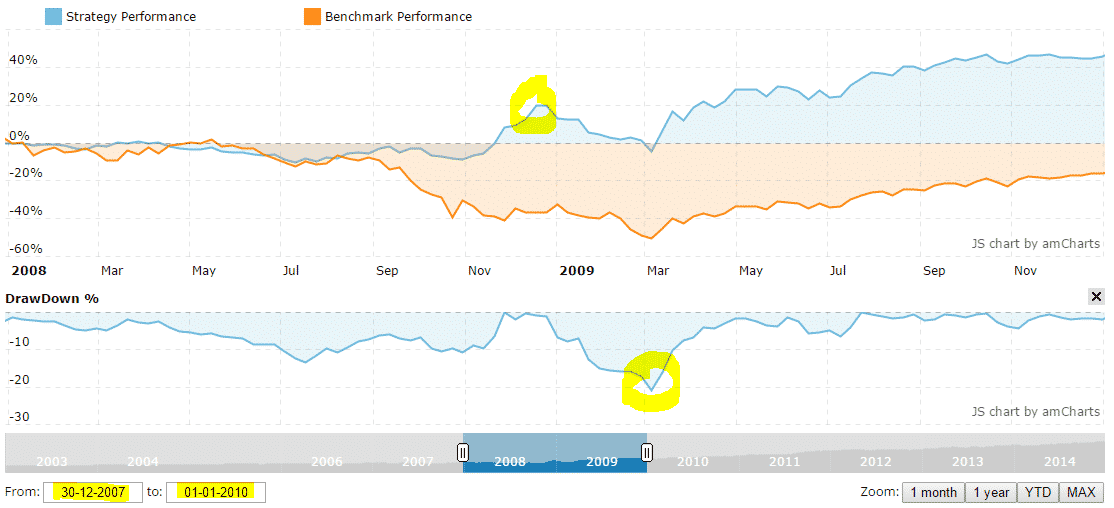
KeymasterThe 6.4% MaxDD (and further indicators) on the homepage refer to the last 5 years timeframe as originally published. We’ve since then extended the period to full 2003-2014, but not yet updated the homepage statistics. You can see below that the 20.9% DrawDown in 2009 followed a peak of the same magnitude, overall the UIS proved superior to the benchmark in the crisis years.
 Keymaster
We have backtested this strategy using mutual funds as proxies, and are currently preparing a post to be published within the next days. Will keep you posted on any update.
KeymasterHave just added the monthly drawdown chart above, please let me know if this addresses your needs. We can built portfolio examples with a target Calmar (CAR/MaxDD) or Sortino ratio, let me know some examples you would like to see here in the forum. Again, here these are ‘optimizations’ over the whole time period, in our background system we can build more sophisticated models like the ‘meta strategy’ we’ve been teasing now for several weeks, but still owe you :-)
KeymasterAloha, and thanks for the feedback.
We have one strategy on the burner that does exactly that. Using minimum (alt. mean) variance optimization combined with volatility targeting. E.g. weightings are first computed by a solver algorithm to find minimum (or target) volatility at the portfolio level, and exposure is reduced if expected volatility is above the target volatility (or scaled up in low volatility environments).
This is inspired by the Adaptive Asset Allocation paper by Butler, Philbrick and Gordillo whom we are big fans of – another must read! We’ve been trading this already sucessfully, but need some more time to bring it into an easy-to-digest format.
Yes, drawdown is definitely the next to add. As this tool is running on monthly data, this would be monthly MaxDrawDown only, which for all strategies but the MYRS also would match realized drawdown. Wanted to wait for the integrated version of the tool, but can plug it in.
KeymasterSunil, thanks for the feedback, appreciated. Agree on the correlation functionality, give me some days to include a correlation matrix between strategies and the “custom portfolio”, this was suggested before.
The emphasis in the “Global Sector Rotation Strategy” lies in “Global”, as the Universe of Sector ETF is quite huge we limited to global indices where suitable. This is why we choose RWX over IYR. We have one strategy on the burner which employs both US and Global REIT, this might be of interest to you.KeymasterMichael, thanks for your interest. The ‘meta-strategy’ is part of a major overhaul on the site we’re currently planning, we’re targeting Q1 2015. Will post some examples before to get feedback and develop it to your needs.
KeymasterHi Patrick, indeed for our analysis we also use the Sortino Ratio beside the Sharpe Ratio. It depends a bit on the strategy you are evaluating, especially on what risk/return profile you are focusing. For strategies with higher volatility the Sortino Ratio gives a better view, while we prefer Sharpe for lower volatility strategies. Sharpe is the broader known, this is why we use it for publication, but are open for feedback.
The volatiltiy shown here is the annualized monthly volatility, e.g. in Excel StDev(A1:A100) * Sqrt(12). This prototype needs to be light-weight, therefore we did not put daily equity data in. But the result is about the same. This is also the reason we currently do not include MaxDrawDown, as with monthly data it does not reflect the real “fear factor”. The next version will be on daily data level, and with more options to be selected.
KeymasterPatrick, thanks, this is great! Let me add the visual representation of these, and we shall call them in future:
“Patrick A”:
“Patrick B”:
“Patrick C”:
Btw, as you might notice what you have done is a portfolio of strategies, or a “Strategy of Strategies”, e.g. treating each underlying strategies’ equity curve as an asset (class) for a next layer of strategies. Currently this is limited to applying fixed weightings, but imagine to create a rotational “Strategy of Strategies” where you invest in the Top 1-3 best performing strategies, or a volatility weighted strategy portfolio where each strategy is assigned or limited to the same “bucket” of volatility, or even a mean-variance or minimum-variance optimization of strategies?This is what we mean with the “meta-strategy” approach we’re currently building up. Concept is up and running, first tests look very promising, but we’ll take some more time to fine-tune both the concept and the publication to present you with a well-rounded paper. Anyhow, just drop us a line to share your ideas, needs and ideas around this.
[Note these portfolios are not updated to full 2014 data]
KeymasterWe received an interesting question by email, we post here to the benefit of the broader audience.
“In several of your blog posts, you advise shorting TMV as a hedge and leaving it in the account. This means we would never realize any gain from it, although we need to pay the cost of borrowing the money monthly. Do you ever sell any of the hedge if the price goes down, to cover the cost of borrowing, and then buy it again when it goes lower?”
Contrary to a long position a short position will lose value over time. So, if you open a TMV short position of 10’000$ and Treasuries go up, then TMV will lose value. After some time your short position will for example only have a value of 9’000$. Now because you want to keep a 10’000$ hedge, you will have to sell more TMV for 1000$.
In fact you are doing exactly the same as someone who has the +3x leveraged TMF to hedge. His TMF position would have gone up from 10’000$ to 11’000$. To keep it at 10’000$ also he would have to sell ETFs for 10’000$.
So the effect of rebalancing is exactly the same for long and short ETFs.KeymasterBennfine, thanks for pointing this out. Have updated the “Sample Signal” and also the typo in the investment table in Dec 2013.
KeymasterIn Dec 2013 we introduced an equal volatility mechanism, so when one of the ETF was above a certain volatility threshold its position was scaled down and the strategy partially in cash. This has now evolved into what we consider now a real “adaptive allocation”, where the strategy does not switch “binary” between the ETF, but gradually changes the allocations; so this now incorporates the prior volatility control and also the hedging positions Frank had described in addition the the strategy signals before. Indeed the name “adaptive allocation” was used twice and this might lead to confusion.
See here for a more detailed explanation of how they work.KeymasterDon, thanks for the question. Indeed in the original strategies the equal volatility contribution was like the 1/n approach above, which is very robust, but ignores the covariance between the assets as only volatility at the single asset level is used.
The new adaptive allocation with the modified Sharpe ratio works a bit different, as it is used as criteria at the ranking level already, not a later optimization layer. By scaling up the weighting of volatility though the attenuator, the algorithm basically becomes a volatility ‘minimization’. As the ranking depends on the weighted combination of the assets, the optimization is at ‘portfolio level’. Now, this is a heuristic approach, e.g. there is no assumption made of the expected volatility and covariance going forward, it is a momentum concept. You might have noticed in the screenshots of our new backtesting tool that there is an input field for “volatility limit”, which would be a second layer to target certain volatility levels. However as the modified Sharpe ranking already does a great job in the first step, we are not using the second layer currently to keep things simple
As I noted two days ago in this thread, we’re working on a new core strategy which would always hold several assets, optimizing their weighting by a full fledged minimum (alt. mean) variance optimization, e.g. employing the covariance matrix to optimize volatility at the portfolio level. In this strategy we will also use a volatility targeting layer (at the portfolio level) and offer three different options to choose from.
This is inspired by the great AAA approach by Butler, et al which you mention above. As they highlight in their also great “Dynamic Asset Allocation for Practitioners” series (must-read for a rainy day), the evolution from risk parity to more complex concepts does not necessarily mean better results, as these assume robust input variables like for example the covariance matrix. So our current focus is on how to create an easy-to-digest format for this new strategy with robust and transparent assumptions anybody can follow and gain confidence in.
P.D. Just by the length of my response you see this is one of my favorite topics, happy to discuss further.
KeymasterNoam, yes. Here the respective posts which also have been part of the strategy signals for MYRS, GMR and BRS in the past two months. Also see the “Historical Return Tables” for how this has worked in practice so far. You can see the feedback and discussion in each post, we’re working on further articles in more depth.
Let me add that this is rather a logical evolution than a revolution. This adaptive allocation now incorporates the hedging proposals Frank has provided already in the past, and allows for much smoother changes in the allocation than the former binary 100% switches.
KeymasterNoam, thanks for the comment. As of October we have updated this strategy to the new “Adaptive Allocation” logic, e.g. instead of binary switching into the Top1 ranked ETF we now deploy a Sharpe Ratio optimization and vary the allocation % into the Top2 ranked ETF. This results in much smoother changes in the allocation, less transaction costs, and much better performance. We’re gradually changing all former strategies into this new “Adaptive Allocation” algorithm, but based on your feedback might have missed the opportunity to inform you properly. Here the full article on this change, we plan to do further posts with greater detail. Glad to receive your feedback on this change.
KeymasterRussel, in the “Investment and Return tables” we are showing the “binary switches” until October 2014, and from there on the new adaptive switches. Reason being that this corresponds to how we updated the strategies in the monthly signals. For the UIS we’re going to show the full backtested history as published, just working on it, will be ready this evening.
KeymasterWe are recently seing more and more interest from subscribers to execute our strategies using options. So I’m opening this thread for other interested subscribers, in case there is a common ground we will consider including adequate options into our monthly mails.
KeymasterDue to it’s conservative nature and the components SPY/TLT the UIS complements very nicely the other existing strategies. I’ve just added it to our ‘Custom Portfolio Builder’ so have a look there also.
KeymasterDear Michael, thanks for your interest in the new strategy. The rebalancing of the strategy is each month-end, we will inform you shortly after the last close about the new allocation for the next month.
Assuming an allocation of 50% SPY (x)/ 50% TLT (y) in 1x ETF, the allocation using futures, leveraged or short ETF would look like this:
– x% ES E-mini S&P 500 Futures + y% UB Ultra U.S. Treasury Bond Futures (both CME Globex)
– x% SPXU (or SPXS) + -y% TMV (the minus % indicates a short position.)KeymasterMichael, you would receive both a bi-weekly and a monthly signal from us and execute them in your account. You can see the backtested equity for a combination of two or more strategies at our Custom Portfolio Builder
- AuthorPosts


