Home › Forums › Logical Invest Forum › Strategy: Nasdaq 100 Strategy
- This topic has 69 replies, 24 voices, and was last updated 7 years, 4 months ago by
R D HATHCOCK.
- AuthorPosts
- 09/26/2015 at 3:32 am #29702
Vangelis
KeymasterDiscussion board for the Nasdaq 100 Strategy.
10/14/2015 at 4:47 pm #30115acannon1585
ParticipantI noticed that the “Annual Performance vs. SPY” bar chart at the top of the Nasdaq 100 page does not match the year end returns on the running month-to-month list below. It appears as if the bar chart at the top of the Nasdaq 100 page is actually the performance bar chart for the Top 4 World strategy. I thought I would point that out in case it went unnoticed. Thanks!
10/14/2015 at 7:35 pm #30116KeymasterThanks very much – missed that one, we will correct it.
10/15/2015 at 1:36 pm #30130Derrick
ParticipantThe description says the strategy uses TMF, but in the backtest allocation results it shows TLT.
10/15/2015 at 2:02 pm #30131KeymasterDerrick,
That is correct.
TMF has a limited history, so we created a simulated TMF by TLT * 3, used for the longer term backtesting. TLT *3 aligns closely to TMF. The actual signals will be in the form of TMF as it takes up less capital allocation. Does that make sense?
Thanks
Scott10/15/2015 at 5:34 pm #30133ParticipantMakes sense Thank you. Are there any other factors to be aware of when making this substitution? What are the long term effects of holding TMF over 3x TLT? Also does TMF have a dividend? I assume the backtest results include the TLT returns with dividends.
10/15/2015 at 5:52 pm #30134KeymasterDerrick,
I am glad you are thinking it through carefully.
We do use the dividend adjusted data in the calculations, and TMF generally reflects the impact of the dividends indirectly.
TMF is less liquid, and can trade with more slippage vs the targeted price execution. For those that are comfortable paying very careful attention to the trade execution (limit orders, paying close attention), TMF is generally worth it if you are conserving capital. Also, there can be some inefficiency of a 3X ETF capture over time relative to the underlying (you don’t get the full benefits of the 3X).
It is easier and you avoid the risk of unintended execution problems by using TLT instead.
In that case, you would put in extra funds into the treasury bucket. That is, if you were buying $5,000 of TMF, you would buy $15K of TLT to get the same effect.I hope that helps.
Scott10/16/2015 at 3:23 pm #30154ParticipantThank you Scott, that is helpful.
I do have another question about this strategy if that is okay. In your article detailing this strategy you said subscribers should keep in mind the fact that only the current list of Nasdaq 100 stocks were used. Survivorship bias is not the issue. The real concern is that the strongest candidates for a strategy like this would have been companies in the months and years just prior to inclusion in the index (perhaps this is also called survivorship bias?). It seems logical that companies just about to be included in the top 100 would very likely show the strongest momentum. These companies were growing rapidly, hence the reason they made it to the top 100.
Just one example: ADSK was included in the Nasdaq 100 on 12/20/2004 (according to historical data found on this site: http://www.nasdaq.com/indexshares/historical_data.stm). Your backtests show this strategy was invested in ADSK for 3 months in 2004.
I don’t know a lot about the Nasdaq 100, but I think they made less changes after 2011, so it is possible the most recent years are accurate. However, the strategy statistics (maxDD, CAGR, etc.) need to be thrown out since I’m sure there are at least a few other examples like the one I found.
Would it be so difficult to run your backtest with the current list of Nasdaq 100 stocks at the time of the scan? The data is not hard to find, it can be purchased here: http://marketcapitalizations.com/historical-data/historical-components-nasdaq/
I think this could be a very good strategy, but I would need to see more accurate backtesting to be sure this issue isn’t significantly affecting the results.
Thank you for taking the time to address my questions.
10/16/2015 at 4:02 pm #30155KeymasterDerrick,
Your observations are approximately valid. The older years backtests will be less accurate and be directionally overstated.
The more recent data – like the latest year, will be more representative of the “edge”. I have worked with variations of these screening/rankings of momentum stocks related to the Nasdaq and S&P 100 for years out of sample in systems, and I have seen it hold up quite well. It is not likely to beat the market by +40% a year, but it will, over a cycle, beat the Nasdaq with a lower risk profile.
It is easy to look up the older lists of stocks. Operationally, managing the switching between the lists in the rebalancing within our engine has proven difficult, but it continues to be on our “to-do” lists. That is the reason we delayed for six months releasing this, to help ensure we did not overfit the structure.
Thanks for all of the digging; you are a good researcher :)
Scott
10/24/2015 at 9:46 am #30233Drew
ParticipantProbably very obvious questions.
1) Right now you list 9/30/15 Entries for 9 positions all with the 10/24 Exit date (SIRI, EXPD, COST, ALTR, TLT @ 20 EACH… THEN PCLN, CHRW, ATVI, AMZN @ 0 EACH). Does this mean then you have sold the group with 0% allocations and still hold those with the 20% allocation in the list despite the 10/24/15 exit date listed? From the strategy signals overview it almost appears as those all the symbols have a sell signal based on the current date in the exit column. I am not sure how to interpret your signal list.
2) How often are we making changes to the positions in this model?
Thank you.
10/24/2015 at 4:18 pm #30237KeymasterLet me start from the second question:
The model changes/adjusts positions at the beginning of the month, only.
The way we calculate the Nasdaq strategy signals is that first, we run the two sub-models. Each gives us 4 stocks + TLT. Then we run the META layer and allocate between the two sub-strategies. The way our software works, the sub-strategy that is NOT chosen gets zero allocation. Hence, we end up with 4 stock allocations above zero (say 20%) and four stock allocations that equal zero. The “zero allocation stocks”, are the choice stocks of the rejected model and should be ignored. So the way to read this is:
SIRI, EXPD, COST, ALTR, TLT @ 20 each.I hope this helps.
Vangelis
10/26/2015 at 12:05 pm #30264ParticipantThank you. That helped.
10/28/2015 at 7:58 pm #30304jewillia
ParticipantWhen will the NASDAQ100 strategy be added to the Customer Portfolio Builder (Excel version)? I would like to evaluate performance/drawdown with different strategies and asset allocations.
Thanks,
Jeff
10/29/2015 at 6:54 am #30306KeymasterWe should be able to include it starting next month.
10/29/2015 at 1:40 pm #30315ParticipantScott, I will be anxious to see the results of your more accurate backtests for this strategy. While you are correct that the most recent months for are accurate I think the most egregious errors in your data are the outsized returns from NFLX and TSLA in first half of 2013 before they were included in the index in June and July 2013. Which just goes to illustrate my point that momentum is often strongest just prior to entering the index. 2013 would not have been 100+% returns without those 2 components.
Also, does this strategy use the most recent list of Nasdaq 100 stocks each month the scan is run? I ask because EA was included in the index Dec. 12, 2014 and a position was taken Dec. 31, 2014. Would this trade have been possible given the way you run the scan?
Thank you.
11/05/2015 at 1:56 pm #30488Nikesh Simha
ParticipantIs there anyway to check how the strategy would have performed during the Nasdaq collapse during the dot-com bust in 2000 and during the credit crisis during 2008?
11/11/2015 at 4:22 pm #30565ParticipantJust to expand on my question above. I see the back test is from 2009 during a period when QQQ was clearly out performing SPY. I was wanting your take on how the strategy would have behaved during 2000 to 2003 when QQQ was underperforming SPY and also during 2003 to 2009 when it was pretty much flat compared to S&P.
How do we protect during bear markets in this strategy – will it continue suggesting to buy the 4 top NASDAQ 100 stocks? Or will the strategy just suggest TLT/TMF only? My concern is continuing to buy NASDAQ stocks during a bear market will produce a significant drawdown..
Thank You for all the great information on the site…
Nikesh
11/21/2015 at 1:16 pm #30647Anonymous
InactiveI commend the team for building market timing, position sizing and stock picks into an integrated strategy, and striking the balance between trend and short-term mean rev.
However, could you talk about what out-of-sample testing has been done on this strategy? What’s the methodology for o-o-s testing and what is the performance of o-o-s vs in-sample backtests?Most strategies i’ve seen (including most on Logical-Invest) underperform after the publish date (which reflects the out-of-sample regime).
– Which of the Logical-invest strategies have outperformed the benchmark after it was last edited? I’m looking to subscribe, but most listed strategies seem to have underperformed in 2015 (after they were published).11/23/2015 at 3:30 am #30652Frank Grossmann
ParticipantThe Nasdaq100 strategy had a maximum drawdown of 25% during the 2008 correction. As long as treasuries work as a save harbour asset, the strategy will allocate most of the money in long duration treasuries during a correction. It will also most probably switch to the low volatility Nasdaq 100 sub strategy.
11/23/2015 at 4:12 am #30653ParticipantDuring bear markets, the strategy will most probably allocate a major part in long term treasuries if they continue to work as a safe haven asset. Most probably it will also switch to the low volatility Nasdaq 100 strategy. However if US equity enters a bear market, then it can well be that other strategies are a better choice. With the Nasdaq 100 strategy you depend only from the US market while other strategies like Global Market Rotation can then switch to foreign markets which have much lower valuations and may outperform the US market for some time.
So, it is always good to switch to strategies which did well in the near past. At the moment the Nasdaq 100 strategy is going very well. Strategies with which invest in foreign ETFs have problems because of the strong US$11/23/2015 at 4:58 am #30654ParticipantOur QuantTrader software allows to backtest with out of sampling lookback and volatility factor. We did this also for the Nasdaq 100 strategy. It means that the software always calculates the best lookback period and volatility factor based only on historical data. It will then use this settings to do the rankings for the next month investment. Every month the settings are recalculated using historical data. So the calculations never includes pricing data which would have been unknown when the end of the month allocations are calculated.
This year is a difficult year for momentum strategies. Markets go sideways without a clear momentum. This is a situation which we always had just before rates bagan to hike. Another problem is the bad performance of treasuries which is also due to the rate hike fear. Treasuries are a very important component to reduce risk and so a bad performance is bad for the whole strategy performance.
The third problem is the very strong US dollar which directly impacts the performance of unhedged foreign ETFs. Year to date the US$ surged 12% against the Euro. This means a loss of 12% for the Eurostox 50 ETF FEZ compared to the Euro denominated Eurostox 50 Index.
Historically the markets normalized some months after the first rate hike. These periods of uncertinity have always been quite short compared to markets with up (bull) or down (bear) momentum.01/02/2016 at 11:36 pm #31180Jason Bodenheimer
ParticipantI just noticed that he NASDAQ 100 strategy email for January 2016 has one stock different than the consolidated strategy as an overview. The email contains MSFT, but the consolidated strategy overview contains ATVI.
01/03/2016 at 5:41 am #31181KeymasterIt is MSFT, we updated the consolidated overview signls as well. Thank you.
02/01/2016 at 11:36 am #31816delphion
ParticipantBack in late November, you said that the Nasdaq 100 strategy was going to be added to the custom portfolio builder. Is there an update to this as I still do not see it in the custom portfolio builder?
02/05/2016 at 7:52 am #31849KeymasterUpdate as of April 2016: We have included the Nasdaq 100 strategy in our Excel custom portfolio builder which is a free download for all-strategy subscribers.
07/15/2016 at 11:40 am #34514Gordon Cooper
ParticipantHi Vangelis-
Congratulations on how well your NDX 100 META strategy has been working!
Have a question on the rolling returns chart at the top of this page in the strategy’s summary section. Are the historical return charts buggy? I ask because on a total return basis the benchmark (SPY) is up 7.26 YTD (01-04-2016 thru 07-11-2016) based on data from both Thomson/Reuters and Bloomberg. As of today (07-15-2016) your chart shows the strategy’s benchmark YTD return as up 13.78 over those exact same dates.
I have not checked other strategies, but perhaps you could shed some light on this discrepancy.
Thanks,
Gordon
07/15/2016 at 6:58 pm #34530KeymasterHello Gordon,
There is a slight bug in the charts. When clicking on the YTD button, the chart starts from the 1st trading day of the current year and not the last day of the previous year. If you go below and to the left of the chart, you will see two date fields. If you just click on the first field(From: 12-31-2015) and hit enter, the correct date will be used as input and the chart should show the expected return.09/05/2016 at 8:27 pm #35390Ivan Fisher
ParticipantHi,
I’m a new subscriber and I noticed that today 6th September 2016 you are showing a 5% gain in the stock CHTR , however , that stock gapped up on the open of 1st September the day of your signals publication, so I’m puzzled how you could have got into that trade at the pre-gap price on 31 August ?
Also, do you publish you entry and exit prices for each trade ? Are you basing your returns on the open or close of the entry/exit days ?
thanks
Ivan09/06/2016 at 9:39 am #35394KeymasterHello Ivan. You are right. We benchmark strategies a little different. Here is an excerpt from our F.A.Q.:
Q: To determine which ETFs to invest in the next month it appears that you use adjusted closing prices to determine performance of the previous period (e.g. 29 Feb to 31 Mar if just looking at 1 month) Is this correct?
A: Yes, that is true. We use adjusted closing prices.
Q: However when using the service the actual performance would be from the first day of the previous month to the first day of the following month (e.g. 1 Mar to 1 Apr). There could be significant gaps open or down between the end of the month and the start of the month. So which figures do you use for actual performance?
A: What we use as a performance ‘benchark’ is the close of the last day of the month to the close of the next day of the month (ie, close on June 31st to close on July 31st). This is for convenience in order to simplify our monthly performance report.
Real performance is from day and time of entry to next day and time of exit/entry. This depends on each subscriber’s timing and fill price and will deviate more or less from the model. In the long run, unless an edge exists, these deviations should even out. Sometimes one may get a better fill, sometimes not. If this is not true and there is consistent under-performance of buying the first day versus the last of the month then there is a very simple strategy that can profit from this edge and someone will arbitrage it away.09/08/2016 at 4:14 am #35427ParticipantThanks for the reply.
I can understand the simplicity of using the calendar month for benchmarking returns, but from my perspective ( especially as a new user) , when I see significant gaps ( in this case >5%) being included in the performance data then it’s a bit unsettling as that return cannot be achieved . Ideally I want to be able to login, say hit the YTD or a date range button and see that the result is pretty close to what I am experiencing
Could you not just roll the reporting data forward to the close of the signal day ? In this way, every subscriber can theoretically attain the signal day close price, but its impossible for anyone to trade at the close of the previous day
Just my thoughts , but overall I’m happy with teh service you provide
09/08/2016 at 11:18 am #35433KeymasterWe have discussed this before but we could look at the possibility again. Yes, we do have the capability to roll our results 1 day forward. I will try to post something here in the next few days.
09/08/2016 at 11:55 am #35440ParticipantI’d like to follow up on IVANF’s very valid suggestions. I agree that either your performance tables need to track results on an open-to-open basis, or strategy signals need to be published at least an hour prior to the 4pm NY close. Most brokers require MOC (market on close) orders to be entered by 3:40pm EST. In my opinion it is probably easier for most users to trade on the open, but then most users should reasonably expect your performance tables calculated on that basis.
To consider the open / close difference over time is a wash, or to suggest any advantage will be arbed away, is doing a disservice to your subscribers.
Rolling the reporting date forward is an imperfect solution ss I believe it would detract from system performance. I believe it would be better overall to roll reporting BACK one day, so the subscribers are establishing new positions on the close of the last day of the month. My research shows that (because of new month inflows) establishing positions on the close of the last day of the month generates slightly better preformance than trading on the open of a new month and significantly better than trading on the close of the first day.
09/08/2016 at 6:26 pm #35445ParticipantThanks for the replies, I didn’t really think of the rolling back of 1 day like Gordon suggested , maybe that’s an easier implementation , but I guess that also runs the risk that the rankings could get changed depending upon price action on that last day of month between signal day and month end.
Whatever is the outcome of this discussion , I would like to highlight that not all subscribers are USA based , so if you were to publish signals say 1 hr before market close that wouldn’t really work well for people based here in Australia. Plus one needs time to put together the orders and rebalances , which can take some time, especially when one has multiple broker accounts. I also use CFD’s , and the platform doesn’t support MOC , so for those trades I put in limit orders the night before the USA market opens
So please keep this mind for any future changes to the timing of signal releases
thanks
Ivan09/08/2016 at 10:11 pm #35446ParticipantSorry I forgot to add a feature request
Would it be possible to add the ability for users to select “Top N” number of symbols and see the back test results ?
ie instead of being restricted to 4 symbols , users can select the number of stocks they wish to trade
I think for larger portfolios especially ( I don’t have that problem yet…) the concentration on only 4 stocks could be problematic from a risk perspective ?
Your thoughts ?
thanks
Ivan09/09/2016 at 4:21 pm #35458KeymasterWe are discussing how to best adapt our service to accommodate some of these very reasonable requests. We have a variety of clients both professional and private investors located in different time zones. Some are active traders, others are longer term investors that need to review, customize and trade across different accounts in different continents. We will try to satisfy everyone’s needs while we grow. In the near future we are looking into:
a. Being able to issue intraday bare-bones signals, at the end of the month.
b. Keep our current ranking, performance tables and commentary that many subscribers demand, for the next day as is done today.
c. Partner with a U.S. registered Advisory firm that will offer our strategies as managed accounts for hands-free investing.
d. Lower the $$ entry point for QUANTrader so that an individual non-proffesional investor can do what he wishes with our strategies (trade any day, customize parameters, backtest picking N top stocks/etfs, etc)Some patience please as we are a small team.
Your ideas are welcome as always.09/09/2016 at 4:54 pm #35464Alex @ Logical Invest
KeymasterHello Ivan,
you can chose to invest in more than the Top4 shares, this is one of the reasons why we publish the ranking tables. We choose Top4 as balance between diversification and rebalancing effort, normally you would also diversify with a different strategy not to be too much in equities only.
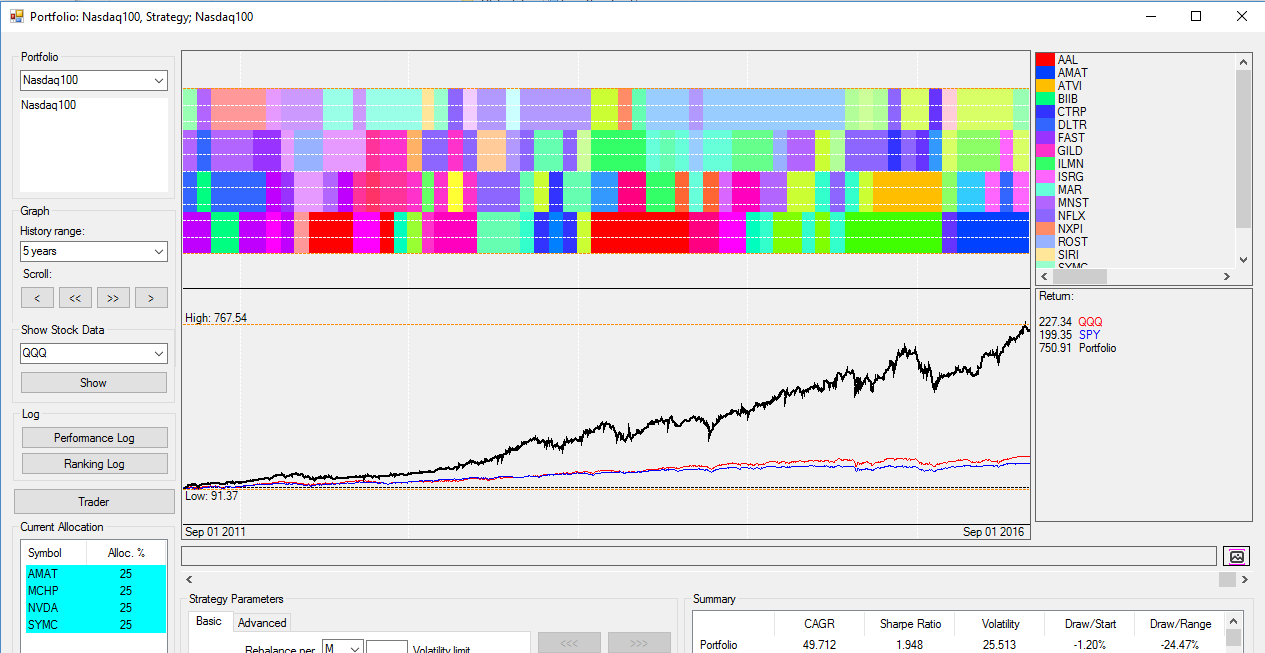
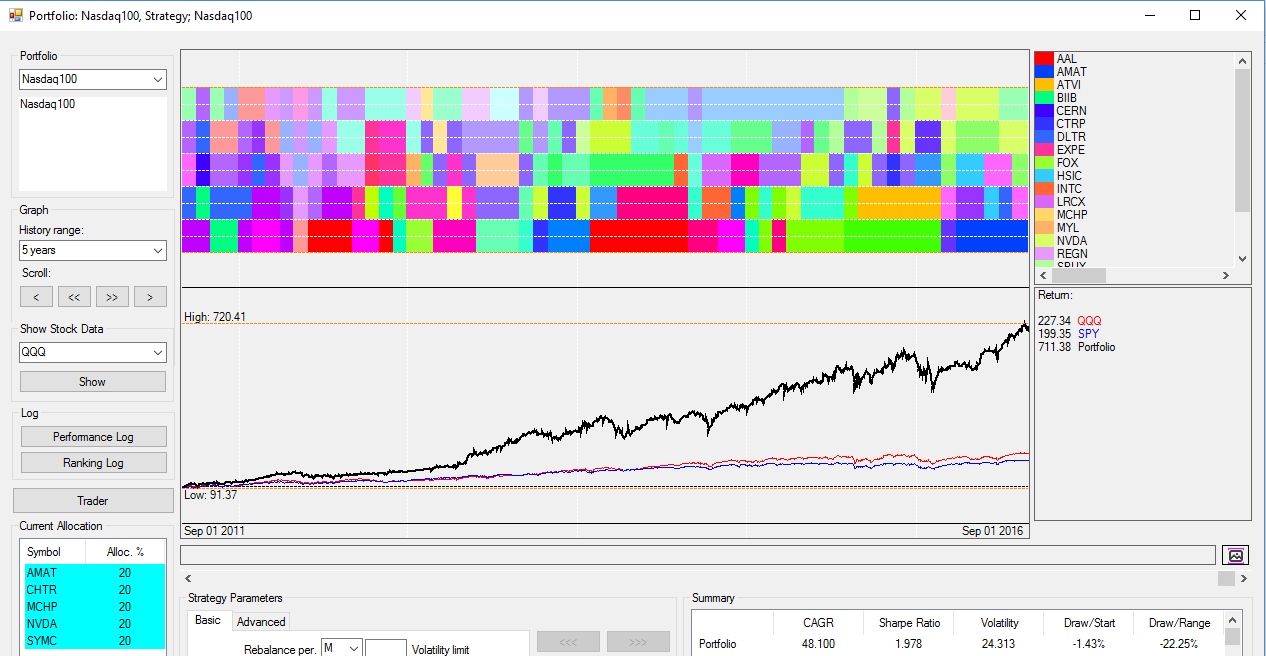
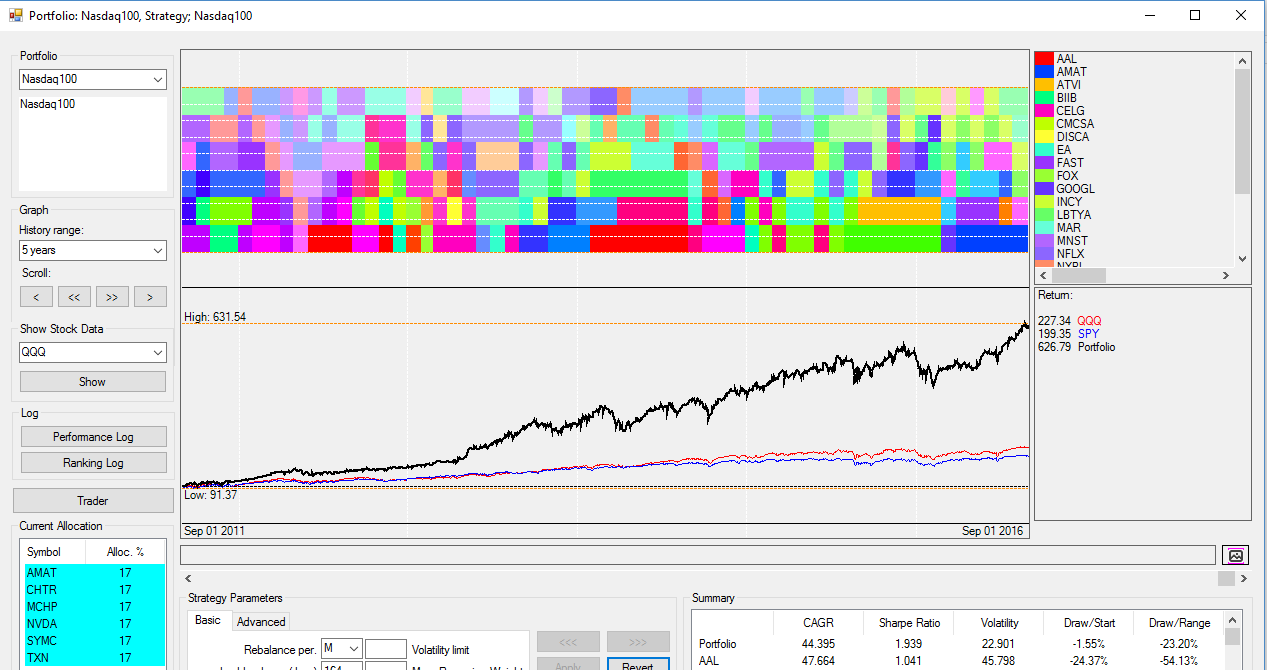
The performance change between Top4,5 and 6 does not change much, only after more than 10 there is a significant drop. See here backtests for Top4, Top5 and Top6 for the last 5 years.
09/10/2016 at 3:25 am #35481ParticipantThanks guys !
Yes we realise you are a small team , but its also a nice problem to have right ? Many customers who like your product
Looking forward to your new feature releases
thanks
Ivan09/18/2016 at 11:07 pm #35587ParticipantHi LI Team,
can you tell me where I can find the individual contribution for each symbol in a given strategy ?
eg if I want to see the returns that can be attributed to say TLT in any given strategy , can I find that somewhere ?
thanks
Ivan09/19/2016 at 4:17 pm #35599KeymasterHello Ivan,
we´re currently not publishing this as an indicator, but the raw data is in the allocation return tables (Below Strategy Charts):
For the Nasdaq it would look like this:
Hist Return Distribution
Top 10: 180.04%
NFLX 39.85%
TMF 38.81%
NVDA 23.96%
ILMN 15.40%
GMCR 14.59%
AAL 11.06%
CHTR 9.90%
REGN 9.57%
AMAT 9.02%
BIDU 7.89%
Bottom 10: -40.61%
MU -1.70%
SPLS -1.77%
CELG -1.97%
VIP -2.10%
CSCO -2.68%
MYL -2.89%
ADSK -6.02%
WYNN -6.04%
SIRI -6.72%
GOOGL -8.71%Others: 124.55%
Total: 263.98%09/20/2016 at 1:38 am #35605ParticipantThanks Alexander ,
is there any way I can run the strategy back tests and exclude the returns from a given symbol ? ( eg TMF or TLT)
I’m just wondering what things would look like if I followed the stock allocations but when it comes to things like TLT or TMF to actually leave that allocation vacant
My rational is that since I use CFD’s , which entails paying interest on the full position size, maybe it isnt that smart for me to effectively be paying interest on a bond position ( also given the discussion around bond pricing in the future). In theory as long as the bond is paying more that the interest expense then I’m ahead , but in some cases the difference may be quite a small positive net return and if interest rates were to increase , then my borrowing costs increase and the bond return would likely decrease so its a net drag on my overall portfolio return. If that’s the case then I’m probably better off not taking the allocation, but I would like to see what the key metrics look like under this scenarioDo you think my logic is reasonable ?
regards
Ivan09/21/2016 at 10:41 pm #35628KeymasterHello Ivan,
currently there is no way of running backtests excluding certain symbols as mentioned above. You might be right about your point of paying interest for bond CFD’s, wonder how that math looks like in detail (vs. reduced cost of capital as you do not invest in full instrument but only difference), would you share?
We will release out QuantTrader software at a more accesible price in future, then you couild do your own backtest.
Please give us some time though, have some things on the burner currently.
09/26/2016 at 3:54 pm #35684Michael P
ParticipantHi-thinking of subscribing and would like to see a sample signal so an idiot like me can see if i can understand it. however the sample signal on this page is for the universal investment strategy-is it possible to see a sample signal for the nasdaq strategy? thanks!
09/27/2016 at 3:52 pm #35697KeymasterThank you for your interest in our strategies. Here’s a sample (September 2016 signals for Nasdaq100):
Private: The Nasdaq 100 Strategy – Investment for September 2016
This is the monthly email of the Nasdaq 100 Strategy.
Investment for September 2016:
20% AMAT, 20% NVDA, 20% SYMC, 20% CHTR, 20% TMFThe 2016 year to date (date of the strategy email) performance of the strategy is: 14.36%
The ETF ranking for this month is:
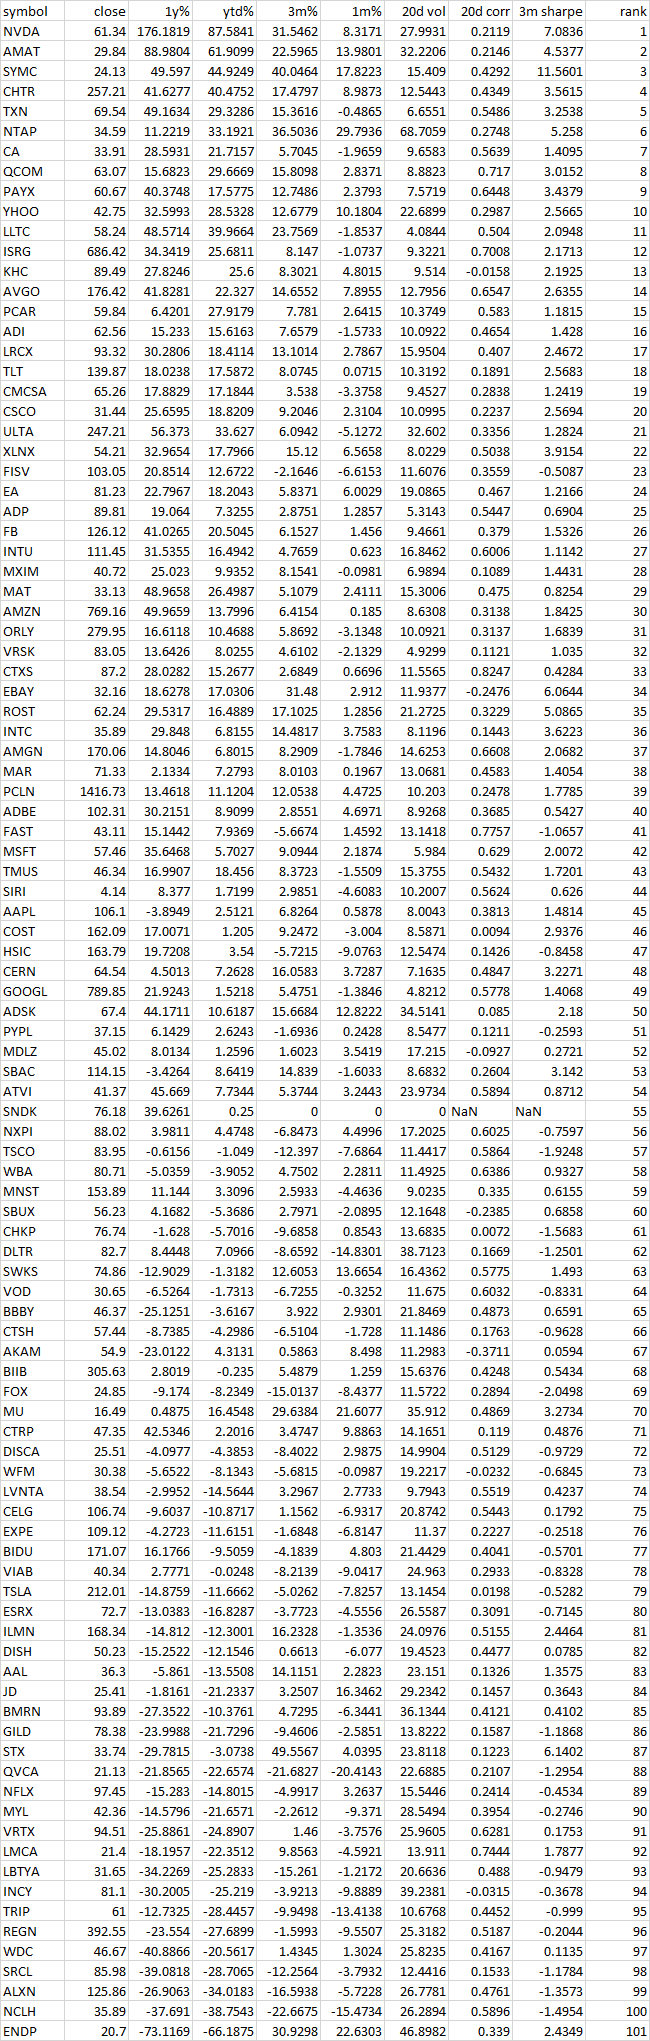
The table is showing the ranking based on the closing price of the last day of the previous month. The values in this table are for “reference only”. The current allocation can be quite different of the top ranked stocks in this table because QuantTrader considers additional data like mean reversion or cross-correlations which can not be displayed in this table. We may also exclude companies which recently had big price jumps because of a takover bids, earnings or any other special events. ETFs can be added or removed at any time during the year.
12/18/2016 at 4:10 pm #37159ParticipantHi, given a raising interest rate environment in the future – is it possible to publish a backtest of the Nasdaq Strategy by excluding TMF. The reason for my questions is in the past 20 – 25 years we have been in a falling interest rate environment and now we might have seen the bottom? – Will this change the way we use TLT/TMF. Same question for UIX 3X strategy – I am concerned about how TMF has completely negated the gains in SPXL from middle of the year…
Granted TMF may bounce but the question is will it trend down over the long run in the future…Thank You
-Nikesh12/28/2016 at 1:44 pm #37339dwedel812
ParticipantHave you considered backtesting using the 1x short Nasdaq etf and/or straight TLT as additional possible hedges?…model to choose only 1. I think the 3x treasury could sometimes washout gains and/or dominate the trajectory. The short etf would likely juice up the returns in 2008 or market corrections more so than 3x tlt.
Same idea with other models add the short s&p 500 1x option.
05/08/2017 at 11:30 pm #41446M Yos
ParticipantHi, I noticed a difference between allocations in “allocations as of today” windows in QuantTrader and the middle colored graph between the 2 chart. For example, when I moved cursor to today’s date on the graph for Nasdaq 100 it shows a ranking of CSX, LRCX, MU and WDC. While in the allocation as of today it listed APPL, CSX, LRCX and WDC. It happened in different strategies. If I need to rebalance at certain date which allocations are the right ones?
06/21/2017 at 6:47 am #42777KeymasterThink we have addressed this in another thread, but just as clarification here again:
The allocations shown as popup when hovering over the chart are the historical allocations up to that date. The new – or future allocations from the last day shown in the chart are shown in the bluish box at the left of the backtest window. Will make this eadier to read in future QT version.
04/02/2018 at 8:57 am #51315Lanemc
ParticipantRegarding the NASDAQ Strategies, I’m getting a little lost. In Quanttrader, you have the NASDAQ 100 Hedged. On the web site in the members area, you have the NASDAQ 100 Top Rotation Strategy and in the Solutions section, you have the NASDAQ 100 Meta strategy. I think a little clarification is in order.
Also, is the Meta strategy going to be made available in the Quanttrader software?
04/02/2018 at 12:24 pm #51324KeymasterThanks for the comment, indeed the different naming is confusing – but it’s all one single strategy: Selecting the Top 4 from Nasdaq 100 and adding a hedge component.
The signals on the website are the same as from the “Nasdaq 100 Hedged” in QuantTrader”, where you can also see the unhedged “Nasdaq 100” sub-strategy. Will clean up the naming and descriptions as suggested.
12/08/2018 at 10:05 am #56612Howard
ParticipantI can’t invest in single name stocks but I can do ETFs. Given how well this strategy performs over time, it really is a shame I can’t use this strategy in my portfolio. I considered whether I should just substitute QQQ with the top 4-5 stocks selected by the NASDAQ100 algorithm, but when looking at the unhedged performance of the strategy vs QQQ, the strategy beats the index by a good margin. Do you have any other suggestion for my case?
In addition, do you have any other suggestion on how I could optimize a portfolio without this strategy? I played around with the portfolio optimization tool but it doesn’t allow me to optimize with a return in mind and I ended up only getting results with just one strategy. The result doesn’t look correct.
12/09/2018 at 11:11 am #56622KeymasterDear Howard,
I had a similar problem when trying to incorporate the N100 strategy with other strategies for a smaller account. I would end up with too many ETF/Stocks since n100 by itself added 4 extra stocks. So I created a similar strategy using QLD and TMF. This came closer to the N100 performance albeit with increased risk.
In my case that was ok since I run this strategy in conjunction with other ones and I kept it capped it to a smaller percentage of the overall portfolio.
Of course it all comes down to what you are looking for, how you combine it with our other strategies and how much risk you can take.For you second question, you can play around with the optimizer tool but to create more precise strategies/portfolios with target risk/return profiles you may need to try QuantTrader.
12/09/2018 at 7:37 pm #56627ParticipantDear Vangelis,
Essentially, I am trying to recreate a different version of the Aggressive Strategy or one with similar return / risk characteristics / diversification by keeping some form of the Nasdaq strategy which is a big component of that strategy. Currently, I can only do that by completely excluding the Nasdaq100 when I construct a portfolio using Portfolio Builder, but my allocation to the 3xUIS would be too high and the portfolio is too volatile. Hence, I am wondering whether I can modify the current nasdaq100 strategy to use ETFs only. My limitation is I cannot buy single name stocks, but I can do ETFs. Have you done any analysis on how your QLD + TMF strategy does vs N100 strategy? How should I go about creating a QLD + TMF strategy myself? I am a current subscriber of all strategies.
Regards,
Howard12/22/2018 at 8:26 am #56764KeymasterHoward,
Sorry about the delayed response. We now have some new core portfolios that may be of help.
These will use only ETFs, no single stocks:
https://logical-invest.com/app/strategy.php?symbol=Conservative401
https://logical-invest.com/app/strategy.php?symbol=Moderate401
https://logical-invest.com/app/strategy.php?symbol=Aggressive401What you may find to be a problem, though, is that they exclude N100 and the new Dow 30 strategy.
The only way to create and test a QLD+TMF (or QQQ + TLT, etc) is to use QuantTrader. You can easily try QT for a month free but you will need to put some time to go through the basic tutorial and learn how it all works.12/23/2018 at 4:14 am #56766ParticipantHey Vangelis, thanks for replying. Merry x’mas and happy holidays to you and to the team! I’ll pkay around with QT.
On a side note, do you guys do managed accounts for non-US people? I know you do for US folks.
Feel free to message or email me directly. I can contact you directly regarding my case and the specific restrictions I have. Thanks!
12/23/2018 at 11:08 am #56773KeymasterThank you, Howard. Marry Christmas to you!
Yes, we can do managed accounts for international (non-U.S.) clients.12/24/2018 at 5:35 pm #56787Supal Patel
ParticipantESRX to CI merger –
Am I missing something here? I entered ESRX around 96$ per share. I purchased 83 shares of ESRX. Currently after ESRX to CI (Cigna) merge, I got assigned 19 shares of Signa.
Is this correct? I lost almost 4600$ (more than 50%) in this conversion. Did others also got similar losses?
12/24/2018 at 5:47 pm #56788maartenb
ParticipantYou should have received $4046 + cash for fractional shares as well. According to StreetInsider.com: “The merger consideration will consist of $48.75 in cash and 0.2434 shares of stock of the combined company per Express Scripts share.”
12/31/2018 at 11:29 am #57154Anthony Yoder
ParticipantI’m a bit confused given the new interface.
Current tickers “as of 2018-12-01” are not what they were at the beginning of December.
Are the current picks (showing today, 12/31/2018) the actual new picks for January ’19?12/31/2018 at 12:09 pm #57157KeymasterHi Anthony,
no, these are not yet the Jan allocations, sorry for the confusion. See this thread for more details: https://logical-invest.com/forums/topic/nasdaq100-dec-18-update-performance-issue/#post-57151 and this post re the changes for 2019: https://logical-invest.com/strategy-changes-for-2019/
02/28/2019 at 10:44 am #59933R D HATHCOCK
ParticipantI noticed that with QT 515S, the Nas100 reverted from high volatility to low volatility back to the beginning of February. Per the original allocation on 2/1, I am holding AVGO, SBUX, XLNX and WDAY; this is saying I should have been be holding AAPL, CTXS, FOXA and PAYX. Please explain, thanks.
02/28/2019 at 10:49 am #59934ParticipantThat listing starting with AAPL was from the QT run this morning. The website lists CELG, HAS, and WTLW along with FOXA. In both cases, the strategy switched from leaders to low volatility.
02/28/2019 at 11:53 am #59946KeymasterHello RD,
we were doing some tests with the new QuantTrader release which incorporates some new features and data source. See details here: https://logical-invest.com/quanttrader515s/
We will publish the new signals until tomorrow morning, the allocations have been updated as before until you see the March signals.
Best,
Alex03/01/2019 at 4:37 am #60035KeymasterHello, Alex
What happend with NAS100 strategy on the website? Now it looks more agressive, with more CAGR, volatylity an maxDD.
For example, one week ago I made a portfolio
BRS 10.0%
MST3 30.0%
GSRS 23.0%
NAS100 25.0%
USSECT 12.0%This portfolio since 2006:
One week ago: CAGR 18%, maxDD 9%.
Today: CAGR 21%, maxDD 19%03/01/2019 at 7:53 am #60198KeymasterGood morning John,
indeed there is a change, see here for details as announced in todays newsletter: https://logical-invest.com/quanttrader515s/
We changed the way QuatTrader handles the mean-reversion part of the strategy, this most importantly impacts Nasdaq. With the new calculation we better exclude stocks which have sudden jumps for example due to merger or acquisition announcements, and on the other hand do not penalize stocks which short-term under-perform but then revert to the mean.
03/01/2019 at 4:15 pm #60292billcantour
ParticipantIs it still possible to subscribe to only NAS100? I can’t seem to find that option.
03/02/2019 at 2:39 am #60319KeymasterUnfortunately, we do not support single strategy subscriptions any more. This was done so we freely develop and implement and make new strategies available to our Portfolios without the administrative overhead. We offer Core portfolios, All-strategies, QuantTrader subscriptions as well as a few free porfolios (PP, US Sector, BUG). https://logical-invest.com/app/subscribe
03/02/2019 at 11:12 am #60356ParticipantThank you. I will look deeper into this.
03/25/2019 at 12:34 pm #61672ParticipantQuestion, after the FOXA split off into FOXA & DIS, I’m having trouble determining the cost basis for the new position.
What do we determine to be the new entry price for the new allocation of both FOXA and DIS?
(for my own accounting , but also curious how you will track this in the historical allocations)
Broker is telling me “$0.00” for both.
thanks03/28/2019 at 6:13 am #61800KeymasterAnthony,
You are not alone. My broker split FOXA to part DIS part CASH part FOXA at a different price. After this month’s signals we will take a look at the rational so we can compute a cost basis.04/02/2019 at 10:26 am #62515ParticipantI notice GSY has shown up this much in BRS, Nas and Dow.Apparently it is coming from both the Gold and Treasury hedge strategies. It seems to be almost the same as a money market fund.
I have not seen any explanation of this modification and would like to hear more about it. Thanks.
- AuthorPosts
- You must be logged in to reply to this topic.