Home › Forums › Logical Invest Forum › Strategy: Universal Investment Strategy
- This topic has 57 replies, 26 voices, and was last updated 8 years, 9 months ago by
sunil kaniyur.
- AuthorPosts
- 11/25/2014 at 2:25 pm #14275
Alex @ Logical Invest
KeymasterSupport and discussion thread for the strategy.
11/26/2014 at 1:46 pm #14299Michael Beck
ParticipantHello,
The white paper mentions having to occasionally rebalance while using this strategy. How often was the strategy rebalanced to obtain the back test results of UIS provided? Are subscribers informed of exactly when to rebalance? Also, could you please explain when and how to rebalance UIS while using short -3x ETF’s or 2x or 3x long ETF’s?
Thank you,
Mike
11/26/2014 at 7:55 pm #14304KeymasterDear Michael, thanks for your interest in the new strategy. The rebalancing of the strategy is each month-end, we will inform you shortly after the last close about the new allocation for the next month.
Assuming an allocation of 50% SPY (x)/ 50% TLT (y) in 1x ETF, the allocation using futures, leveraged or short ETF would look like this:
– x% ES E-mini S&P 500 Futures + y% UB Ultra U.S. Treasury Bond Futures (both CME Globex)
– x% SPXU (or SPXS) + -y% TMV (the minus % indicates a short position.)11/26/2014 at 9:32 pm #14306Michael Cave
ParticipantHow would this new strategy fit with your other strategies in allocating all the asset in a portfolio?
11/26/2014 at 11:07 pm #14307KeymasterDue to it’s conservative nature and the components SPY/TLT the UIS complements very nicely the other existing strategies. I’ve just added it to our ‘Custom Portfolio Builder’ so have a look there also.
11/30/2014 at 6:42 pm #14412Greg
ParticipantHello LI: with the UIS strategy have you seen conditions where both SPY and TLT are positively correlated and have decreasing values? How does the strategy adjust to that setup? Does it go to cash for both? Thanks, Greg
11/30/2014 at 11:01 pm #14413Anonymous
InactiveI’m confused on the differences in the annual returns shown for the UIS strategy (lowest annual return is 19% ! ) vs. the CAGR number of 14% and the 5 year CAGR (18%) shown in the white paper. I feel like i’m missing something very basic??
12/01/2014 at 6:13 am #14419Frank Grossmann
ParticipantThere are many short periods where TLT-SPY has positive correlation. If both go up then anyway we are happy. If both go down like 2013 for a short time, then it is not so good. If you analyze the correlation, then you see that it has it’s negative lows always if there is a market correction. So, in fact this means that if the market crashes investors sell SPY and go into the safe haven ETF TLT. As long as it is like this the strategy works. During low volatility calm bull markets, there is no problem if the correlation fluctuates sometimes towards zero.
12/01/2014 at 12:03 pm #14431Ruth Kingsley
ParticipantHi Frank,
Do you see a problem substituting 3x leverage etfs as replacements for Spy-Tlt in the UIS strategy if held within an IRA account ? Thanks.
12/01/2014 at 12:08 pm #14432ParticipantFrank, just to clarify, I’m not referring to tax issues. It’s just I believe you mentioned leveraged etf’s were ok for margin accounts….wouldn’t they work alright in a Ira account as well ?
12/02/2014 at 6:02 am #14436e5e6ec81c0
ParticipantHi,
Are you going to make the historical variable allocation ratios available on your website for the UIS and other strategies?
Thanks
12/03/2014 at 11:59 am #14490Vangelis
KeymasterRuth,
Generally you can take long positions in leveraged ETFs in US IRAs, but you can’t short nor use margin in most IRA accounts.12/03/2014 at 3:44 pm #14491KeymasterRussel, in the “Investment and Return tables” we are showing the “binary switches” until October 2014, and from there on the new adaptive switches. Reason being that this corresponds to how we updated the strategies in the monthly signals. For the UIS we’re going to show the full backtested history as published, just working on it, will be ready this evening.
01/11/2015 at 7:13 pm #15737Roger
ParticipantI would have liked this stategy UIS back tested using spy/vustx as proxies. Vustx behaves like tlt but goes all the way back to 1990. This would help us see how it worked through the “other” great bear mkt.of the last decade and seen how your new “adaptive” hedging would have worked. The 90s l.t.treasuries had many pos. correlations periods with spy when spy was going down. for quite awhile.
Please consider further research for this strategy development especially to address.what to do when spy and its hedge are both losing money over an extended period.
Thank you in advance01/12/2015 at 7:30 am #15758ParticipantI have just posted a short blog with a 20 year UIS backtest here: https://logical-invest.com/universal-investment-strategy-20-year-backtest/
01/16/2015 at 11:16 pm #15939Michael P
ParticipantSome questions…..
When I click on “see sample signal” above, it shows me a sample signal for the “The Global Market Rotation Enhanced Strategy”-can I see a sample signal for this system?
Also, looking at the historical trade record, margin is used occasionally as there are weightings such as 70/40; is that correct?
Thanks
01/17/2015 at 11:50 am #15984KeymasterBennfine, thanks for pointing this out. Have updated the “Sample Signal” and also the typo in the investment table in Dec 2013.
01/18/2015 at 5:52 am #16077ParticipantThanks! Can you also verify the 2014 return?
I wrote the following on another page here:How are the performance figures above calculated? According to your returns spreadsheet (for 2014)
system beg value end value ret
SPY 245.58 278.65 13.46
universal 382.23 453.34 18.58
bugs 195.42 219.30 12.2Except for SPY, these aren’t the same reported.
Thanks
01/19/2015 at 4:42 pm #16119wigmoney
ParticipantHello…If you are using the Global Market strategy and the Universal strategy can you use the MDY or SPY for both. I know over time the MDY has outperformed the SPY..so can I use the MDY instead of SPY for the Universal startegy?
Thanks.
01/19/2015 at 7:42 pm #16121Keymasterwigmoney,
Overtime the results will often be somewhat similar between SPY and MDY, however for extended times they will deviate by measurable amounts. Over the last year, SPY has been measurable stronger, but that will changes. I would be surprised to see them move in opposite directions for days in a row.
Net…you might be mostly OK, but results will differ somewhat.
01/20/2015 at 2:19 am #16126ParticipantThe UIS table is now corrected. Since the live trading date, the performance was correct, but before we changed slightly the strategy parameters and did not update the backtest table. BUG should also be fixed.
01/20/2015 at 10:09 am #16143Regis Huf
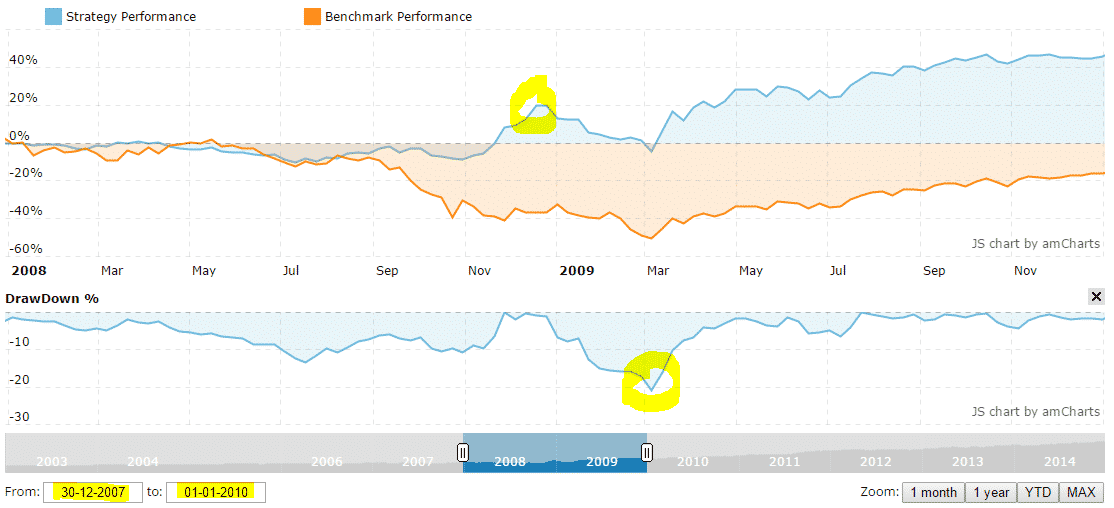
ParticipantYour HOME PAGE shows MaxDD of 6.4% for the UIS strategy.
On the strategy page itself it says (under statistics) however Drawdown of -20.9% since inception.
Can you please explain this difference?01/20/2015 at 10:51 am #16148KeymasterThe 6.4% MaxDD (and further indicators) on the homepage refer to the last 5 years timeframe as originally published. We’ve since then extended the period to full 2003-2014, but not yet updated the homepage statistics. You can see below that the 20.9% DrawDown in 2009 followed a peak of the same magnitude, overall the UIS proved superior to the benchmark in the crisis years.
 01/21/2015 at 7:27 pm #16173Inactive
Hello Frank,
Excellent article. You stated that using futures would be a better way to implement the SPY-TLT strategy by using ES and UB contracts. My question to you is this, how would I know how many contracts to buy of each in order to utilize the adaptive allocation strategy percentages?
Thank you!
01/21/2015 at 8:46 pm #16174KeymasterHi caputoe,
Futures involves substantial leverage and other aspects (rolling the positions, etc), so one needs to be sure to get 100% comfortable with all aspects of futures before you consider executing a real dollar position. Also, a good practice is to paper trade a while first. Once one gets to that comfort level, the contract shows you how to translate the cash value of the futures to the “exposure value” of the contract. The idea would be to keep the exposure value ratio of the S&P contract to the Treasuries contract at the same ratio as the ETF signal that you are aligning with. Never think of futures in terms the cash margin requirement, work from the underlying exposure you are taking on, otherwise you can quickly blow up your account with a margin call at the worst possible point.
01/26/2015 at 12:02 am #16333ParticipantHello LI: Regarding UIS, I’ve tried other bond strategies and have seen that Cliff Smith’s bond hedging strategy actually works better than just TMF alone particularly in periods of rising rates (declining bond prices) and declining equity prices (ie mid 2013). The link for Cliff’s strategy on SA: http://seekingalpha.com/article/2390625-conventional-hedging-may-not-work-in-a-rising-rate-environment
My limitation with this substitution backtest via ETF reply is I couldn’t vary the equity:bond ratio to maximize the sharpe ratio or for minimum volatility. Could you test this TMF substitution using your software and let us know the results.
Thanks,
Greg Polites01/28/2015 at 4:22 am #16408ParticipantHello Greg. I am always reading Cliffs SA articles and he also gives me sometimes good ideas, but I think that using TBF as a hedge is fundamentally wrong. TBF is the same as shorting TLT. The biggest no go of using this as a hedge is that it is no hedge anymore because TBF has a positive correlation with the stock market. If there would have been any bigger crisis during cliffs backtest period, then stocks and TBF would both have gone down. Also using TBF is betting against the trend. Longer term, treasuries will always go up. So, keeping an inverse treasury is just very risky. Then you could as well hedge with SH which is the inverse SPY.
In fact these are long/short strategies, and I did hundereds of backtests with such strategies, but because of the short part of the strategies these always lagged strategies which only invest long with the trend.
One idea was for example to construct a market neutral strategy by going long the top x ETFs and going short the bottom X ETFs. But this does not work, because even if you short always the worst ETFs, it is very difficult to have have a positive performance because even if these ETFs are bad, they still have a positive trend due to inflation and other things. Shorting good ETFs like TLT or SPY is even worse because you have a strong uptrend against you. Worst of all for a hedge is a volatility ETF. There you have several percents of downtrend per month against you.01/28/2015 at 9:03 pm #16438William Keys
ParticipantHello….
I invest in four strategies across six accounts. To simplify my trading, I convert all signals involving TLT and EDV to lesser $ amounts of TMF plus cash. I believe I am maintaining the proper hedge and leverage ratios while at the same time freeing up cash for dry powder and/or additional investment activity. It seems like a win-win situation. Am I missing something and is there a downside to this technique?
Thank you.
01/28/2015 at 9:41 pm #16439ParticipantThank you Frank for the reply. I have two comments. Being from a scientific background I’d very much like to see the numbers of backtest I suggested since I don’t have access to your UIS sharpe optimized software. It would be very interesting to see how the two bond alternatives performed for UIS during 2013 especially.
Regarding your ETF selection for shorting I have to agree the momentum strategies I’ve also tested do very poorly with backward looking momentum picks. As you’re aware I’ve developed a forward looking, momentum based signaling system that generates both long and short signals. I’ve been using it to compliment the SPX part of the UIS strategy and for the last few months has improved the performance of that part of strategy. Details can be found on my blog of this system at: https://hgpolites3.wordpress.com/ Thank you for your reply and in advance for running the backtests. Cheers, Greg01/29/2015 at 9:06 am #16498STEPHEN
ParticipantGreg,
Coincidentally, I happen to follow you on Twitter before I joined L-I. How do you use your STORMM indicators system to choose and allocate to L-I strategies?
01/29/2015 at 11:40 am #16499ParticipantNo, it is absolutely correct to convert like you do in TMF.
01/29/2015 at 12:20 pm #16500ParticipantI did a 5 year backtest with the BRS strategy replacing PCY with TBF (which is the short TLT EFF)
TBF was chosen shortly 3 times. Longest in 2013 from July to September. However this did not help a lot. See results below.
Normal BRS: CAGR 15.48 Sharpe 2.35
BRS with TBF: CAGR 12.80 Sharpe 1.80I think it is better to go to cash for the case that everything would go down simultaneously. This is better than going short Treasuries.
01/29/2015 at 9:02 pm #16506ParticipantHi Stephen; I’ve been using the GMRE and MYRS strategies and have only applied the STORMM indicators in a broad way with the monthly picks from GMRE. Most times the leading picks from momentum based systems are in overbought territory technically. My indicators can discriminate if new highs are in store next when ETFs are in overbought conditions – or if substantial declines will develop. I’ve applied this decision process montly in 2014 to GMRE and it allowed me to avoid the negative impacts of ILF and FEZ which helped increase the yearly gain.
Lately I’ve been using the UIS strategy with great success (thank you LI!) and the STORMM indicators are much more reliable with large markets like the SP500. Lately there have been several sell or short signals for the SP500 from the STORMM system and I’ve used these signals to take an equivalent (or larger) position in SPXS to balance my SPXL investment via UIS This has helped avoid loses in SPXL regardless of the investment amount. Now that LI has published the backtest of the UIS strategy I need to go back in the STORMM system and list the sell periods. This overlay would be interesting to compare if LI is interested. The SP500 STORMM signals are presented daily on my blog.
Cheers,
Greg01/30/2015 at 8:46 am #16527ParticipantGreg, thank you for the reply. I look forward to reading about the results of your review.
01/31/2015 at 3:48 pm #16614ParticipantHi William, would you consider sharing the conversion formula?
02/06/2015 at 12:39 pm #16897James Stahl
ParticipantWhen using futures, what would you say would be the better treasury hedge? UB or ZB?
02/06/2015 at 4:36 pm #16908ParticipantThe UB future is about the same as TLT
02/16/2015 at 1:30 pm #17395ParticipantSorry Stephen; I just now saw your post. To convert TLT to an equivalent holding in TMF, multiply TLT times 33.33%. To convert EDV to an equivalent TMF holding, multiply EDV times 50.00%. In either case, the resulting cash position can be held for a more conservative play, or reinvested to your desired level to create a leveraged position. Frank gives the percentages for fully reinvesting all of the cash in his comments.
02/24/2015 at 4:44 pm #17649InactiveYou mention that the look back period is “optimized” usually 50-80 days. Can you be more specific? Do all of your strategies have an “optimized” look back period that is dynamically changing?
02/24/2015 at 5:05 pm #17650KeymasterMike, yes, all ‘adaptive’ strategies use what is commonly called ‘walk-forward-testing’, i.e. the lookback period and the ‘f-factor’ change over time. We use generally a 1 yr timeframe for the walk-forward-testing, e.g. each year the strategy finds the optimized values with the highest performance over the last 12 months, and uses them going into the next year. This ensures that for example the lookback period gets shorter in times of relatively high volatility, and longer when markets are calm.
Additionally, the walk-forward-testing is recognized as one of the most effective ways to minimize the ‘curve-fitting’ problem many backtests have, as you slice the strategy backtest into yearly buckets which are tested independently from each other.
Look at my comment from yesterday on our new adaptive Bond Rotation Strategy, there you see further details and a ‘parameter heatmap’ which shows you the areas of parameter stability: https://logical-invest.com/new-enhanced-bond-rotation-strategy-adaptive-bond-allocation/
02/25/2015 at 11:47 am #17695InactiveThanks for the clarification Alexander. Just to make sure I fully understand,is the walk-forward testing completed annually (i.e. once per year at year-end), or do you conduct a new walk-forward test each rebalancing period using a rolling 12-month period for look back omtimzation? I’m just trying to understand how often the strategies change/update the look back period and f factor (i.e. once a year, each rebalance period, etc.) Thx.
mike
04/01/2015 at 2:50 pm #19020Mike Bangs
ParticipantHi,
I have been using UIS for the last few months combining IRA and taxable funds.
I have experienced considerable ‘friction’ between the closing price used for your calculations and next day intraday trading prices. The first of the month seems to me to be crowded with many calendar and trend movement trades. These crowded trades seem to increase intraday price volatility as well. Also with TLT, the xdiv date is the last day of the month. While I understand that the dividend does not theoretically affect the price, with the release of the recommended SPY/TLT ratio being released early on the am of the first day after xdiv, this day after xdiv also seems to result in volatile intraday prices.
Finally, I would like to find a way to use Market On Close orders to simplify reallocation and reflect real world conditions. This is difficult since I can buy on the close but only when I have sold before the close in the IRA based trades as there is no margin capability.
All this being said, since the UIS is designed to reduce trading and associated friction is there any way to a) avoid the first of the month for reallocation day perhaps by using a different closing/reallocation day for the strategy email, b) if possible either capture dividends or be far enough away from xdiv date to avoid any xdiv caused aberrations and c) in addition to the monthly results reflect and report on subscribers realworld trades with MOC results on the day after the email calculations?
Dont know if any of this makes sense but appreciate the strategy. Thanks!
04/01/2015 at 8:33 pm #19038Keymasterkwmike,
Yes, it makes sense. For me, generally leaving a open limit order and waiting for the market movement to give me a fill over time often works, but that does not work for everyone. Market on close orders (and others like VWAP) can help. We are considering options of either proving the official signal earlier or, down the road a bit, give more frequent updates to the current state of the signal for those that want to operate on a different time cycle.
Thanks for your thoughts and questions, they are useful.
Regards,
Scott04/01/2015 at 8:34 pm #19039Sandeep
ParticipantHI Frank for the month of April can you suggest OTM put trades. Shall we hold on to these puts until expiration or sell after a month ?
04/01/2015 at 8:36 pm #19040ParticipantSorry please read the last sentence as shall we close them after a month ( by buying back ) or shall we let them expire .
04/02/2015 at 2:36 pm #19079ParticipantI did both, and I can not tell you what is better. I tried this options strategy for some time, but I think I am not really an options specialist and I do not have the tools to really backtest these option strategies.
04/02/2015 at 2:40 pm #19080ParticipantI am sorry, but I can not give you such an advice. I am not allowed to do this in a forum like this.
04/12/2015 at 11:29 am #19327rfm12
Participant[Deleted]
04/12/2015 at 11:35 am #19328Participant[For some reason, this keeps appearing above earlier replies. Not sure why.]
How are you calculating the Sharpe ratio? I was looking at your sample strategy signal, which shows it as of 12/31/14 (presumably from 10/2/14, 3 months or 63 trading days):
SPY = 3.1, TLT = 4.4
However, ETFreplay’s backtesting tool shows the Sharpe ratios as:
SPY = 1.8, TLT = 3.0
If I use the standard calculation, I get the same as ETFreplay:
[(avg. daily return – risk-free rate)/std. dev. of avg. daily return] * sq rt of 252
from Oct 2 through Dec 31, with a risk-free rate of 0 (which I think you said you use):
SPY: [(0.13% – 0)/0.71%] * 15.9 = 1.8
TLT = [(0.10% – 0)/0.88%] * 15.9 = 2.9
Thanks.
04/14/2015 at 1:25 pm #19395ParticipantI found what may be the reason. On ETFreplay, I was using buy-and-hold strategy. If it’s rebalanced monthly, as the UIS strategy is, the Sharpe ratio may be higher. I can’t test that, because it’s available only with a subscription, but I expect that’s it.
11/25/2015 at 6:08 am #30672rfernando80
ParticipantHi Frank,
I started trying the SPY/ TLT with an approx. 45/55, which gives the smallest drawdown since inception (about -16%). I intend a single yearly rebalancing. I have two questions for you, have you considered using rebalancing bands, like between 35 and 50% SPY to tlt, and rebalancing whenever it goes above or below. 2- Have you considered using options risk reversals for the SPY/TLT strategies, as you get a very good risk reward from selling ‘expensive’ puts to buy comparatively ‘cheap’ calls? If you look at the SPY or SPX options table, you you see that if you choose a delta of say, .30, your long call would be way closer to the money than your short put, giving the trade a very nice risk reward profile. I guess you would be interesting to combine these strategies.
Best,
Fernando11/26/2015 at 5:49 am #30685ParticipantI never did risk reversals, but I like to sell otm put options both on SPY and TLT with about the same premium. As SPY/TLT are inverse, the chance is big that both or at least one of them expire wortless.
12/22/2015 at 10:48 am #30957INS12
ParticipantFrank, could you provide some more details on your approach with put options, please? For example how far OTM, how many DTE, Deltas etc.
Thanks!08/09/2016 at 7:59 am #34898Ivan Fisher
ParticipantHi,
I came across your website recently and I have been taking the time to watch your videos and read about your strategies.
I have a question on how best to manage leverage when combining multiple strategies.
I live in Australia , and I have different broker accounts that can offer different instruments. With respect to ETF’s , I have access to RegT margin via IB, but also CFD’s via SAXO. Consequently I can dial up and down my leverage from 2:1 ( RegT) all the way to approx 10:1 (CFD).Would you suggest its best to manage the leverage from “my side” as opposed to using your Lev 2 settings in the portfolio builder ? For example, assuming I want to target 2:1 leverage , should I run the portfolio builder using unleveraged settings , then just multiply the position size x 2 ? Or is it best to run the portfolio builder using the lev 2 settings ?
From my perspective , if I were to manage the leverage from my side it would make things a bit easier . Say if I wanted to run the portfolio at x3 then I just multiply any allocations x3 . What I’m not sure about is what happens inside your tools when one selects the Lev 2 settings ? I know its not just a straight multiplication of the standard allocations x 2 , there’s a bit more to it , so I’m after some advice given I have access to CFD’s which I believe most USA based investors don’t have access to.
The other question I would like to ask is regarding the use of CFD’s for the ETF’s such as TLT and EDV. At current interest rates , it would cost me approx 4% PA for the financing ( and with CFD’s you pay interest on the full position size). Would that deter you from using CFD’s for those ETF’s ? I can also use CFD’s for SPXL and TMF and because they have 3X lev, it would mean my I could actually cut my position size by 2/3 which means I’m financing a smaller position. My initial thoughts are to try and carve up the broker accounts so ETF’s such as TLT and EDV are placed in a cash account or low margin account, whereas the other ETF’s used in the strategy could be done using CFD’s at higher margin and once all positions are combined, an overall margin target could be attained.
Since you are in Europe, I imagine you are also familiar with CFD’s , so I would be very interested in your views and if you currently use them yourselves to trade the strategies .
I would like to also say I’m very impressed with what you have put together ( although I struggle with the maths…)
regards
Ivan09/28/2016 at 4:57 am #35699KeymasterHello Ivan,
Firstly, thanks for your interest in our strategies!
The 2x leverage in the portfolio builder is actually only simulating the leverage you would apply in your account. For the signals it is indeed a straight forward multiplication, but the portfolio change a bit due to underlying trading costs and different math when combining strategies. So, yes, it would be up to you applying the X times leveraged signals in your account.
We have no real experience using CFD’s as this is not needed when playing “safe” with max leverage of up to two times. Also we would not use them due to higher transaction costs (as you rightly point out) and them performing different than plain vanilla ETFs. Leverage is a dangerous game even using standard ETF, and even more when using leveraged ETF, this is why we do not advise any subscriber to excessively leverage or use exotic instruments.
Hope this does not discourage you, glad to further discuss,
All the best,
Alex11/02/2016 at 11:52 am #36519Nikesh Simha
ParticipantHi,
I subscribe and invest in the UIS-3X model…
Since this is a 3X ETF and very fast moving in both directions, Have you tried rebalancing weekly? If so, have you found any benefit? Also, Is there any time when both SPXL and TMF might not be the right choice and will the model go to Cash in those times?Thank You
-Nikesh11/03/2016 at 4:36 pm #36548ParticipantBacktests prove that weekly rebalancing reduces the performance of all strategies because you react to every small up or down of the markets. This results in many small buy high sell low trades. Less rebalancing is better because this allows you to invest in longer term trends.
3x leveraged ETFs perform well in up or down markets. If the markets go sideways, then they can suffer reballancing losses.10/20/2017 at 11:14 pm #46843sunil kaniyur
ParticipantHi Guys
Great job at all the new developments. Thinking of switching to futures for the UIS strategy component.
How would you use futures in the UIS Strategy when TLT is replaced by TIP ?
Regards, Sunil
- AuthorPosts
- You must be logged in to reply to this topic.