Home › Forums › Logical Invest Forum › Experienced investors: Investment Portfolios
- This topic has 92 replies, 27 voices, and was last updated 5 years, 5 months ago by
Patrick @ Logical-Invest.
- AuthorPosts
- 01/17/2015 at 2:03 pm #16016
Alex @ Logical Invest
KeymasterUse this thread to address more sophisticated questions and suggestions on portfolio composition, optimization and technicalities – so we keep them in one space for other advanced readers.
01/17/2015 at 2:04 pm #16017KeymasterWe received an interesting question by email, we post here to the benefit of the broader audience.
“In several of your blog posts, you advise shorting TMV as a hedge and leaving it in the account. This means we would never realize any gain from it, although we need to pay the cost of borrowing the money monthly. Do you ever sell any of the hedge if the price goes down, to cover the cost of borrowing, and then buy it again when it goes lower?”
Contrary to a long position a short position will lose value over time. So, if you open a TMV short position of 10’000$ and Treasuries go up, then TMV will lose value. After some time your short position will for example only have a value of 9’000$. Now because you want to keep a 10’000$ hedge, you will have to sell more TMV for 1000$.
In fact you are doing exactly the same as someone who has the +3x leveraged TMF to hedge. His TMF position would have gone up from 10’000$ to 11’000$. To keep it at 10’000$ also he would have to sell ETFs for 10’000$.
So the effect of rebalancing is exactly the same for long and short ETFs.01/17/2015 at 2:05 pm #16018Sam Sokolosky
ParticipantIn one of Frank’s comments a while ago I believe he mentioned a minimum single strategy size of $50,000, though on a followup question discussing the BRS he said you could use one etf versus two to keep costs down…..we were discussing a $20,000 account.
If we wish to add Bug to the other 5 strategies (UIS,MY,GM,GS/L,BRS) is there a recommended overall size? Because the strategy holds more than 2 etf’s, perhaps 4-7, then what threshold/overall strategy size would make monthly rebalancing for Bug reasonable. For example, if on average you hold 5 etfs in Bug you may want to start with $10,000 or $20,0000 or more in each knowing there will be monthly rebalancing and transcation fees.
Good job working through this rollout. Thanks.
01/17/2015 at 2:05 pm #16019Vangelis
KeymasterThanks for the kind words, and good question Sam. Answer depends how someone is set up with the brokerage . . . Interactive Broker trading fees, or more like $8/trade model? Ultra Low commission and you can make smaller allocations work. Also the personal preferences of time overhead of managing very small trades. Remember, some of the adjustments will be partial shifts, so a 10% allocation shift may mean moving just $1K of a normal $10K position. Finally, there is the tax reporting.
All this depends on your situation and we do not advise individuals, only general ideas. For me, I would work out allocations that targeting trades of at least $2.5 or more per ETF per trade adjustment. See what makes sense for you and project back to how much total allocation that works out to be.
I hope this helps a bit.
01/17/2015 at 2:06 pm #16020Patrick @ Logical-Invest
KeymasterPatrick wrote:
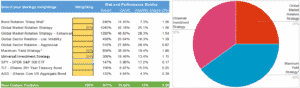
Here are three models that offer low volatility and high Sharpe:
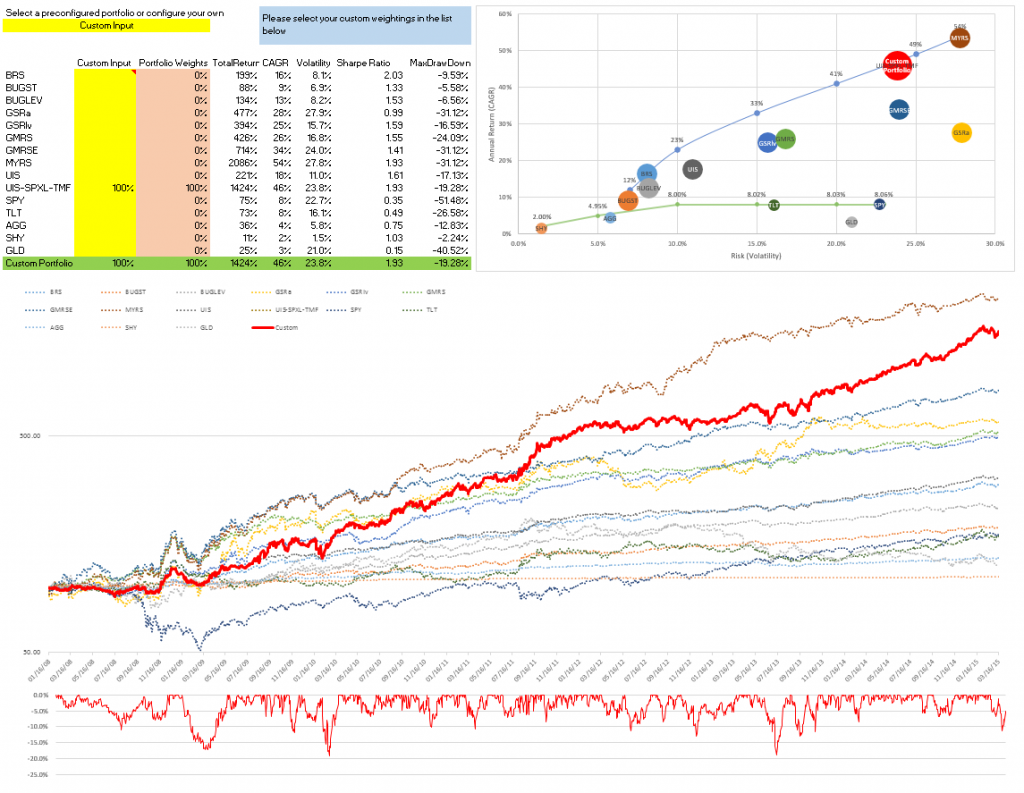
Model A B C BRS 30% 20% GMRS 5% 20% 25% MYS 30% 30% 40% UIS 35% 30% 35% CAGR 25% 29% 33% Volatility 9% 11% 13% Sharpe 2.3 2.3 2.3 01/17/2015 at 2:06 pm #16021KeymasterPatrick, thanks, this is great! Let me add the visual representation of these, and we shall call them in future:
“Patrick A”:
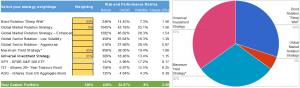
“Patrick B”:
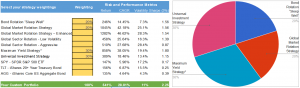
“Patrick C”:
Btw, as you might notice what you have done is a portfolio of strategies, or a “Strategy of Strategies”, e.g. treating each underlying strategies’ equity curve as an asset (class) for a next layer of strategies. Currently this is limited to applying fixed weightings, but imagine to create a rotational “Strategy of Strategies” where you invest in the Top 1-3 best performing strategies, or a volatility weighted strategy portfolio where each strategy is assigned or limited to the same “bucket” of volatility, or even a mean-variance or minimum-variance optimization of strategies?This is what we mean with the “meta-strategy” approach we’re currently building up. Concept is up and running, first tests look very promising, but we’ll take some more time to fine-tune both the concept and the publication to present you with a well-rounded paper. Anyhow, just drop us a line to share your ideas, needs and ideas around this.
[Note these portfolios are not updated to full 2014 data]
01/17/2015 at 2:07 pm #16022KeymasterHi Patrick, indeed for our analysis we also use the Sortino Ratio beside the Sharpe Ratio. It depends a bit on the strategy you are evaluating, especially on what risk/return profile you are focusing. For strategies with higher volatility the Sortino Ratio gives a better view, while we prefer Sharpe for lower volatility strategies. Sharpe is the broader known, this is why we use it for publication, but are open for feedback.
The volatiltiy shown here is the annualized monthly volatility, e.g. in Excel StDev(A1:A100) * Sqrt(12). This prototype needs to be light-weight, therefore we did not put daily equity data in. But the result is about the same. This is also the reason we currently do not include MaxDrawDown, as with monthly data it does not reflect the real “fear factor”. The next version will be on daily data level, and with more options to be selected.
01/17/2015 at 2:07 pm #16023Michael Cave
ParticipantWhen will the “meta-strategy” mentioned earlier in this thread be published?
01/17/2015 at 2:07 pm #16024KeymasterMichael, thanks for your interest. The ‘meta-strategy’ is part of a major overhaul on the site we’re currently planning, we’re targeting Q1 2015. Will post some examples before to get feedback and develop it to your needs.
01/17/2015 at 2:07 pm #16025hawaiianwaverider
ParticipantGreat work by you all. Wouldn’t you want to add correlation as a criteria (both to say S&P500 and each other strategy) then mix the least correlated strategies to further reduce risk?
I’m looking forward to your continuing efforts.
01/17/2015 at 2:07 pm #16026Michael
ParticipantTo minimize trading costs consider Folio Investing brokerage. For 1 fixed annual fee you get more window trades than you could ever use with these strategies. Also, you could set up a folio for each strategy within the account for easy strategy management. I have used these guys for years as well as Schwab and IB. Some drawbacks though – no margin and no options.
01/17/2015 at 2:08 pm #16027Keymasterhawaiianwaverider,
Excellent point; that is one criteria we look at and I intend to do more in that direction.Of course, the challenge is developing the strategies that are logical, stable going forward, and non-correlated to each other and the S&P; other than that, it is quite easy. :)
01/17/2015 at 2:08 pm #16028KeymasterMichael,
Thanks for the heads up on Folio Investing brokerage. They look like that could work for some subscribers; I will need to give them a call.01/17/2015 at 2:09 pm #16029sunil kaniyur
ParticipantExcellent work, just a couple of points
1. portfolios with correlation with each other would be great as there is overlap particularly with regards to the bonds and to lesser degree SPY vs MDY.
2. Curios as to why the US REIT like IYR not included in the sector rotation ETF’s. I note we do have RWX.thanks
01/17/2015 at 2:09 pm #16030KeymasterSunil, thanks for the feedback, appreciated. Agree on the correlation functionality, give me some days to include a correlation matrix between strategies and the “custom portfolio”, this was suggested before.
The emphasis in the “Global Sector Rotation Strategy” lies in “Global”, as the Universe of Sector ETF is quite huge we limited to global indices where suitable. This is why we choose RWX over IYR. We have one strategy on the burner which employs both US and Global REIT, this might be of interest to you.01/17/2015 at 2:09 pm #16031ParticipantNice work on adding in correlations. Knowing your collective brainpower, you could optimize an allocation for a given level of risk- have you thought about doing that (among your hundreds of other to-do’s)?
Could you add another column showing drawdown? I think that would help put an allocation in perspective I think better than vol.
Great work all.
01/17/2015 at 2:09 pm #16032KeymasterAloha, and thanks for the feedback.
We have one strategy on the burner that does exactly that. Using minimum (alt. mean) variance optimization combined with volatility targeting. E.g. weightings are first computed by a solver algorithm to find minimum (or target) volatility at the portfolio level, and exposure is reduced if expected volatility is above the target volatility (or scaled up in low volatility environments).
This is inspired by the Adaptive Asset Allocation paper by Butler, Philbrick and Gordillo whom we are big fans of – another must read! We’ve been trading this already sucessfully, but need some more time to bring it into an easy-to-digest format.
Yes, drawdown is definitely the next to add. As this tool is running on monthly data, this would be monthly MaxDrawDown only, which for all strategies but the MYRS also would match realized drawdown. Wanted to wait for the integrated version of the tool, but can plug it in.
01/17/2015 at 2:10 pm #16033ParticipantVery good Alex. Thanks for your detailed and prompt replies. I am likewise a big fan of Adaptive Allocation and respect David Varadi and his work.
Instead of solving for min. vol, which punishes upside vol, what about targeting drawdown or max Sortino as Patrick above referenced? Curious as to your thoughts. Showing Sharpe will certainly help people compare as you noted (in Patrick’s reply above) Sharpe is more widely used.
Being able to see your thoughts and your responsiveness is a big benefit.
Many black box or other less transparent strategies will be abandoned once the inevitable drawdown occurs as the user doesn’t know enough to stick with the strategy so your details help.
01/18/2015 at 10:17 am #16090KeymasterHave just added the monthly drawdown chart above, please let me know if this addresses your needs. We can built portfolio examples with a target Calmar (CAR/MaxDD) or Sortino ratio, let me know some examples you would like to see here in the forum. Again, here these are ‘optimizations’ over the whole time period, in our background system we can build more sophisticated models like the ‘meta strategy’ we’ve been teasing now for several weeks, but still owe you :-)
01/20/2015 at 6:27 pm #16154daniel morton
ParticipantThanks LI. If you could please include the Sortino ratio, max drawdown and duration (i.e. drawdown + recovery). I think the portfolio builder should take desired returns/metrics as inputs and display the weighting of strategies as outputs. Separately, it is difficult to appreciate the impact of the metrics regardless if they are inputs or outputs. CAGR is clear but at what volatility do people panic and abandon strategies even if the volatility is within the bounds of the strategy but not acceptable psychologically.
Daniel
02/03/2015 at 1:44 pm #16777Anonymous
InactiveI have a question for the forum. I am from Denmark and hold my portfolio in USD at the moment. As you probably know speculators are trying to push the Kroner higher. http://www.bloomberg.com/news/articles/2015-01-19/denmark-strikes-back-at-speculators-as-peg-defenses-burnished
Please lets have a discussion how to protect the portfolio thats in USD ETF’s.
Do you hedge the currency and how do you keep the capital intact.
02/03/2015 at 6:04 pm #16779ParticipantA question on the portfolio builder. Does it take into account the new variable hedging strategies? It seems to be based on the pre-2014 non-hedged strategies. I am trying to set up a portfolio but I’m stuck on whether to add a bond rotation strategy to hedge the portfolio as the current strategies such as UIS, MYRS and GMRS are already hedged as of this year. Your thoughts please.
Michael Kiefer
[email protected]02/04/2015 at 2:08 pm #16811ParticipantA suggestion. The UIS strategy is presented in a non-leveraged and a leveraged version. It would be helpful to show the leveraged version in the Portfolio Builder so we could see what effect the leveraged strategy will have on the portfolios we build.
Michael Kiefer
[email protected]02/05/2015 at 1:52 am #16825KeymasterPeter,
Depending on your broker you can hedge your USD ETF exposure by buying an equal nominal amount of DKK/USD in the forex market (via margin) or use futures if those are available to you.02/05/2015 at 3:28 am #16826InactiveThanks. I am using Interactive Brokers. What futures can you recommend.?
02/05/2015 at 5:13 pm #16847KeymasterPeter,
I am not familiar with available futures as far as DKK is concerned. If you do find a solution please share for the benefit of other users. If anyone else has more info feel free to join the conversation.02/05/2015 at 5:22 pm #16848KeymasterMichael,
I assume you mean the BUG leveraged?
Thanks for pointing it out. Will do.02/05/2015 at 5:27 pm #16849ParticipantNo, I mean the UIS strategy. In the monthly stategy update, the UIS strategy is posted as a SPY- EDV strategy. As an alternative, a leveraged short version is also listed. Since this strategy is traded in an IRA I have substituted a SPXL-TMF leveraged strategy instead.
02/07/2015 at 6:42 pm #17086KeymasterMichael,
re your question on the timeseries in the portfolio builder, sorry for the late response. The data used is based on the former strategies, and only since late last year the new adaptive strategy signals have dropped in. However, as the portfolio builder is rather a ‘forward-looking’ instrument, I agree that we should use the backtested data from the adaptive strategies.
For consistency to our long-term followers we’ve so far stuck to our principle to ‘fix the past’, e.g. not change any signal or performance data even if the strategy had evolved. With the new portfolio builder (just approved final specs and design and kicked-off built yesterday, Yuppie!!) we will use the adaptive strategy signals. Finally, you will see the difference not to be significant, we’ve done some test already.
02/07/2015 at 6:54 pm #17087KeymasterMichael, if there is a general interest in a leveraged or short ETF version of the UIS we could certainly built this, publish the backtest and include signals in the strategy posts also. I’m a bit hesitant to include further options in the portfolio builder though. It’s already quite crowded with the strategies that have the most followers, so adding further alternatives might create confusion in my eyes.
In addition to the long promised and finally kicked-off next version of the online tool, I’d rather propose to make an excel tool available for the advanced users, so you can also do your own optimizations and tracking. We could include more timeseries like the requested there, build in some solver optimizations for example, and share somewhere for open collaboration. For some stuff excel is just more flexible, also like the things I still owe Daniel from the post above.
Deal? Also happy to be convinced otherwise..
02/08/2015 at 12:16 pm #17108ParticipantThanks, I realize the complications of my request. The upgrade of the Portfolio Builder will certainly help. Also, the excel tool would also be of great help. Those two additions would certainly meet my needs.
02/19/2015 at 7:42 am #17485EUPWA
ParticipantHello and thanks for the great job!
I have tried to reach a “minimum” volatility portfolio, Target was 4%,
One result was: CAGR 10.35% Vol: 4.0% with the following allocation: 45% BRS – 25% BUG – 30% AGG.It would be very interestig to know what could be the improvements under the vol constraint.
Again great job achieved.
02/19/2015 at 4:31 pm #17510Frank Grossmann
ParticipantYou can’t do much else. The only thing would be to impose a volatility limit and go partially to cash if market volatility increases. However with bonds the problem is that these things are normally triggered by FOMC and FED statements and these are difficult to guess right.
02/25/2015 at 12:07 pm #17696ParticipantThanks Frank,
I will go through it to figure out pro/cons, anyway, you mentioned a good point related to bonds vs. FOMC/FED.
03/01/2015 at 1:39 am #17982KeymasterI really appreciate this tool. When will you add January and February data? Would also like to see Sortino ratio. Thanks!
03/13/2015 at 3:26 pm #18204ParticipantIs there an update on the ‘meta-strategy’ you are developing?
03/13/2015 at 9:51 pm #18208rfm12
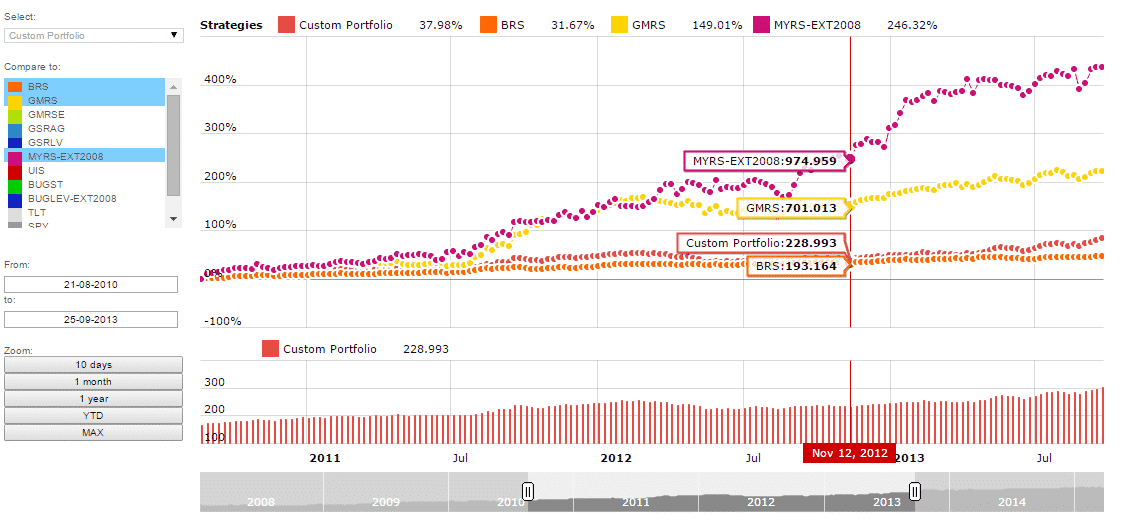
ParticipantHi,
In looking at the Return figures in the second table above, they seem to be substantially different from the ones on the individual strategy pages. For example, according to the table, the return for MYRS is 1957%, but according to the MYRS strategy page, it’s 488% since inception. In the table, GMRS is 954%, but on the GMRS page, it’s 4151%. In the table, GSRlv is 480%, but on the GSRlv page, it’s 395%. (I didn’t look at the others.) Could you clarify?
Thanks,
Ray Martin03/14/2015 at 2:30 am #18219KeymasterRay,
thanks for the great question, there are two explations. First the portfolio builder uses a base of 100 (to be able to show a log scale), while the strategy pages use base 0. See for example the Bond Rotation Strategy, showing 248 versus 148. Second, the portfolio builder uses a common start date of Jan 2008 due to different inception dates of the strategies. This is why for example the GMR shows only part of the overall history, thus less total return.
03/16/2015 at 8:51 am #18261Matt
ParticipantTo follow up this thought, the MYRS individual strategy page uses a start date of 1/3/2011, but the portfolio builder uses an MYRS start date of 1/1/2008. Where is the portfolio builder getting this extra data? It seems this data should be available in the individual strategy as well.
03/16/2015 at 11:00 am #18271KeymasterPortfolio Builder uses the long back test as it is historically aligned and restated to using the adaptive allocation approach. This that is what will be used going forward, we judge that to be more appropriate for future allocation decisions. The stand alone strategy pages/charts align to the strategies as they existed at the time for historical accuracy.
I hope that helps.
03/18/2015 at 6:56 am #18288KeymasterMatthew, see the ‘small print’ below the portfolio builder chart.. Before inception of MYRS in Jan 2011, we use GMRS data to extend the timeseries till Jan 2008. This is needed, as we want to show at least 7 years of simulation and include the 2008/09 financial crisis.
03/19/2015 at 2:46 pm #18388KeymasterMichael, sorry for making you wait with the meta-strategies. The concept is finished and we’re just working on finetuning the initial strategies we’ll publish and the presentation on the web-page. Should take another 2-3 weeks, hopefully..
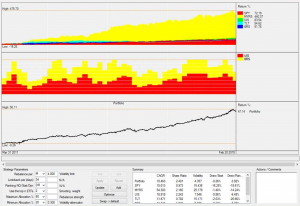
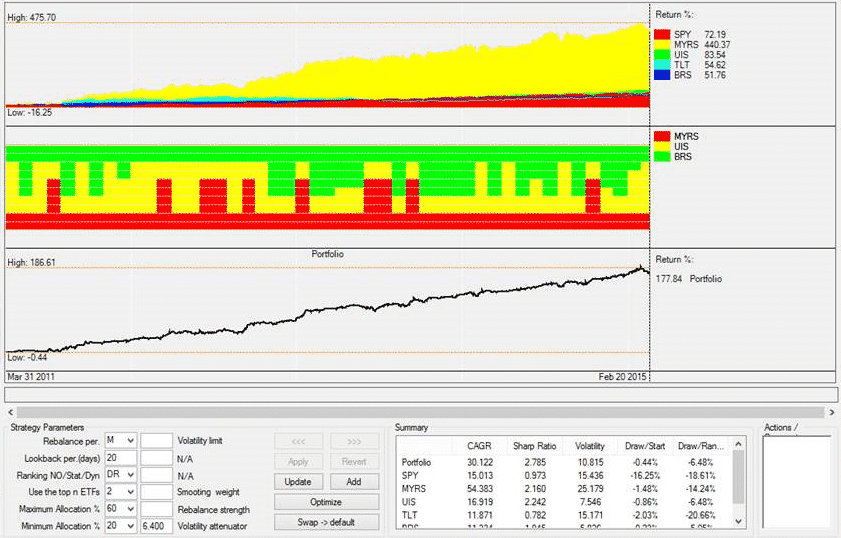
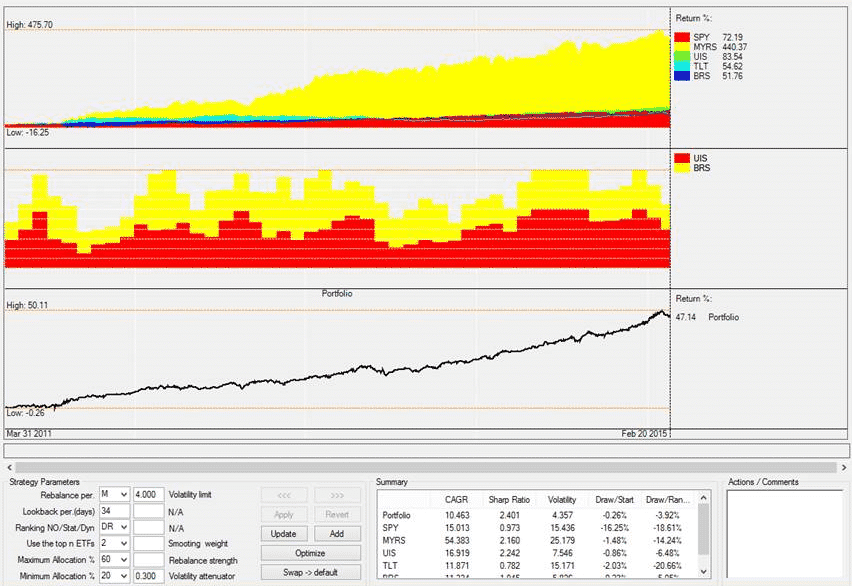
But in order to give you a preview, here (drum rolls please..) are some examples of what is possible with this concept. By no way the final versions, and need obviously longer backtest..
Look at the middle chart, which shows the dynamic allocations, and then the especially how nicely the sharpe ratio goes up. Click on images to expand.
Maximum Yield + Universal Investment + Bond Rotation:

Maximum Yield + Universal Investment:
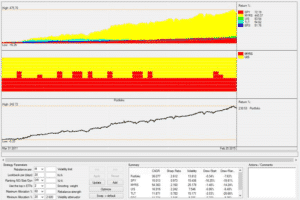
Universal Investment + Bond Rotation with a 4% (ultraconservative!!) volatility limit. See how the total exposure varies over time:
So, please give us some more time to finish up properly, but also let’s start the discussion of what you’d like to see in regard of blends and features.
03/20/2015 at 11:37 am #18405ParticipantI did some experimentation with the portfolio builder to see how it would handle leveraging UIS with SPXL and TMF as substitutes for SPY and TLT. To do so I simply multiplied the allocation by three. (Although 2.5 times might be more realistic.) So if one was invested equally in the unleveraged UIS plus three other strategies your allocation would be 25% for each totaling 100%. If UIS has three times leverage the allocation would be 75%,25%,25%,25% for 150% total allocation. The portfolio builder seems to give realistic numbers. Does this approach seem reasonable to you?
Michael K
03/20/2015 at 1:03 pm #18407KeymasterMichael, thanks for the f/up on the UIS SPXL/TMF version.
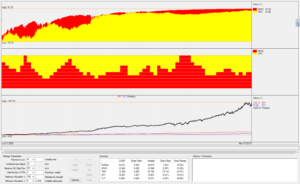
Due to the demand, we’ll launch this as addition to the plain ETF UIS, and I’ve built it into the next Portfolio Builder version we’re about to launch. Attached a screenshot of the UIS SPXL/TMF backtest, which also gives you a preview of the next portfolio builder.
Btw, I’m planning to send the draft portfolio builder in Excel to some interested beta-testers this weekend before launching on the site, if somebody is interested to jointly check, debug and improve pls drop me a line either here or through the Contact form.
 03/20/2015 at 2:18 pm #18409Participant
Thanks Alexander,
This looks like a tremendous enhancement to the Portfolio Builder. I can’t wait to see it in operation!
Mike K.
03/20/2015 at 2:23 pm #18410Timothy
ParticipantAlexander,
Looks great!
I’m using SPXS/TMV. How closely would this compare to SPXL/TMV?
Tim T
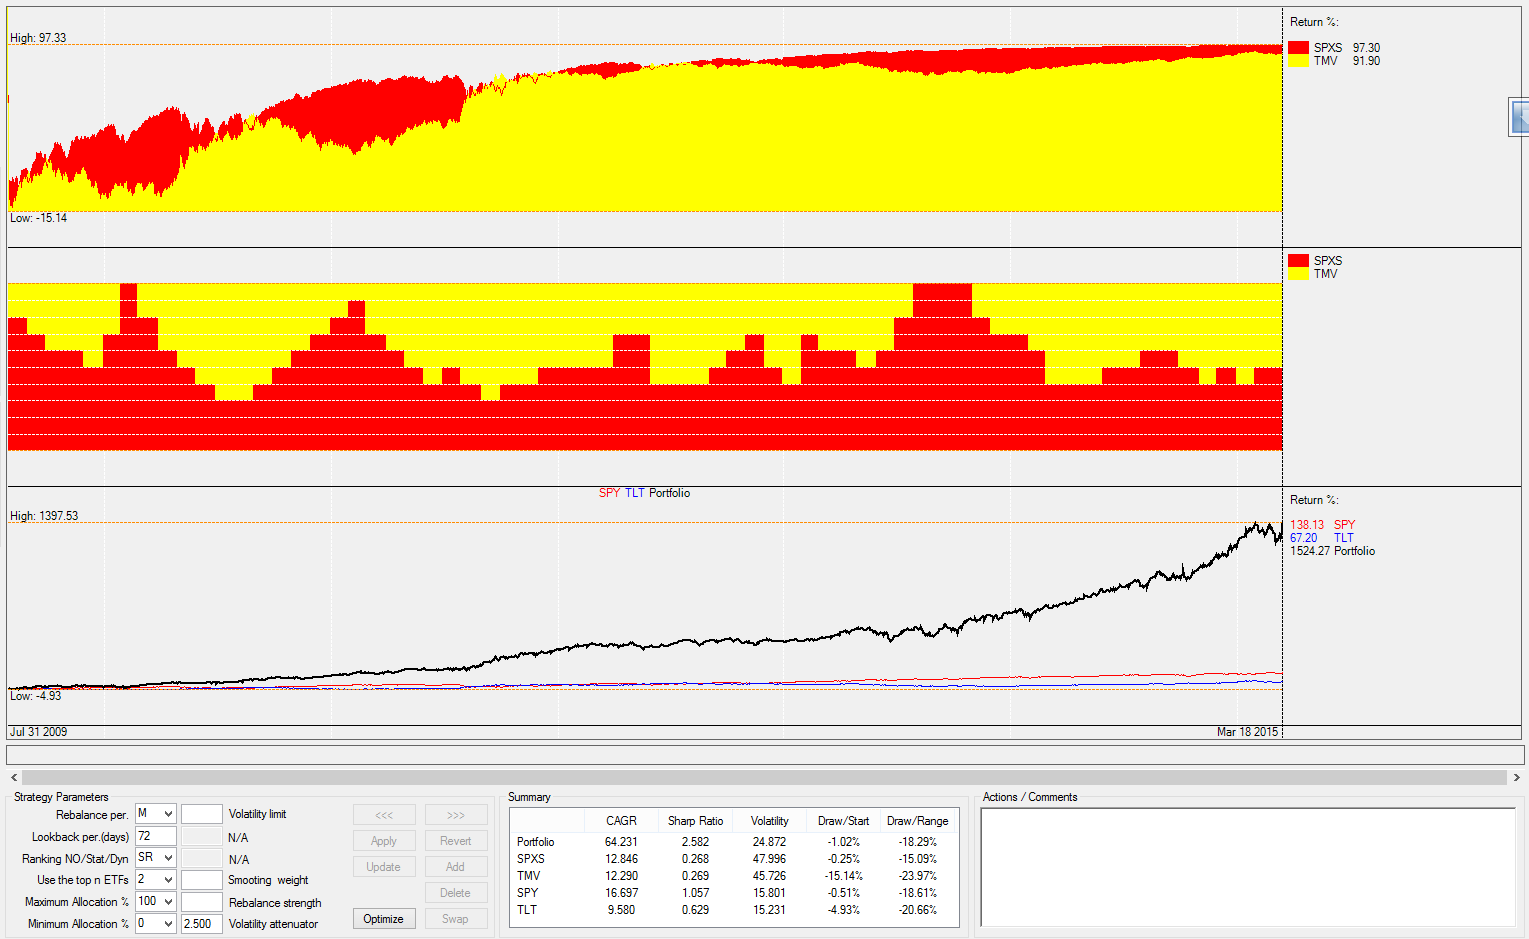
03/21/2015 at 12:13 am #18411KeymasterHi Tim, here a screenshot of the SPXS / TMV version, hope this helps. Very aggressive strategy, I would only use this as an additional ‘fun factor’ with a small share of my overall portfolio.
(click to enlarge)
 03/21/2015 at 8:41 am #18414Participant
I’m just trying to understand “very aggressive” – is it the strategy that is “very aggressive” or is it maybe (foolish) execution that would make it that?
If you have 5 LI strategies at 20% each with $100,000 ‘exposure’ in each and therefor only invest $33,333 in SPXS/TMV because it is 3x to get your $100,000 exposure (along with the rebalancing benefits of these etfs versus straight UIS) is that being “very aggressive”?
If I invested $100,000 instead of $33,333 when overall I only wanted $500,000 total exposure that would be very aggressive (aka stupid) for several reasons.
So I was thinking that the TMV/SPXL is less aggressive than the UIS SPY/TLT strategy for the same total exposure because of the rebalancing benefits (which exceed borrowing costs).
03/21/2015 at 9:32 am #18419KeymasterSam, yes this is what I meant. This strategy for my taste should only be let’s say a 5%-10% (x3 leverage = 15%/30%) of portfolio. Just my personal 2 cents..
Don’t forget that the backtest is only from Jul 2009 due to availability of ETF, not sure if I would have stuck to this strategy during 2008/09 crisis with a 3x leverage at a higher exposure. Agree that the rebalancing benefit is an argument for going short (if available at reasonable costs).
03/27/2015 at 11:10 pm #18710Derrick
ParticipantAlexander, The max drawdown for UIS-SPXL-TMF says -16.95%, but I assume it was probably 3x that amount? That DD looks like it is from the March 2009 date when data from the normal UIS was used. Does this then affect all the other data for UIS-SPXL-TMF – sharpe, volatility, etc.? When incorporated into a portfolio it will look like your are getting the returns of UIS-SPXL-TMF but with the risks of normal UIS at least in regards to 2008 type DD. If max DD were in the -50% range that would change things quite a bit. Am I understanding this correctly?
Thanks for all your work on this! It looks really good. I’m looking forward to the meta-strategy.
03/27/2015 at 11:27 pm #18713KeymasterThanks for the comment, actually just yesterday received a similar one, so let me expand.
Due to the late inception of the 3x leveraged ETF (TMF in April 2009), I extended the timeseries using standard UIS back to Jan 2008 to match the other strategies. We do the same for MYRS, but had properly explained, which I missed to do so far in the case of 3x UIS – now included. So the maxDD in 2008 of 16.95% is indeed from UIS, and applies also to 3x UIS due to the extension. I will extend by using synthetic TMF and SPXL data instead, this indeed is confusing.
Generally, the UIS SPXL-TMF version is interesting also from a different angle. Using the SPY-TLT signals and then executing with SPXL-TMF leads to inferior performance compared to running the signals directly for SPXL-TMF. This comes from the roll-loss of the leveraged ETF, where the daily leverage leads to tracking errors compared with the underlying ETF.
This – and the interest shown by you in the forum – led us to include the signals as a separate ‘version’, which we will make available shortly as part of the UIS subscription.
Also due to the roll-loss of the leveraged versions, I’m just exploring the best way to extend them back to at least 2002. I’m currently inclined to use a sum of squared differences approach, which you can see in the two excel files for SPXL and TMF. Happy to receive feedback on this approach.
03/29/2015 at 3:01 pm #18830InactiveCan you guys include a Max CAGR (non-levered and levered) not withstanding volatility. Then make one max cagr based on 20% and 25% volatility.
Pretty young investor, so I don’t mind the same volatility as the SP500.
03/29/2015 at 3:10 pm #18831Inactivealso, is there a way to have an option to “exclude” a certain strategy. IE if I wanted to exclude MYRS for example
03/29/2015 at 3:56 pm #18832KeymasterHi Jorr, thanks for your suggestion!
A MaxCaGR would just go 100% into Max Yield, so you can use that equity curve and leverage it by your needs.
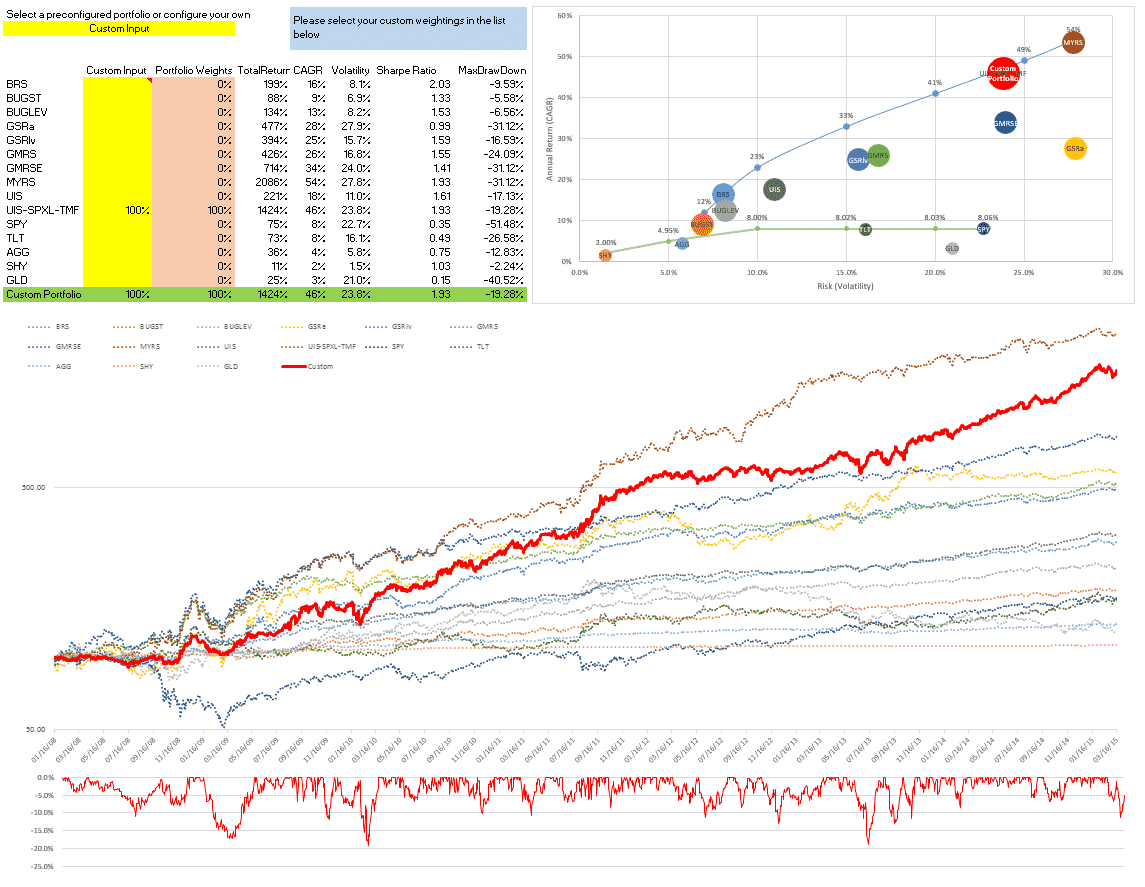
Have just included the MaxCAGR with 20% and 25% volatility constraint in the online version, seems you can stomach this – because the Drawdown is corresponding. Also, I’ve now included the UIS 3x leveraged version in the optimized solutions, we’re close to get this published. With this I also updated the ‘efficient frontier’ dots, you can nicely see the effect of including the 3x UIS.
For more advanced portfolio optimizations, please have a look at the ‘offline’ Excel version, there your can specify which strategy or market proxy to include, specify min/max weightings by strategy, put targets to minimize/maximize and put constraints in, and do a lot of other ‘magic’ with the Excel solver. This is still a first version, which runs fine on my computer, but might behave different depending on Excel and OS version, but anyhow, if you are a geek, this is what you need. Have a look at the forum thread, would be great to get your input to further develop this tool with you and other interested.
03/30/2015 at 6:32 pm #18868ParticipantI have a basic question when it comes to building a portfolio of strategies. If I were to allocated 25% to 4 different strategies, then a month later say 2 were up 10% and 2 were down 10%. Would I rebalance so that I begin each month with exactly 25% of the total in each of the strategies or run them as 4 independent strategies? For example in a 100K portfolio rebalancing monthly would make each 25K in month 2 but running independently it would be 27.5K in the 2 winners and 22.5K in the 2 losing strategies. Those 2 scenarios would produce very different results by the end of a year and especially at the end of multiple years.
Which scenario does the portfolio builder assume when looking at all the statistics like MaxDD, Sharpe, CAGR of my combined portfolio of strategies?
03/30/2015 at 7:45 pm #18870KeymasterVery good question, and actually not as trivial as your might think – one of the major considerations I had when launching this version based on weekly data – compared to the previously monthly.
The equity curves of the underlying strategies are based on monthly (bi-monthly for MYRS) rebalancing. When blending them together, I’m currently taking the easiest path – which is weekly rebalancing. In practical terms, the difference in results between weekly and monthly is neglectable – as the underlying strategies are rebalanced monthly and there the lower correlation between the different ETF would indeed cause larger differences (as we have seen in the MYRS recently, for example)
Using only yearly rebalancing, or even without any rebalancing would indeed lead to completely different and unrealistic results.
In future we’ll show you the ‘consolidated signals’ also at each month end – when the underlying strategies rebalance – but you will also see the daily changes in shares thereafter, in case you want to rebalance the overall portfolio more frequently, or trade later than the rebalancing date.
Hope this explains, happy to extend more.
03/31/2015 at 7:47 am #18893ParticipantCan someone confirm that this portfolio tool is working? It seems to be broken. I cannot get it to change any numbers when I select the various strategies, or when I do a custom portfolio. I always shows the same allocation in the results. I’ve tried different browsers and also tried the google doc directly and seems to have the same problem.
03/31/2015 at 8:54 am #18899KeymasterMatt, thanks for the hint, back working again. Overwrote a field in an update yesterday night.
03/31/2015 at 10:13 am #18910STEPHEN
ParticipantMatt, I had the same issue, sent them a message.
03/31/2015 at 2:17 pm #18912ParticipantThanks Alexander, this is what I thought. I’m just trying to wrap my mind around the implications. So in essence when I run a portfolio of strategies this way the individual performance of each strategy will be different than it would have been if run independently. By taking funds from the winning strategies and adding funds to the losing strategies each month an extended time of over-performance by one strategy along with under-performance of another strategy will be more detrimental to the portfolio than if they were run independently. However if the strategies tend to mean revert at different times then the blending of strategies could produce superior results. Am I understanding this dynamic correctly? Do you have any books or articles you would recommend to further understand these concepts?
Also, if MYRS is in the portfolio it’s not practical to rebalance just that strategy in relation to the other strategies bi-monthly. Though I can’t imagine this affects the results too significantly except in periods of extreme volatility. For the portfolio tool you created do you assume MYRS only rebalances with the rest of the portfolio monthly?
Thank you for your patience in answering my questions.
03/31/2015 at 8:53 pm #18918KeymasterYes, you are correct. This periodic rebalancing – to keep stable fixed weights – means you add to the lagers taking from the top-performers. I have no particular article about this in mind, but generally there is a lot on rebalancing portfolios on the web – one of the items MPT academics most love.
On MYRS maybe I did not properly explain myself. In Jan – Feb this year the enormous jumps in volatility (ZIV) and fixed income (EDV) would have caused a big divergence between rebalancing the strategy itself monthly, bi-monthly, weekly or even daily. We use bi-weekly just because of these volatility jumps, e.g. to be more reactive compared to the other monthly strategies. Now, with this periodic rebalancing at the strategy level being in place already, the effect of changing the rebalancing period at the portfolio becomes less significant.
Now, what about reverting this – adding to the leaders, taking from the lagers, e.g. a ‘trend-following approach? This is exactly what we’re about to finish and publish – our (long-teased) Meta-Strategies. Main argument for ourselves is that strategies might outperform or contrary stop working in different market environments – and you nicely see this even in the 2008-2015 period in the charts. So we dynamically allocate more to the leaders, and even might not allocate anything to a (relatively) underperforming strategy. You can see some preliminary ideas in the post above.
04/01/2015 at 5:08 pm #19025Greg
ParticipantHI LI; Greatly anticipating the MetaStrategy and targeted volatility calc. Regarding the portfolio optimizer that looks back to 2008. Several of the LI strategies (MYRS, GMRE) have changed from top picks to a sharpe optmized pair. Also the UIS strategy goes through the same variation with time with a sharpe optimization. I assume the archived data on the portfolio optimizer incorporates these changes over time ?
Cheers, Greg04/01/2015 at 7:19 pm #19027KeymasterGreg, yes, based on several suggestions the equity lines in the Portfolio Builder show the ‘adaptive allocations’ in GMRS, MYRS and BRS.
In contrast, on the charts of the individual strategy pages we highlight when these new algorithms were introduced, and show the allocations a long time follower would have been invested in, so kind of ‘fixed’ history.
04/02/2015 at 11:46 am #19072ParticipantHi Guys! How difficult would it be to add a time slider to the bottom of the portfolio builder graph results above, like you have on the individual strategy pages? That way we could slide time around, zoom in, and see how the portfolio did during certain times, as opposed to just seeing the big picture. Thanks.
04/02/2015 at 12:06 pm #19073KeymasterMatt, do your mean like this? Slicing and dicing on the timescale and then getting CAGR,Volatility, Sharpe, etc for the selected timeframe?

Stay tuned for the infamous ‘Gold Version’… :-)
05/31/2015 at 2:20 pm #24886Tapan
ParticipantThere is an error in the Custom Input option at the top table:
1. Select Custom input
2. Enter a number for BRS strategy
3. Same number appears for BUGST strategy in the bottom table where it calculates volatility, drawdowns etc..Please check…
Please also add the World Top 4 strategy when possible.
Thanks
05/31/2015 at 8:00 pm #24932KeymasterHi Tapan, thanks for the hint! Found and corrected it. Can´t protect the sheet enough, there is always someone who finds a new way to overwrite a cell unwillingly :-) Sorry for that!
06/01/2015 at 12:51 am #24950Harvey
ParticipantHi:
Clueless Newbie here. Do you have any examples of how to use your UIS strategies with options?
You mention selling OTM puts, but I don’t see how they would participate significantly in moves of the underlying.
My first inclination would have been to buy deep ITM calls to take advantage of changes in intrinsic value.
So, I’d like to see some examples of how you do it.
06/01/2015 at 3:23 am #24959Supal Patel
ParticipantAny plan to update this tool to include newly introduced top 4 countries strategy?
06/28/2015 at 3:08 pm #27535ParticipantIs there an update on the ‘meta-strategies’?
07/02/2015 at 4:03 pm #27858ParticipantHi, World Top 4 is missing in the column of Consolidated Portfolio worksheet – it was there last month. Could you please check? Thanks.
07/02/2015 at 9:46 pm #27860KeymasterWill be back up shortly; sorry for delay.
It will be here https://logical-invest.com/blog/strategy-signals-consolidated/07/07/2015 at 10:04 pm #28021ParticipantHi, World Top 4 is missing in the column of Consolidated Portfolio worksheet – it was there last month. Could you please check? Thanks.
07/21/2015 at 1:30 pm #28331Sentient
ParticipantGreetings! I am a new subscriber and this is my first post. I am curious to hear other opinions on strategy selection/mix going forward if we expect lower returns from US equities over the next few years and believe that the long bull market in bonds is coming to an end. Let me try to formalize the question as follows:
THESIS: The post-crisis rally in U.S. equities has run far and long, and we should expect lower returns for the next several years. In addition, it is difficult to imagine that bond yields will continue to decline during this period.
QUESTION: Which strategies might be expected to perform best in this type of expected market conditions?
I list below the strategies that I prefer given the thesis above, but am very interested to hear the opinions of others.
MYRS: In a sideways or slowly grinding market, the VIX futures should remain in a state of contango and we can still capitalize on the monthly roll yield.
Top 4 World: If the U.S. Stock market under-performs over the next few years, perhaps it will pass the baton to some other country or countries.
Global Market Rotation: Similar argument as Top 4 World strategy.
Global Sector Rotation: In any sideways market, one can usually find individual sectors that out-perform.
Any thoughts?
08/02/2015 at 3:05 pm #28716Richard
ParticipantHello,
Once again excellent work and a most helpful tool.
Another suggestion: Include a date slider on the plot for the “built” portfolio like is provided on the individual strategies, and also present the stats for the date period selected.
Thanks.
08/09/2015 at 9:25 am #28830KeymasterHarvey,
we generally do not recommend using our strategies with options, and therefore do not provide details guidance for it. Main reason is the additional complexity in running backtests with option chains, which would be needed to verify the results.
08/09/2015 at 9:30 am #28831KeymasterSupal,
the World Top 4 Strategy is now included in both online and offline Portfolio Builder, see here
We decided not to include it in the beta signal consolidation sheet, as it would add another 40 ETF to the already long list. We´re still working on a better consolidating mechanism.
08/09/2015 at 9:32 am #28832KeymasterHi Tapan,
sorry for the delay in my response. We decided not to include the World Top 4 Strategy in the beta signal consolidation sheet, as it would add another 40 ETF to the already long list, and make the sheet bearly workable. We´re still working on a better consolidating mechanism and will come back soon.
08/09/2015 at 9:43 am #28833KeymasterHi Sentient,
thanks for the excellent post and detailed questions, which I answer on bold below:
THESIS: The post-crisis rally in U.S. equities has run far and long, and we should expect lower returns for the next several years. In addition, it is difficult to imagine that bond yields will continue to decline during this period.
–> We choose bonds as “crash correction” not because of their current absolute pricing or performance, but we expect them to be the safe heaven of choice in any major market turmoil – independent on how they are priced immediately before. In this sense, we do not bet on pricing before or after a rate hike.
QUESTION: Which strategies might be expected to perform best in this type of expected market conditions?
–> We have noticed this year that the bull market has flattened out in 2015, and major markets are going sideways – while stress signals come from commodities and some overseas equity markets. Hard to predict where this will go, therefore we just do not try to predict, but remain invested in a broad portfolio of strategies.
I list below the strategies that I prefer given the thesis above, but am very interested to hear the opinions of others.
MYRS: In a sideways or slowly grinding market, the VIX futures should remain in a state of contango and we can still capitalize on the monthly roll yield.
–> Yes, but you can see the contango to go down since 2011, e.g. performance boost from inverted volatility being reduced recently.
Top 4 World: If the U.S. Stock market under-performs over the next few years, perhaps it will pass the baton to some other country or countries.
Global Market Rotation: Similar argument as Top 4 World strategy.
Global Sector Rotation: In any sideways market, one can usually find individual sectors that out-perform.
–> On the three above: Yes, our effort is to make different investment options available that should work in any market environment. Choosing a broad portfolio of strategies using our Portfolio Builder should provide the best setup for stable results with reduced volatility.
As you raised some rather broad and deep questions, I would be very interestes to see comments from other followers also. If needed let’s open a different forum topic on this.
All the best,
Alex08/09/2015 at 9:44 am #28834KeymasterRichard, thanks for the excellent suggestion, will add it to our list for developments.
09/05/2015 at 2:15 pm #29448ParticipantHi,
Any update on the “Infamous Gold Version”? Looking forward to it!
Thanks.
09/20/2015 at 1:51 pm #29635KeymasterRichard, sorry for the delay, but we’ve not been able to get to a stable version yet – but continue the development.
12/23/2015 at 11:40 am #30968ParticipantHello Alex,
I am still interested in seeing the NASDAQ 100 Meta included in the “Portfolio Builder”.
06/21/2017 at 6:49 am #42778KeymasterWe´ll include the newly launched US Sector Rotation Strategy in both the online and offline version towards the end of June.
08/19/2018 at 1:00 pm #54505chichucha123
ParticipantHi, I see Alexander that you said in a comment (years ago, heh!):
“Using the SPY-TLT signals and then executing with SPXL-TMF leads to inferior performance compared to running the signals directly for SPXL-TMF. This comes from the roll-loss of the leveraged ETF, where the daily leverage leads to tracking errors compared with the underlying ETF.”
I guess that shorting -3x would give better results than going long using directly the 3x UIS strategy. I’d like to use the strategy that performs better, so: Should I short the SPXS & TMV using the SPY-TLT signals from the UIS strategy, or should I short SPXS & TMV using the SPXL-TMF signals from the 3x UIS strategy? Which approach would give the better results?
08/19/2018 at 6:35 pm #54508KeymasterThe best is to use our QuantTrader app, there we have all three UIS strategies (simple long, 3x long, 3x short) and the signals vary among them as stated.
Download QuantTrader from here, then log-in with the web credentials.
08/12/2019 at 4:23 am #68964KeymasterWe’re reopening this thread to improve the structure of the forum
09/07/2019 at 11:47 am #70277R D HATHCOCK
ParticipantI belong to another service on Seeking Alpha and have recommended UIS 3x to other members; I sent them your link, etc. The service recommends 3x funds of all kinds on a weekly basis, and sometimes has long stocks like TECL/SOXL together with UGLD and/or TMF. But they are not managed in the hedge, max sharpe, fashion that LI does.
I use QT to determine the proper hedge.
09/08/2019 at 1:27 pm #70340KeymasterThanks for the referral RD, very kind of you! We could certainly also do a more aggressive UIS picking individual sectors with leveraged ETF like TECL/SOXL, did you try already in QuantTrader?
09/09/2019 at 9:59 am #70359ParticipantYes, I have built them into QT, but I keep my models simple and don’t use the mean reversion/etc. that you guys use on SPXL. So, a strategy that you guys develop would be much better than mine. Since QQQ is used in your US market, you could also develop a TQQQ/Hedge.
09/09/2019 at 10:08 am #70360ParticipantLet me add that these are quite volatile, like MYRS, and probably need to be a semimonthly trade instead of monthly.
01/26/2021 at 11:10 am #81190benjaminhall
ParticipantHi there,
Not sure if this is the right forum, however I would appreciate if someone from the LogicalInvest team could answer the following questions for me regarding the NASDAQ100 strategy:
Excluding the hedging components of the system:
1. What is the probability of a winning trade?
2. What is the average % gain for each winning trade?
3. What is the average maximum drawdown for each winning trades?
4. What is the average % loss for each losing trade?
5. What is the average maximum drawdown for each losing trades?Many thanks!
01/29/2021 at 12:08 pm #81217KeymasterSorry, we don’t provide the statistics you mentioned. We focus on strategy and portfolio’s overall return, volatility and drawdown.
- AuthorPosts


- You must be logged in to reply to this topic.