Forum Replies Created
- AuthorPosts
- 05/02/2021 at 12:22 pm in reply to: Newsletter Strategy Performances for the month doesn’t match Strategy pages #81754
Alex @ Logical Invest
KeymasterHello Rob,
thanks, you are obviously right, seems we had a problem in the monthly newsletter preparation. The 3.8% for the EPP and 5.5% for the US Market 2x from the strategy page are the right values.
Sorry for the bug, we’re going to update the batch job to avoid such issues in the future.
KeymasterThanks for the detailed update, Richard. Indeed especially after manual changes the list of symbols and strategies can get out of sync. You can also always download a fresh set from our server, and then just copy any own strategies into the /ini folder. This probably is easier and faster than modifying the strategies.
Here the last update: https://logical-invest.com/quanttrader/QuantTrader528SDec2020.zip
KeymasterThe allocations and underlying prices in the performance computations are based on the close of the month. This is a simplification, so we can send you the signals for the next month and at the same time the performance of the last month. Obviously if you use our email or web service you can only trade after receiving the signals, so earliest at the open of the first day of the new month.
If you use QuantTrader you can trade before or at the close of the month, and also simulate the delayed trading day, or even pick a different day of the month to do the trading, and add a % fee for trading costs and slippage.
But to keep the email and web service as easy as possible, we decided to use end-of-month pricing for reporting performances. In our experience the deviations in the performance should be minimum, and very often balance out over the months. We therefore do not see an added benefit of trading at month end, but want to offer the possibility.
Hope that clarifies
01/24/2021 at 9:54 am in reply to: How do you synthesize prices prior to stock/etf inception date? #81175KeymasterFor many ETF you can use mutual funds, or the underlying index data. Basically you extend the ETF price history by subtracting the returns of the proxy going backward. For example for GLD you could use London gold index, for SPY the SPX index, for bonds there are many Vanguard mutual funds going back to the 80’s. That’s what we do actually for extending some of the tickers.
For example:
ETF last price on date x: 20$
Return of proxy on date x-1: 0.2%
Then ETF price on date x-1 = 20$ / (1 + 0.2%) = 19.96$
… and so on.If you want to extend leveraged ETF by unleveraged ETF then you need to put a “return multiplier” in. For example for extending TMF with ETF data: TMF price x-1 = TMF price x / (1 + TLT return * multiplier)
For a couple of ETF you can do that in Excel and then paste or save into a csv file as our ETF.csv files. For more you would need a script.
KeymasterAs said before, during your exploration of the ranking process you will see the necessity for normalizing certain computations in order to make the ranking work as expected.
It is important for us to be transparent in how the methodology works – and most importantly: That it works! But we’re not publishing the computation in detail, at the end this is not an “open source” project – and would it make no fun to try to replicate.
You will probably find even a smarter way, just give it a try. If you want to mimic exactly our process look at the values in the ranking log, there is all you need:
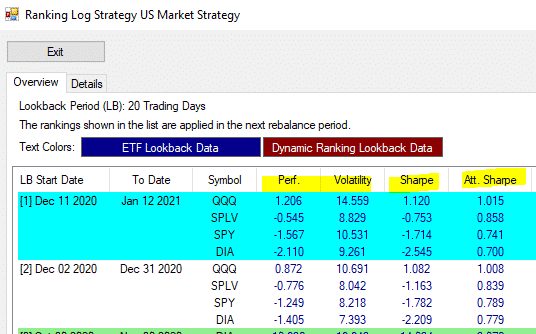 Keymaster
Hi HP,
while above indeed is in concept how the ranking works, you will find some caveats during the validation of your own model. These require some normalization before we can rank by the “modified sharpe”. We do not publish these steps in detail – just to keep the fun factor of reproducing the model, the same as we love the thrive when replicating other models.
But QT gives you all you need, just have a close look at the values in the different cols in the “ranking report”, there is all you need for a rainy weekend. Several users have successfully reverse engineered the model, which as great as we used their input to further improve it.
KeymasterActually we have that data in our API. One of our best-kept secrets, but probably this is something we need to release and document for our “power users”. And hey, maybe a bit of “LI XMas feeling” is good in these times:
If you’re logged in and paste this into your browser this should work:
https://logical-invest.com/app/api/GetDailyData.php?symbol=BRS&dataType=consolidated&fromDate=2018-07-01
https://logical-invest.com/app/api/GetDailyData.php?symbol=BRS&dataType=returns&fromDate=2018-07-01And “all in one”, albeit in json format, which is not so easy to digest in Excel:
https://logical-invest.com/app/api/GetAssetChartData.php?symbol=Aggressive
KeymasterWell, so let’s get it alive & kicking again – anyhow at least here in Europe not much else to do in these days :-)
KeymasterHi hiker360,
Mark has put it very nicely: The optimization is all about finding a stable parameter range, where you have a statistically higher edge of realizing the past performance – in contrast to picking unstable “single” parameters values which will lead to curve fitting.
Once you have developed a strategy with a stable parameter range a new optimization a month or several months later should reconfirm the same parameter range – and serve as a validation. So that’s rather helpful.
But if your strategy itself is not leading to a stable parameter range and you optimize monthly picking “the best” parameters you’re cheating yourself into curve fitting and will get disappointed.
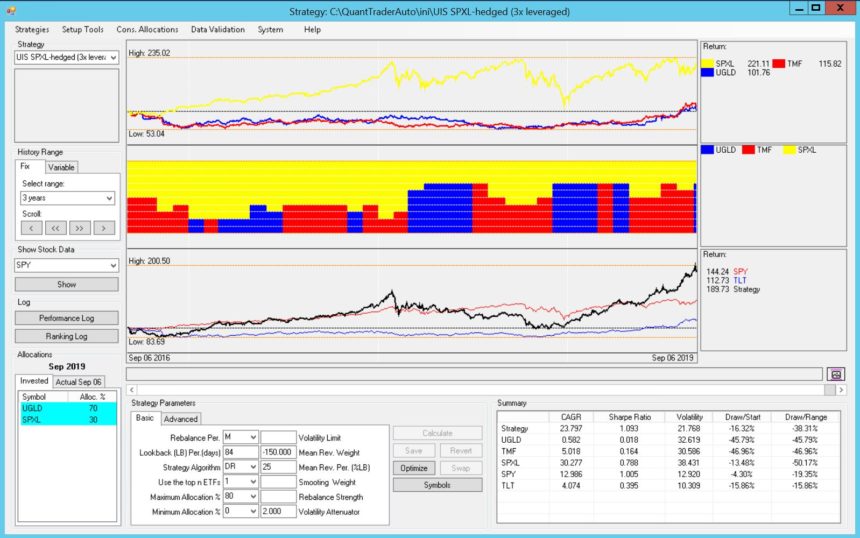
To illustrate using UIS SPY- Hedged, the strategy Mark has referred to:
- You see the stable range of parameter values all leading to similar outcomes, probably the range of volatility attenuator of 1-2 and the lookback between 150 and 190 days.
- In red “the best parameter pair” QT highlights automatically, volatility attenuator of 1 and the lookback of 156 days.
- Black mark by me indicating the volatility attenuator of 1.5 and the lookback of 180 days the strategy uses.
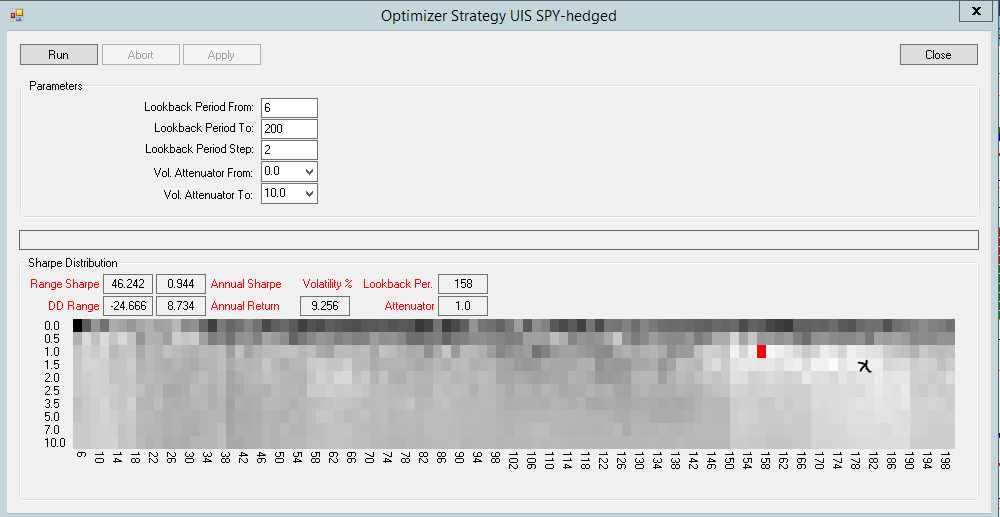
This optimization is for 20 years, so covering many incidents, but you see there is still this very marked stable range. If you would do the optimization for a shorter period like 5 years probably you find even better parameter pairs, but this would cover only the recent “straight-line” bull market (with a COVID dip in 2020). If you now repeat this optimization every month from now pretty sure you will find the same stable range – which serves as a confirmation.
12/01/2020 at 7:42 am in reply to: Web site allocation does not seem to match that of Quant Trader? #80735KeymasterHi Nelson,
we only rebalance after all dividends and split are accounted in close-prices, that’s around 6 am EST on the 1st of the months, so about an hour and half ago. In QuantTrader you can also run the signals without these dividend adjustments, as you probably did, but that won’t give you any meaningful results – nor will it match with the web-app. If you check now you will see everything matches.
KeymasterWe’re aware of the risk involving leveraged ETF in our portfolios, and had long discussions over the last months how much use to give them. For the time being we’ve excluded them from the conservative and moderate Core Portfolios, but opted to leave them in the “general purpose” portfolios in the library.
For a 30 years old investor with a solid income from his day-job the risk perception is completely different than for a 65+ investor who is living off the investment income. We cannot and do not want to “advise” for individual life circumstances, but rather offer a choice of “pre-canned” portfolios and tools to assess the own risk preference and adapt the portfolio to it.
So our intention with these portfolios really is to offer them as a base for modifying them into a “custom portfolio” based on the individual risk/return preference. We’ve outlined that process and the available tools in this recent post: https://logical-invest.com/creating-a-custom-portfolio/
.. back to your question: “Is it just the 3x leveraged ETFs than one should be extra careful with?” Well, it depends on your net worth, income, years to retirement and most importantly: how much volatility your gut can handle. Try the portfolio optimizer, “ride” some equity curves over stressful periods, and try to get a feeling where your individual risk/return level is.
KeymasterSee guest post version here: https://logical-invest.com/modified-permanent-portfolio-mpp/
We’ll post the ini files there, please post comments also there.
KeymasterHi Jeff,
Use the consolidated signals to create the portfolio signals, just input the %s by strategy:
You find the % allocation at strategy level on the portfolio page in the app, or inspire yourself and try others.
See here for more ideas: https://logical-invest.com/creating-a-custom-portfolio/
09/15/2020 at 5:45 am in reply to: Could you add SLV ETF and commodity Gold and Silver to the Portfolio Builder? #80078KeymasterI just added SLV to the ETF list, and also the symbol to the names, much easier to find.
KeymasterHi Nelson,
we’re aware that the changes in the defalt strategies have caused some confusions, we did these in response to several requests and in a best effort, but finally recognize we thereby affected other subscribers who were just fine with the previous.
To your question:
1) If you subscribe to one of the default portfolio with the “set as my portfolio” option [star icon], then any change we do in the strategy allocations (as last months) will be reflected also in your portfolio. So it’s like a “clone”.
2) If you choose to build or optimize a custom portfolio, or use “modify as my portfolio” [pencil icon] then the allocations chosen by you will not be changed – they are not linked to any of the default portfolios.
In your case it seems that you’ve build a custom portfolio (2), so there should not be any change. Pls send me an email if you need any help with this portfolio: alex at logical-invest.com
We really think the default portfolios as a starting point for building custom portfolios, rather then “off the shelf” solutions, this was also the motivation to recap the process in this post: Creating a custom portfolio
KeymasterYes, see here how it works: https://logical-invest.com/walk-forward-testing-avoid-curve-fitting-backtesting/
This feature is still work in process, but we’re actively using it.
KeymasterUse the consolidated signals to create the portfolio signals, just input the %s by strategy:
KeymasterYes, here a quick post & videos with three ways to return to the august versions, or even better: Your own custom portfolio: https://logical-invest.com/creating-a-custom-portfolio/
08/31/2020 at 9:03 am in reply to: Can the quant trader consolidated allocation be downloaded to excels? #79923KeymasterHi R D,
yes, to copy the consolidated allocations for pasting into Excel or a text editor simply keep the left mouse button pressed while marking the table, then CTRL+C to copy and CTLR+V to paste, see below
 Keymaster
Hi Jeff,
like your process, very thoughtful! When you run Quanttrader it spits out a detailed allocation and performance report for each strategy in /data folder, these time series should be useful for your analysis, probably can import the csv into your own program
For a macro view you can also use the “performance log” and “ranking log” available from the backtest window, see here: https://logical-invest.com/quanttrader-application/portfolio-backtesting-builder-main-windows/
KeymasterHi Ben,
no, currently you can’t constrain the MaxDD in QuantTrader. But in the advanced parameters you can put a limit on volatility, so that QT limits the allocation to the strategy and puts the rest in “cash”.
Also please note that the MaxDD refers to a single event in the past, it is not really a metric of the “riskiness” of a strategy. Volatility is a much better metric for the overall variability, and therefore the probability of a mayor drawdown.
KeymasterHi Stefan,
yes, indeed the question of how to glue the parameter results from the different data chunks together is interesting. Some use moving averages, others set limits for the max change of parameters between data chunks.
We’ve done walk-forward testing also in other tools like quantshare and amibroker. The problem often is the increasing complexity which causes you to get lost in academic exercises on how to best massage the data, rather than the fundamental question on how to get to a robust and simple system.
In my very personal experience very often taking an educated guess or rough ballpark estimation of a stable parameter range looking at a heatmap of backtest outcome gives the best results. Validating these with more sophisticated tests gives more confidence – even if this sounds like inverting the process.
KeymasterHi Stefan,
the OOS testing is still work in process, but we’re actively using it. See here: https://logical-invest.com/walk-forward-testing-avoid-curve-fitting-backtesting/
KeymasterUVXY is linked to the 1.5 x S&P 500 VIX Short-Term Futures Index, so like being long VIX 1-3 mo futures.
That will work well in troubled times when VIX spikes, but on a long run it permanently loses value due to the Contango in the VIX futures curve. See: https://finance.yahoo.com/chart/UVXY
If you set it up as a permanent mix-in with a fixed % it may work well as a hedge, but eat some of the expected returns.
08/18/2020 at 10:44 am in reply to: UBT and QLD not showing reporting right this morning on different platforms #79811KeymasterThere were splits executed today, probably not yet properly reported in all apps:
https://www.businesswire.com/news/home/20200804005709/en/ProShares-Announces-ETF-Share-Splits
KeymasterSee here:
 Keymaster
Hi Jeffrey,
yes, seems I deleted your question by accident, and also my reply :-)
Here again: You can use the Consolidated Signals Window in QuantTrader to replicate the portfolios. Just copy the %’s per strategy which you find in the respective portfolios in the web-app – or try with your own. See below:
KeymasterHere also the allocations of the previous portfolio versions at the strategy level:
Conservative:
BUG: 24
NAS100: 40
DOW30: 36Moderate:
NAS100: 50
USMarket: 10
DOW30: 40Aggressive:
NAS100: 55
UISx3: 15
DOW30: 30If you click on the “pencil” icon of any portfolio you can update the strategies and %’s and save as your custom portfolio. Or use the Portfolio Optimizer to see several variations and pick your preferred one based on risk/return or other preferences.
KeymasterHere the allocations of the previous portfolio versions at the strategy level:
Conservative:
BUG: 24
NAS100: 40
DOW30: 36Moderate:
NAS100: 50
USMarket: 10
DOW30: 40Aggressive:
NAS100: 55
UISx3: 15
DOW30: 30If you click on the “pencil” icon of any portfolio you can update the strategies and %’s and save as your custom portfolio. Or use the Portfolio Optimizer to see several variations and pick your preferred one based on risk/return or other preferences.
KeymasterHi Robert,
thanks for the feedback, we are just analysing the pro’s and con’s of the different approaches. I want to highlight again that the default portfolios are thought as a starting point for building your own personalized portfolio. You can do so by clicking on the “pencil” icon on any portfolio detail view (example Aggressive Portfolio), or by using our Portfolio Builder or Portfolio Optimizer.
In theory we could publish many additional versions of each of the “pre-canned” portfolios, but feel this might rather make it harder to select. So we think the better approach is to let user pick a “close-to-perfect” portfolio, and then fine-tune it with the tools we offer.
KeymasterHi James,
we always use month-end-close prices, so 31st of July. The performance is compared also to the last month-end, so June 30st.
KeymasterWell, maybe not exactly 2x due to the way the leveraged ETF are calculated, but probably 1.8. You can give it a try in QT, just change the tickers in the PP. Send me an email if you need access to QT Premium, happy to do a barter trade :-)
KeymasterThey are already in QuantTrader, it should prompt you to update. Or just download the last version from here.
KeymasterHi Nelson,
there is no better alternative to UBT as a 2x leveraged ETF. But if you can use account margin then just buy 2 times the USD amount of TLT, which is by far the most liquid with close to 9 million shares a day and 20b USD AUM.
In general terms, if you can use account margin that’s always better than buying leveraged ETF. Due to the way they are constructed you are in risk of lagging in performance.
KeymasterHi Benjamin,
I’d suggest you try our Portfolio Optimizer to find a personalized portfolio which suits your risk/return preference. It will give you a list of options depending on the input variables you set, and you can then review the metrics, and the equity curves by clicking on the “magnifying glasses”.
This is also a good exercise to get comfortable with the different strategies, understand how they work, and which are better suited for you.
See the screenshot below where I input the strategies which made up the old Aggressive Portfolio, you can see that you can achieve very similar setups, but with much more flexibility.
Best,
Alex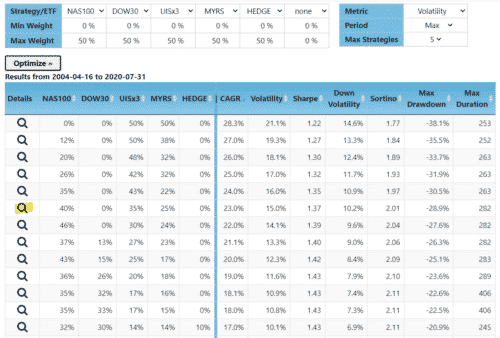 08/02/2020 at 12:18 pm in reply to: What is the Unleveraged Allocation for 3XUIS for August 2020? #79595Keymaster
Hello RB,
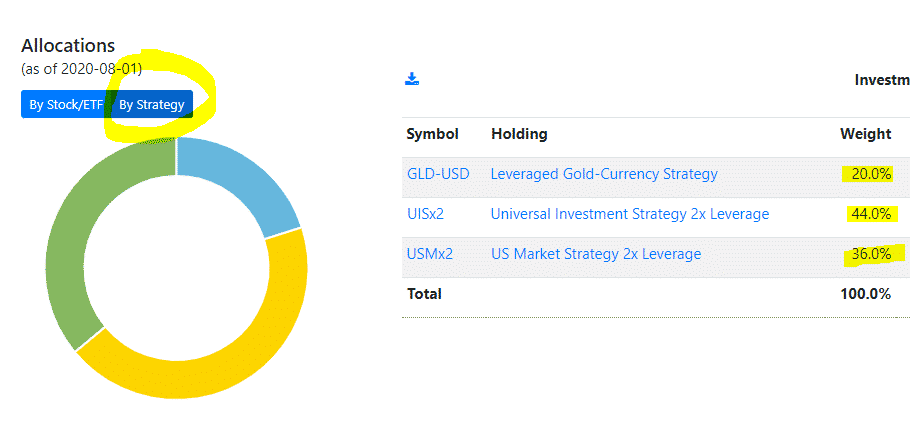
we just launched a new 2 times leveraged UIS, which uses UGL, so does not require any manual adjustment. See the introduction post here: https://logical-invest.com/ziv-ugld-delisting-new-strategy-portfolio-optimization/
And the strategy: https://logical-invest.com/app/strategy/uisx2/universal-investment-strategy-2x-leverage
KeymasterUUP is a long USD exposure, so for USD based investors it’s like being in cash, and we prefer GSY as it offers some return, see comment above.
KeymasterKeymasterThe historical data set is the real history as-invested by somebody who followed the strategy.
KeymasterWow, like the title of the thread :-)
Actually since 2013 I’m a big fan of their blog “Gestaltu” and their Adaptive Asset Allocation AAA. Great introduction to tactical asset allocation. Here the paper: https://www.investresolve.com/inc/uploads/pdf/Adaptive-Asset-Allocation-Whitepaper.pdf And blog, especially this post series: https://www.gestaltu.com/2013/05/dynamic-asset-allocation-for-practitioners-part-1-the-many-faces-of-momentum-2.html/
KeymasterYes, the backtest always is based on the most recent version of the model, all changes included: https://logical-invest.com/app/portfolio/conservative/conservative-risk-portfolio
We also have a “historic data set”, which is updated “as-invested”, which means any change to the model is only applied going forward, while history is frozen: https://logical-invest.com/app/historical/Conservative! (requires log-in)
KeymasterNot sure if I get the question right, if not please let me know:
– The Nasdaq 100 strategy ranks and picks the Top 4 stocks from the NASDAQ 100 index: https://logical-invest.com/app/strategy/nas100
– The Dow 30 strategy ranks and picks the Top 4 stocks from the Dow 30 index: https://logical-invest.com/app/strategy/dow30KeymasterSee comments here re SVXY.
07/01/2020 at 9:07 am in reply to: New allocations for Aggressive Portfolio total to 115.2% instead of 100% #79263KeymasterPlease see this post for the explanation and ways forward: https://logical-invest.com/strategy-changes-due-to-delisting-of-ziv-and-ugld-as-of-july-2020/
Hope this helps,
Best,
AlexKeymasterThere used to be a rather significant bias towards the end of the month due to institutional rebalancing, but last time we checked that was only marginal. So the day of the month does not really matter, as long as you pick one and stick to it – we still prefer the last day or the first day of the month.
KeymasterWe’re currently looking at the different options and going to post a note over the weekend – in advance of the next rebalancing.
KeymasterYou can use our desktop app QuantTrader, where you can cut signals on any day, and even intraday before close.
See here: https://logical-invest.com/quanttrader-to-cut-signals/
KeymasterPlease use the contact form in future, that allows us to follow up faster. You find the 49$ plan here.
We’re a virtual group with 4 partners in 4 countries – and feel everything runs quite well, but thanks for the feedback :-)
KeymasterAll statistics are calculated with daily data, so EOD. The MaxDD is the true daily drawdown, not the “realized” which only takes rebalance days into account.
KeymasterWe use EODhistoricalData (EOD) for everything displayed on the web, Tiingo is a fallback solution, Yahoo sadly does not provide dividend adjusted data. If you select the intraday option it is also EOD.
KeymasterIt works the other way around. We design and create our strategies in QuantTrader, then display them on the web-app. We changed the naming on the web-app slighly to make it easier to understand, with some years of experience you’ll get use to the LI slang :-)
KeymasterUse the main strategy, which is “Balanced with hedge”, the others are the sub-strategies – maybe also of interest if you want to play more aggressive.
To above questions: Yes, the 5s by strategy remain the same during the year. We do the “markowitz” optimization once a year to reflect recent market data into the optimization. This optimization is the same you can do with the “Portfolio Builder” or “Portfolio Optimizer”, so you can create your own custom portfolio and re-optimize whenever you prefer.
KeymasterHi Ian,
yes, you can run the portfolio usig the “Cons. Signal” tab, that stands for consolidated signals. Just input the %s by strategy, amount, and select the period you want to be considered:
Either the second, which would be based on last close prices or the
Third, which would use intraday prices (sometimes data is not available, or recent dividend not considered)See here:
KeymasterI very much like the AllocateSmartly service, also subscribed to the free plan, and regularly reading the blog. Smart guys, whomever they are :-)
Their service is a bit different insofar they use “tried and tested” strategies from other authors, some of them we are also in contact with and admire. Most of these strategies are well researched and freely documented, so that’s very helpful also when trying to replicate them, which is a hobby of us.
We’re trying to go one step further: Beside publishing our own strategies and the mix&blend of portfolios thereof, we also offer our “secret sauce machine” QuantTrader so you can develop your own strategies – also in the hope of creating a vivid exchange of these, which we’ve not achieved yet.
KeymasterI’m in the Volatility below 15% portfolio, but with some cash on top (scaredy-cat of the team, and proud of it!)
KeymasterKeymasterHi Richard,
there is a lot of discussion regarding CROC, but also the other two currency ETN in this forum, use the search function. Liquidity is low, many cannot trade them in their retirement accounts, and there are also filing related issues. We therefore introduced the GLD/UUP version, which is simple to trade, but at a lower performance.
There are simply no better alternatives we could use, all have some kind of issue: https://etfdb.com/etfdb-category/leveraged-currency/
Using limit orders and giving them some time you should still be able to get decent fills, or alternatively consider doing the corresponding FX transactions with USD:AUD.
KeymasterYes, indeed it’s a bit tricky to copy the table. You need to hold CTRL, click on one corner of the table, then mark the whole table dragging the mouse while holding CTRL – then a CTRL + C and past with CTRL + V.
.. I take note so we make this simpler somehow.
KeymasterThe problem with more frequent rebalancing is that it creates whipsaw effects, and additional transaction costs. Our strategies are long-term, which means they “sit-out” such corrections with the appropriate mix of risky assets and hedges, and not try to do short term market timing.
The monthly rebalance cycle in basically all our research shows to be superior due to two effects, a) still a mild “end-of-month” effect in prices due to institutional rebalanancing, but more important b) a “psychological” effect of creating a habit at the human end, that is, to avoid sitting at the monitor all month, and by routine rebalance once a month – that helps sticking to the plan, especially in times like we currently experience.
Give it a try downloading QuantTrader: https://logical-invest.com/quanttrader-application/, and then change the rebalance period from monthly to weekly, bi-weekly – and in contrast quarterly.
KeymasterThe name of the game currently is “expectations vs reality”.
Current estimates of loss of GDP for 2020 in the developed world are somewhere between 5-8% of GDP, varying by country. That’s based on the assumption that the worst is over after Q2 2020, there will be a “stabilization” in Q3-Q4 2020, and then a modest re-bounce in 2021. That’s the “hole” created by the shutdowns in the economy – and P&Ls.
At the same time central banks and governments are to spend also between 5-8% of GDP, either as direct subsidies, or providing liquidity. That’s the “grease”.
If you add this up, surprise, then the “grease” might cover that “hole”.
Well, provided the underlying assumptions hold:
– duration of shutdowns
– no 2nd, 3rd, Nth waves
– no other “fundamental” issues in the market
– no ping-pong effects in the global supply chains
… and probably another 20 or so..From a valuation perspective the S&P currently is at least at the pre-crisis P/E levels. Prices are not yet recovered, but I assume it’s safe to say that the “E” for 2020 will be hit strongly, and for 2021 is guesswork. So today’s valuation historically is quite/very expensive.
At Logical Invest we’re price-action driven – meaning we trust that main wisdom is always priced in, so our algo’s can do their job.
I trust the algos (the math part), but yeah – it’s currently hard to find the wisdom in the market, and whether it has correctly priced in reality, or making reasonable assumptions about the future. Helping that argument is that volumes are low – so probably a lot of “dumb” money driving the market, while the “smart” money is still on the sidelines.
Still, it’s important to stick to the plan – which according to most models still is: “shelter in place”, to “flatten the (equity) curve” (double pun intended).
KeymasterWe also trade with IB, I normally use the ‘adaptive order’: https://www.interactivebrokers.com/en/software/tws/usersguidebook/algos/aboutibalgos.htm
Do not trade outside regular hours, try to stay away from first and last half an hour, just too much action. You set the limit depending on the movements of the last hour, or last 20 minutes, depends on how quickly you want to fill. If the market goes away you, so be it, adjust your limit – the aim is not to get last close price, but to get some cents more than with a market order or a rush limit order, and it accumulates with time.Plus, you get a feeling for the market.
KeymasterWe always recommend to use limit orders, and give them time to execute, if needed adjust little by little. If your broker provides them, use some of the “smart algorithms” to get better fills.
KeymasterLike it, will put it on the todo list. Btw, we’re working continuously on enhancements, and also plan to release “V2” of the web-app.
KeymasterPlease try wit the latest version 523S. You can just drop the new exe file in your QuantTrader folder and then start the new version.
https://www.dropbox.com/s/gbamv17e5wtrp8c/QuantTrader523S.zip?dl=0KeymasterHi Adrian,
you’re absolutely right, we’ve not yet added that info back to the chart, I put it on my todo list.
KeymasterThe ETF expenses are considered in and charged through their prices, so yes, they are considered in our strategies.
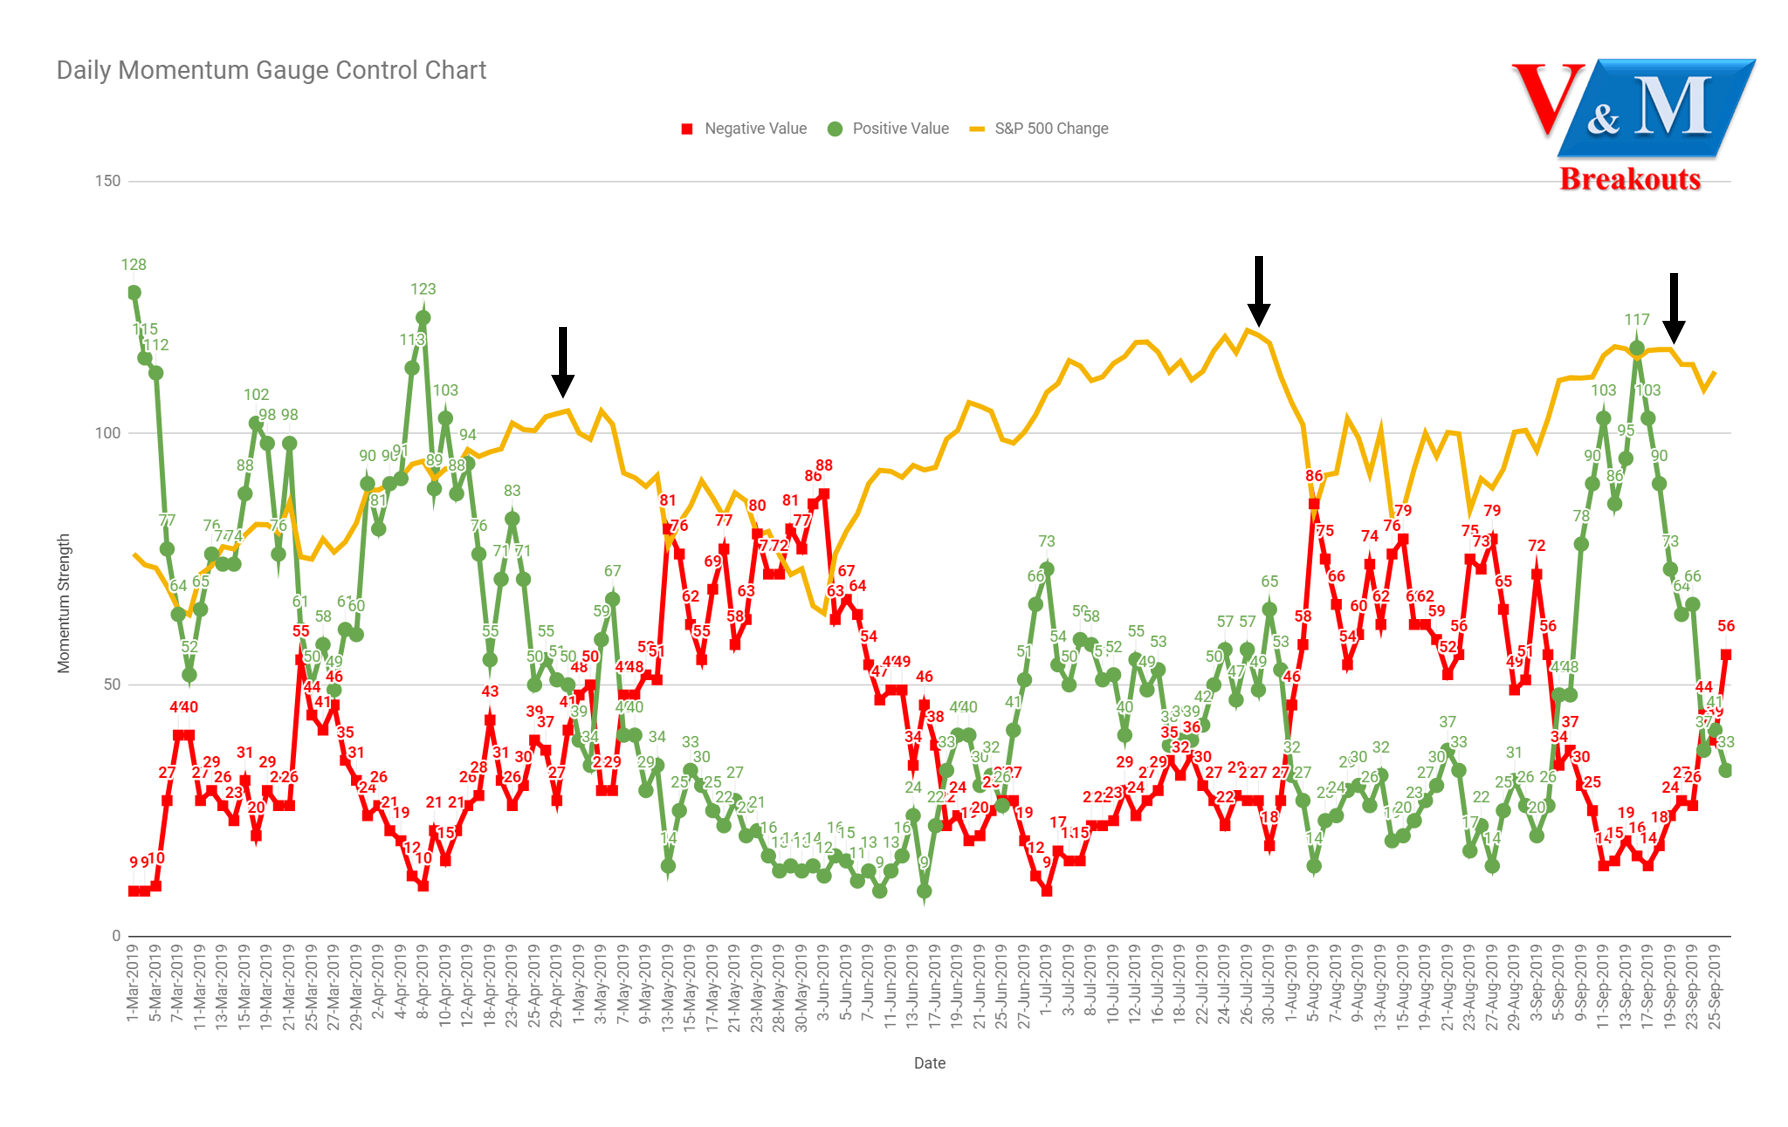
KeymasterNot trying to sound rude, but these momentum “gauges” are normally relative simple market timing indicators, e.g. moving averages with some kind of smoothing, some kind of threshold definition, well at least looking at this: https://static.seekingalpha.com/uploads/2019/11/11/43516266-157348348977288_origin.png
If there are some hints on how this is constructed let me know and I try to rebuild on a rainy weekend for the fun of it: DollyTheClone [at] logical-invest.com
Btw, did you know that Frank, Vangelis and me were members of and met in a group called “Copy with pride”? :-)
KeymasterSorry guys, it was actually there, but hidden by some black magic .. :-) Just re-enabled it, and any further suggestion for improvement is always welcome.
QT currently does not calculate Down volatility, Sortino, Ulcer, Max Duration, Avg Duration, etc, we do this only in our web-site. I put it on our ever growing ToDo list..
KeymasterHi Raj,
you’re right, thought we’d support Discover, but as we’re handling payments with a European provider we do actually not. Same for Diners and JCB, so basically only Amex, Visa and Mastercard – should have known before, sorry. Cards shown on the checkout have been updated.
KeymasterHello Raj,
sorry for the trouble, but the site is working as normal, and a test subscription I just did went through without issues. Also cannot see any failed try reported, so it’s hard to say what’s happening.
Could you try with PayPal – this also allows you to enter your credit card in the next step. I will also email you..
KeymasterSeems my previous reply ended up in your spam folder, have just emailed you from my personal account, that should help.
KeymasterIf I wouldn’t know, I’d now guess the “D” stand for “Daredevil” Woods :-)
Actually pulling profits into a different account is a smart rebalancing approach.
KeymasterThe Light version only allows to run and execute our strategies. For being able to modify or create your own strategies you need to upgrade to the “Professional Individual” plan, which includes the full version.
KeymasterCurrently only one by user, we’re working to allow for multiple in future.
For the time being you can “merge” serval portfolios into one like described here: https://logical-invest.com/create-portfolio-of-portfolios-portfolio-builder/
Or use QuantTrader which allows you to very quickly obtain signals for several portfolios as outlined here: https://logical-invest.com/quanttrader-application/portfolio-backtesting-builder-main-windows/#conssignals
KeymasterHello Mike,
welcome to the Logical Invest community!
To replicate any of the portfolios from the web-app in QuantTrader, just follow the process described here, see the animation: https://logical-invest.com/quanttrader-application/portfolio-backtesting-builder-main-windows/#conssignals
In our terms portfolios are fixed-weight blends of our strategies (or ETF), so you can simply input the %s into the consolidated signals tool to see the allocations.
Hope this helps, Best, Alex
KeymasterHi Thierry, appreciate your response. Yes, indeed the allocations in the “invested” tab should not change after the “official rebalancing”. The only “but” is what I explained above about later changes in prices due to dividends, which again is rare and rather an exception out of our hands and affects all data providers.
Keymaster1) The allocations for all strategies we publish on the web-site come straight out of Quanttrader, there are no different versions for what we publish in the web-app and QuantTrader. So for example the Top 3 Strategies Thierry referred to is the same strategy both in QT and the web-app. For technical reasons in QT it is (still) called “Strategies of Strategies” in QT, while in the web-app we changed it to “Top 3 Strategies”.
2) That being said, there are slight differences in how the metrics are calculated. For example in QT we assume a risk-free rate of 0% as default (you can change in settings), while in the web-app we use 2.5% – so this has an effect on Sharpe, Ulcer, etc. Also the rounding of other metrics is different. This does not affect the allocations, as in the “modified Sharpe ratio” ranking the risk-free rate does not matter.
3) Most importantly, and we’ve seen this a couple of times now in the forum: In QuantTrader the “current allocation” is updated each time you run the application, and uses the most recent available pricing information. While the “invested” tab is the allocation from the last “official” rebalancing. This is important out of two reasons:
i) A QY user can decide to rebalance on a date other then our “official” rebalance date, for example just after close, or 1 day after month end – with “fresh, most recent prices”, but obviously the signals in “current” might then be different from what we show in the web-app. For example, if you ran QT on Sept 30 6pm EST, or Oct 1st 2am by default the signals might be different, see also ii). What this means: QuantTrader is our more flexible product for power users, offers much more functionality and settings, all “secret sauce” under the hood of our algos – this compared to the web-app where we try to provide a less complex environment. As we offer both, we very often fall in the trap where signals and results of both are compared, and this is totally fine, but at the end very often timing or user defined parameters are the reason for these changes. So, our pledge to advanced users: Use QT, learn it, feel it, get used and fall in love with it – but then do not nail us if the web-app shows slightly different results :-)
Here a screenshot of the allocations as of October 4th, so you see that indeed since Sept 30th the allocations in the “current” tab has changed. So somebody just joining today or somebody who decided to rebalance every 4th of the month can use the most recent pricing information to invest into this allocation. However, this is not available in the web-app where we keep the allocations static after the rebalance to keep it simple. You see that in the last days BRS has fallen out of the Top 3 and has been replaced by GMRS.
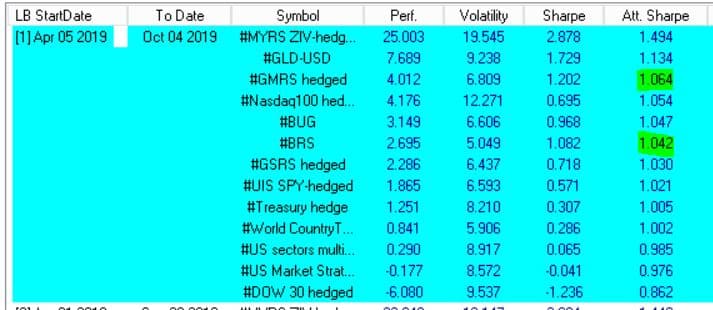
ii) And this is a tricky one: We use “split and dividend adjusted prices”, not plain “cash prices”. These calculations are complex and update the price history of the involved assets. The timing of these calculations is hours after close of the exchanges, after all dividend information is submitted and then normally available around 5-6 AM US EST the date after month-end. This is why we normally send the signals around 7 am US EST. But: It has happened and will happen again that for some tickers the dividend and split adjusted prices are updated by the data provider after that hour, and then there can be differences to the allocations just send out. Solutions? We could wait more before sending out the newsletter, but then you would not have it before US markets close. Is it critical? No, as only in very marginal “close call” situations where two strategies (or their components) are very close together in the ranking, and a slight change in prices then changes this allocation. This seems odd, but in practice when two strategies are very similar in the ranking there is no “good or bad”, either is fine. There are mathematical approaches for this, like “fuzzy logic” or “trigger ranges”, but these do not help in the practical application in our feeling.
Here a screenshot of the allocations and ranking as of Sept 30: See the values of the “attenuated sharpe” column for GMRS and BRS, the difference of both was only 0.02, but decisive to which strategy would make it into the “Top 3” ranking. In practice this means either is good – they are better than the other strategies ranked much lower, and that’s the point of the strategy.

So in essence: QT users have much more information at their disposition, and the benefit of being able to compare QT vs. Web-App. But allow us some simplifications for the less sophisticated investors only using the web-app.
KeymasterHello John,
the best way would to apply for the status of a “professional” or “sophisticated” investor at your broker, so you can trade all US ETF without restrictions, or look for a US brokerage account. The use of CFDs is indeed a risky and expensive work-around, personally I would not trade them.
KeymasterHi Ron, see my reply here, probably would have been better in this thread: https://logical-invest.com/forums/topic/moderate-risk-new-allocations-for-september-tlt/#post-69843
With the 70% allocation to UGLD the strategy is basically in “risk-off” mode, and picks the better of UGLD and TMF, or the “lesser of two evils” as you say. I posted two screenshots from QT below, one for the 4 months look-back period and a 3yrs for the big-picture.
Technically speaking, the strategy considers a volatility attenuator of 2, which means it is very sensitive to any change in volatility, and that’s what we’ve seen for quite some time now, basically since Q4 2018 the hedge was 40-70% of the allocation. Also it considers the reversion to the mean, basically it ignores or even penalizes the performance of the last month (based on the parameters performance is calculated as Performance last 84 days – 150% performance of last 21 days (25% of lookback)).
As I referred to in the other thread:
“That’s the psychologically tough part of Momentum driven strategies: Buy when things have already moved quite a bit, sell even if you think the party might re-start.However, we’re late in the cycle, and despite the ‘bit’ of volatility recently we’ve not seen any serious correction yet, were the flight to safety moves such safe-haven prices much more violently.
Just some days ago replied to a comment re how negative yields feel like in Europe, so who says the 1.5% in the US is the bottom? See the comment by Vangelis today what it would take to devaluate the USD rate-wise.
If you feel uncomfortable with long term bonds or gold, the signal basically says ‘risk-off’. Cash is an alternative, even if historically in our models you’d lost some of the performance.”
4 months:
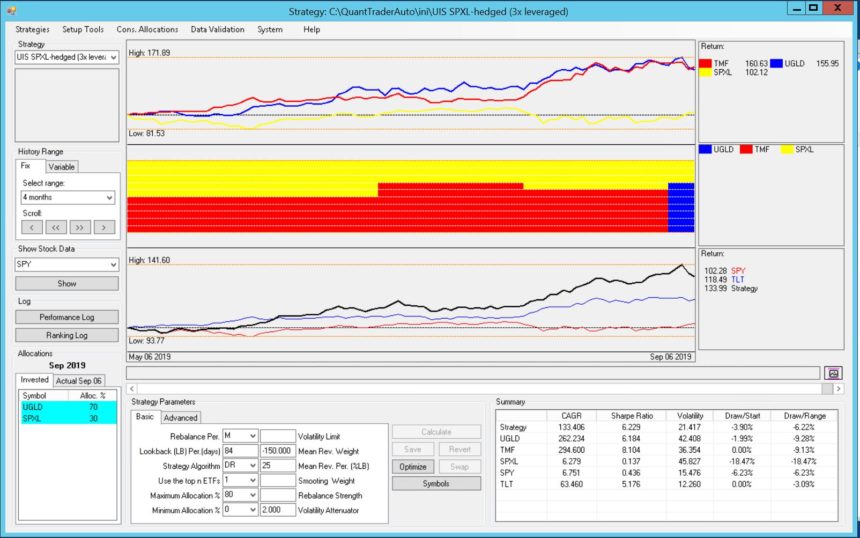
3 years:
 Keymaster
Yes, that’s exactly what happened. Now with the hedge being able to pick from either bonds, IPS and gold it looks better suited going forward, as it should adapt to whatever happens with bonds long term.
I also want to stress again that UIS3x and MYRS should only be used as a small part of your overall portfolio, they are extremely aggressive.
KeymasterThanks for the referral RD, very kind of you! We could certainly also do a more aggressive UIS picking individual sectors with leveraged ETF like TECL/SOXL, did you try already in QuantTrader?
KeymasterHello Thierry,
to start with an explanation, the “Actual” allocation tab shows you the outcome of the algorithm as of the time when you execute QuantTrader, that is based on the latest available close prices. So this can and will change several times during the month, depending on how each single strategy performs during the month. For us it is only relevant on the rebalance day, which was July 31st, and now August 30th, the last trading days of the month.
Then the “Actual” allocations become the new “Invested” allocations, that is what is held in the portfolio for the current – and after the rebalance date – the next month.
In the web-app we only show the allocations as of the rebalance date, and not what the algorithm might have picked during the month.
As of July month-end on 7/31 the Top Strategy had allocated to the World Top 4 strategy, which are the signals we had send out, but if you looked some days later in August it may well be that during the month the algorithm would have ranked BRS higher temporarily. As most strategies are in “risk-off” mode the ranking is currently mostly about the degree of hedging in the strategies.
KeymasterYes, that’s indeed the main point. I agree both TLT but also Gold had an incredible run, and we’re at historical low rates, and a very strong Dollar.
That’s the psychologically tough part of Momentum driven strategies: Buy when things have already moved quite a bit, sell even if you think the party might re-start.
However, we’re late in the cycle, and despite the ‘bit’ of volatility recently we’ve not seen any serious correction yet, were the flight to safety moves such safe-haven prices much more violently.
Just some days ago replied to a comment re how negative yields feel like in Europe, so who says they 1.5% in the US is the bottom? See the comment by Vangelis today what it would take to devaluate the USD rate-wise.
If you feel uncomfortable with long term bonds or gold, the signal basically says ‘risk-off’. Cash is an alternative, even if historically in our models you’d lost some of the performance.
KeymasterWe also recommend to trade the first day of the month after the opening auction has finished, i.e. 30 minutes after open. But our analysis has shown that trading at a later hour or even a day later has no significant influence on the long-term performance.
KeymasterWe’re reopening this thread to improve the structure of the forum
KeymasterWe’re reopening this thread to improve the structure of the forum
KeymasterWe’re reopening this thread to improve the structure of the forum
KeymasterWe’re reopening this thread to improve the structure of the forum
KeymasterThere are no good non-K1 alternatives to EUO and CROC, so maybe you rather use the alternative Gold strategy, which serves nicely as a hedge mixed with equity heavy strategies, albeit at lower returns: https://logical-invest.com/app/strategy/gld-uup/gold-currency-strategy-ii
KeymasterI agree that HEWC, and some other ETF in this strategy, has a relatively low trading volume. Still, using limit orders the market maker will make sure you get a decent spread. If you do not care for the CAD hedging you can also trade EWC directly, which is high volume.
HEWC, see: https://www.etf.com/HEWC#tradability
EWC, see: https://www.etf.com/EWC#tradabilityKeymasterCould you give me some example of the ETF which you are concerned about? For most we have now identified non K-1 alternatives, albeit with lower trading volume.
KeymasterThe Germany 20+ year bunds ETF is probably the best hedge due to liquidity.
KeymasterI would agree long-term. Also if you’re not limited by your broker or local law you can do some discretionary calls at year end to sell some losers and re-buy them after any required period in the new year.
KeymasterThanks for the comment! Using bonds vs cash offers a positive return bias, that is bonds act as hedge, but also long-term tend to go up due to the yield they offer. This is why we normally avoid any go-to-cash mechanism, but you can certainly incorporate it by yourself using our QuantTrader Software.
KeymasterThe unit of measure for the different duration metrics is in days.
08/01/2019 at 5:27 am in reply to: question regarding – "Why we employ walk-forward testing to avoid curve-fitting" #68454KeymasterYou wrote: “you demonstrate that your changes have never been implemented in order to fix a broken strategy”.
Probably not the answer you are expecting, but what Frank is explaining in the article is that indeed we do review our strategies explicitly to ensure the fundamental base is not broken – and if: we do fix it, where possible – or abandon it, where needed.
Example: The last 20+ years have been marked by ever-decreasing bond yields, especially after 2008/09. This made ultra-long bonds the perfect hedge: Mostly negatively correlated with equities while offering positive return bias. This long-term trend somewhat stopped when the FED started hiking – so we looked for a new hedge and adapted our hedging approach. PDCA: Plan, do, confirm, adjust (if necessary).
An alternative approach would be to use a backtest with 100 years of historic data – this might indeed reduce the need for changes, but also the opportunity of finding alpha.
Another example: Our Maximum Yield Strategy is based on harvesting the “fear premium” from shorting volatility. This is a very opportunistic strategy as it relies on two fundamental assumptions:
– There is a market for such fear-premium harvesting – which has not been available before the GFC 2008/09, so adios long-term backtesting.
– There is (mostly) contango in the volatility curve, which has been for most time between 2010 – 2018, and then suddenly there wasn’t anymore and in Feb 2018 the strategy stopped working for some months, and then started working again with a new set of parameters reflecting the new market environment.Again, the 20+ years backtesting approach would not work here, you would have lost the opportunity to harvest 8 years of very nice returns, which even including the tough years in 2015 and 2018 still surpasses 30+% CAGR.
So in summary, yes, as good CEO’s of our investment approach we strive to detect and harvest investment opportunities, but also have the flexibility to strategically, i.e. long-term adjust to changing market environments.
This is a great area of discussion, so hopefully can further expand on this topic.
08/01/2019 at 5:04 am in reply to: Why did some monthly past perf %'s change on Mod. Risk Port after 8/1 update? #68451KeymasterWe had to update the constituents of the Nasdaq and Dow 30 strategy, so this affects the stocks which are available for QuantTrader to pick in the ranking. Sadly in the case of some stock symbol changes, mergers and acquisitions this affects the whole history, as historic data is not available anymore.
We’re working on a historic “snapshot” of the portfolio performance to minimize the effect of such symbol changes.
KeymasterHello Mark,
the symbol put under the “hedge” section is used only for the DR/DRE/DRRP algorithms, formerly it was the last symbol in the equity list, but now we’ve put it into a different field for clarity.
See here: https://logical-invest.com/wp-content/uploads/2018/03/Ranking-Algorithms.png
KeymasterHello William,
All our portfolios are fixed-weight blends of the strategies. So instead of subscribing to several portfolios, you can mix & blend one portfolio from the underlying strategies. That’s easier to track, see here how to create your very own custom portfolio: https://logical-invest.com/create-portfolio-of-portfolios-portfolio-builder/
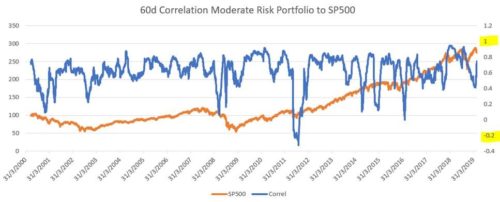
Correlation: The correlation among the portfolios and to market proxies differ on the timeline depending on the allocated strategies and their ETF. For example when there is a long-trending uptrend in equities the portfolios also allocate more to equities, thus the correlation to let’s say SPY is relatively high – once the trend breaks or markets turn then the portfolio allocates to safe havens thus correlation is lower.
Here as example the 60 day rolling correlation of our medium risk portfolio vs the S&P500, you see how it oscillates between close to 1 (fully tracking) to -0.2 (inverse correlation):
Do the three core portfolios use the same symbol set? No, they use different strategies with different ETF subsets, see the description and allocations
Should I include more strategies/portfolio to the above three? You can blend in additional strategies into your custom portfolio, see link above
How often do you post more models and portfolio? Normally we publish 2 strategies per year
Will you be working on market neutral models? Yes, but market neutral in the sense of better hedges, not long/short same indices/sectors. - AuthorPosts


