How we backtest our trading strategies, how we avoid overfitting by using walk-forward testing and why we adapt our strategies from time to time.
One of the main questions we get is this: Why do we change the set of parameters from time to time? Is this not just curve-fitting to improve the system performance?
Some think, that once you developed a strategy, you should never change it. They argue this is the only way to see if a portfolio or strategy is really working.
We have a different opinion. An investor running an investment strategy is comparable to a company running a strategic business plan. A company unable to adapt its strategic orientation to an ever-evolving marketplace will disappear sooner rather than later. The same is the case with an investor not questioning his investment strategy.
Most investors do not follow a trading strategy. They just invest in equities of their home market. Even in my small home country Switzerland with only 8 million inhabitants, most people invest only in Swiss equity. They did quite well in the past 40 years, but this is due purely on the success of their home country. Many investors of other less successful countries lost much of their wealth with such a narrow-minded investment strategy.
So, it is very important to have a diversified and somehow flexible investment strategy if you want to prevent big losses during market corrections.
For us at Logical-Invest this means, that we have to constantly check the validity of an investment approach and if needed, we must do small changes without changing the original character of the strategy. If we do such changes, we always go back and check how the strategy would have performed with these changes in the past. We do this by backtesting the strategies with QuantTrader.
Many investors tend to do the same investment errors again and again. Even if they see that a specific action did not work in the past and that the probability is high that it will also not work in the future, they may still perform the same mistake. Investing is in fact just a question of probabilities. Nobody can foresee future market moves. However, if a strategy worked during the past 5-20 years, then the probability is high that it will also work in the future. In the short term, such a strategy may underperform a simple (100%) investment in the equity market, however in the long term there is a good chance that such a strategy will perform better than a “all in” 100% equity strategy or any of the buy-and-hold lazy portfolios.
Another common question: How exactly do we backtest portfolio and strategy models.
We do in fact simple “in sample” backtests to see if a combination of ETFs can be used to dampen market corrections and minimize risk while still producing reasonable long-term returns.
This “in sample” back testing has a drawback that you might over-optimize and that good results are just due to curve fitting. This risk can be reduced a lot by selecting diversified assets which include also underperforming asset classes instead of preselecting ETFs or stocks which did well in the past. Also, it is important to do a statistical analysis of the test results to see if there is a risk of curve fitting.
We can however also do OOS (out of sample backtesting) which I want to explain in the following chapter.
Out-of-Sample walk-forward analysis
A short description of how the OOS (Out Of Sample) walk-forward analysis works:
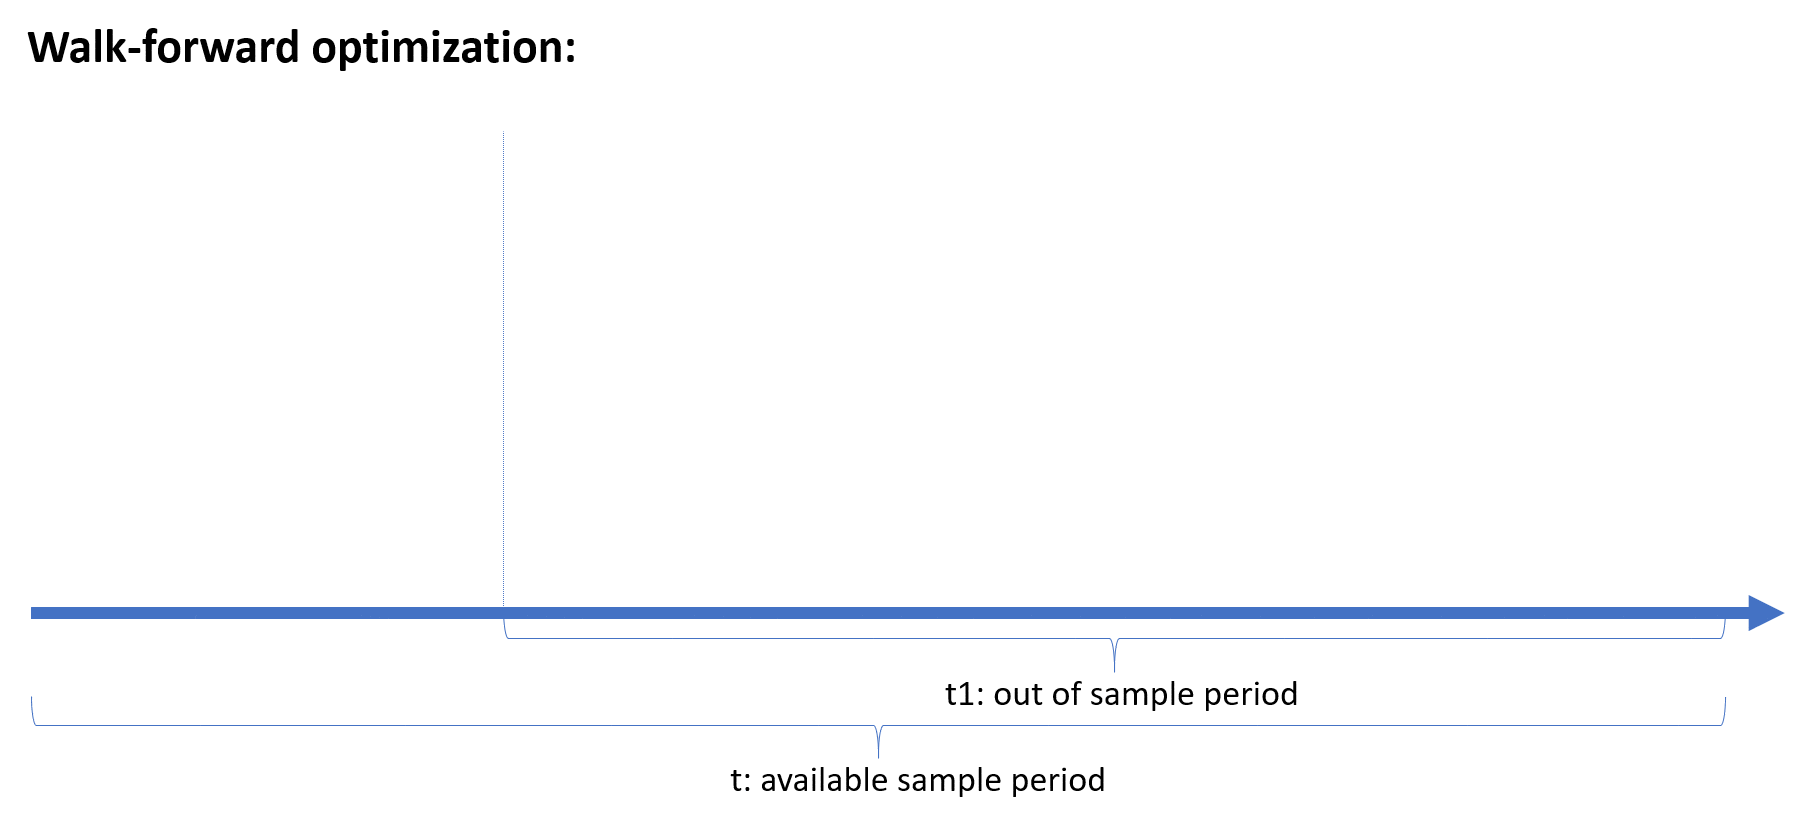
A first in-sample period is used to backtest the trading system and find the optimized set of parameters, in our case lookback period and volatility attenuator. These parameters are then applied to the first out-of-sample period, that is data which has not been included and is not ‘known’ yet to the system. Subsequently, both the in-sample and out-of-sample periods are shifted forwards, and again the set of parameters are backtested over the in-sample period and then applied to the out-of-sample period. The beauty of this walk-forward testing is two-fold:
- The out-of-sample backtest minimizes the risk of over-fitting, as the data is not previously know to the system when parameters are established.
- In contrast to other in-sample/out-of-sample validation methods, the walk-forward optimization with multiple periods allows the system to react dynamically to changed in the market environment, as the parameters are established and verified multiple times.
Here a simplified conceptual picture of how this walk-forward analysis works:
Now, let’s see this in practice applied to our strategies. Here is our standard SPY-TLT strategy optimized manually over 20 years
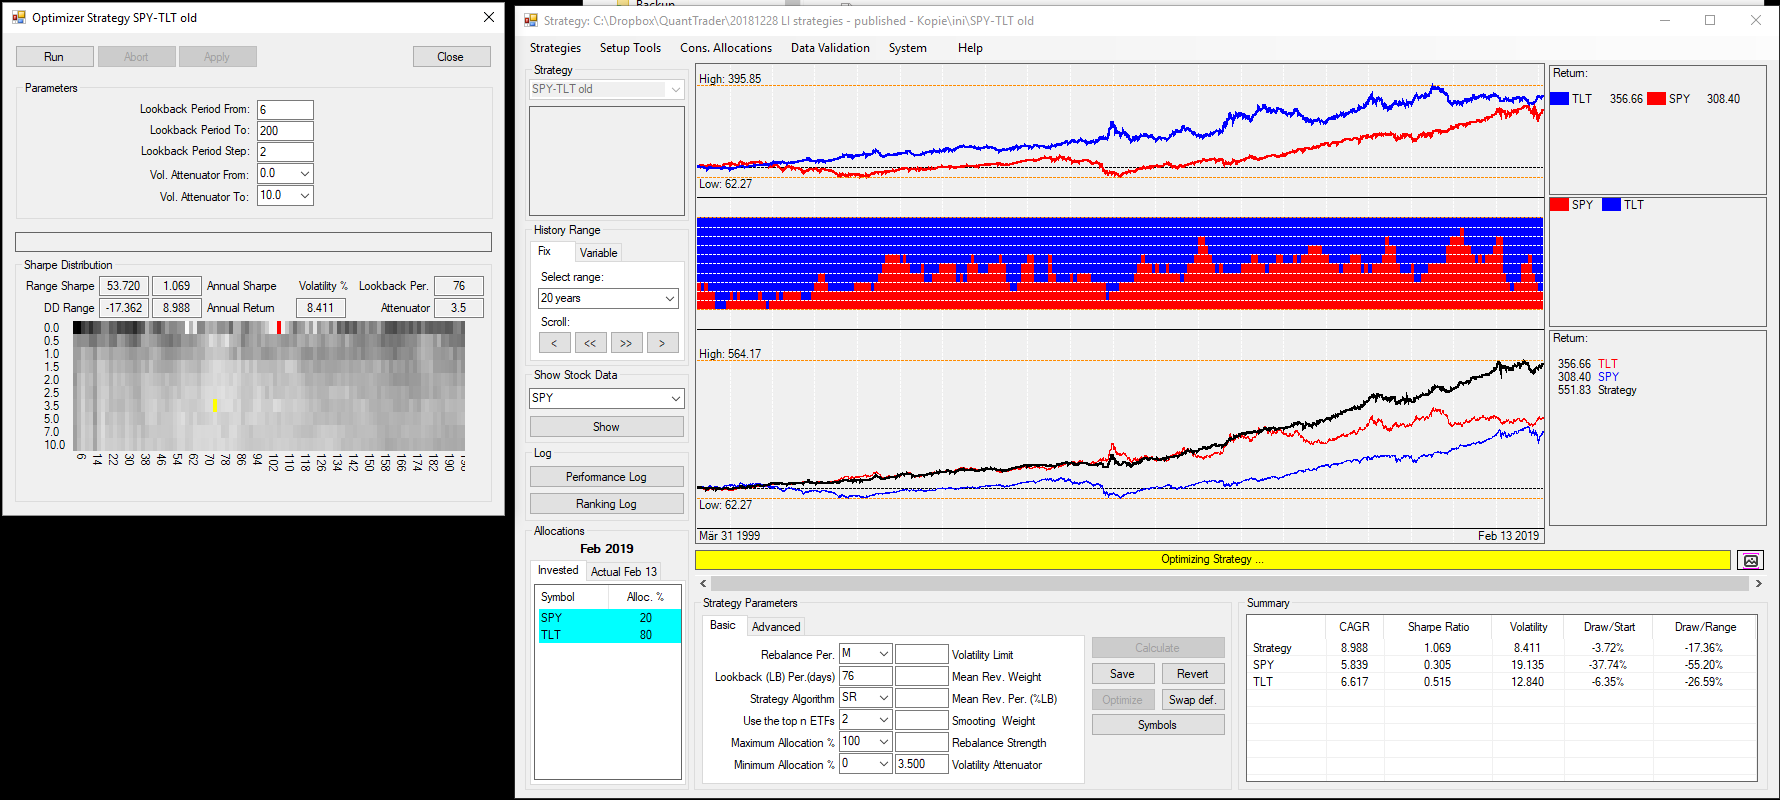
The optimizer result is the window on the left. As the optimizer goes through different parameter values it produces a visual representation of pair values that range from white boxes (better) to black (worse). This way we can visually pick parameters from a ‘favorable’ area rather than just picking the best overfitted value. The above optimization shows a maximum Sharpe for a setting of a 102 day lookback period and 0 as volatility attenuator (red dot in the left chart). This means it looks only at the 102-day performance. This means also a setting which always switches 100% between the assets.
I choose however the yellow working parameters which are 76 days lookback and 3.5 volatility attenuator. This way we reduce volatility because we are always invested in both assets.
Now I run the same strategy with the OOS optimizer.
The parameters are:
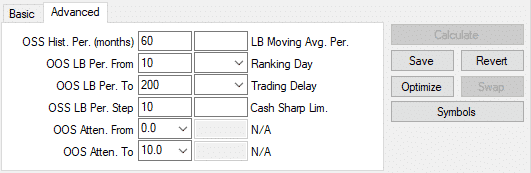
So, I optimize over 60 months of sample data in the past for a lookback period between 10-200 days with steps of 10 days. The volatility factor steps from 0 to 10.
Here is the result.
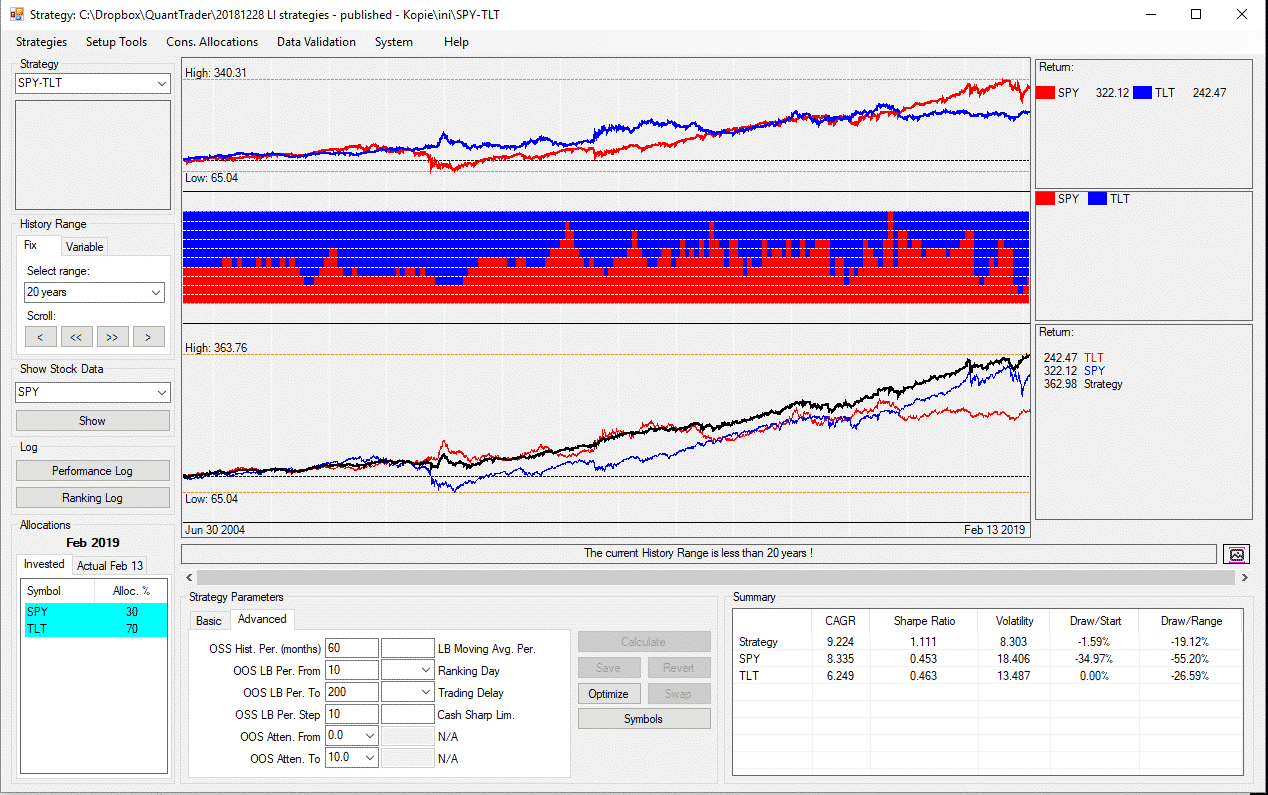
You see that the chart now starts in 2004 instead of 1999 because we used the first 5 years (60 months) of the sample data to calculate the set of parameters we want to use for our strategy. Using these parameters, we now calculate the allocation for the following month from the sample periods.
If you look at the performance log you will see that it uses a lookback period of 150 days and a volatility factor of 5 for the first months.

Going forward QT will optimize every month the last 60 months of data points and use the parameters from the sample results for the next month. This process is also called “walk forward optimization” or “walk forward analysis”.
The calculations are quite time consuming because QT makes a full optimization for every month. You will have to wait a little bit for the result.
The end result of the trading system is about the same as for the manual optimization over the whole 20 year period. The result is far better than any static 50-50 or similar allocation and we only used historical available data at any moment.
Using the performance log results, I have calculated an average lookback period of 71 days and an average volatility attenuator of 5 which is more or less the same I get when I optimized over the whole 20 years.
What you see here is that OOS in fact does not deliver much different results as manual optimization.
If you optimize manually it is very important that your results are based on enough rebalancing’s and that you don’t pick parameters which are isolated in the 2D statistics chart.
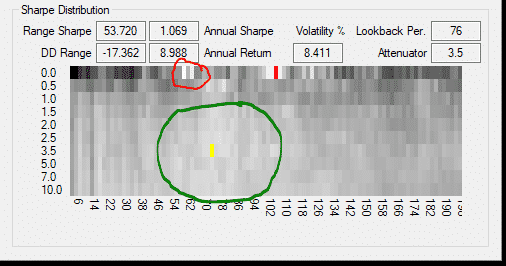
In the chart above we see two white settings (red circle) which seem not really to be stable. The same is true for the setting with the highest Sharpe ratio (red dot). However, the yellow setting we have manually chosen (inside green circle) shows very stable results even if the lookback period or the volatility factor change quite a lot. For these values we have a good chance that they will work also in the future.
The OOS module is far from finished. I would probably need some sort of averaging of these parameters to avoid large parameter jumps. Also, it is not easy to use this OOS calculation for other strategies. Most of the strategies just do not have enough history to be able to use this type of optimization.
I think a manual optimization probably gives us the best results, as we can visually inspect the 2D optimization chart. In addition, most of the time these values are quite similar. Nearly always, a lookback period of about 3 months is a good choice. This is probably the case because many investors use 3-month moving average to rebalance their investments. Other good lookback periods are 100 or 200 days probably because of the same reasons.
The volatility factor is mostly above 1 but below 5 which means that we use something between a minimum volatility allocation and a simple momentum-based asset switching. This also makes perfect sense.
Although I am still testing on how to make this OOS more stable and reliable, I wanted to share these tests and our working process so as to demonstrate that we are not just overfitting that data, but we are using various tools, including out-of-sample-tests to build strategies that have worked in the past and have a high probability of working in the future.
If you want to test this feature by yourself, just register to get a free one-month trial of our backtesting software QuantTrader and all other functionalities. You can download QuantTrader for free from here, see also our webinars and tutorials in the help section to get comfortable with it on a rainy day.
In anticipation of a vivid discussion in the comment section as always!
Thank you for this post. I have a question regarding your process even before this optimization process. In the article you said:
“For us at Logical-Invest this means, that we have to constantly check the validity of an investment approach and if needed, we must do small changes without changing the original character of the strategy. ”
How do you decide when changes are needed? What does constantly “checking the validity” involve exactly?
It would be interesting to go back to your original strategy for something like UIS and see if any of the changes added much to the overall results. I would guess the results of trading the original version of the strategy with no changes would be pretty similar to the backtest of the newest version, thus demonstrating that the “original character” of the strategy is sound. If on the other hand, any of the original versions were “broken” it would be very concerning.
If you could provide some data to alleviate this concern I would appreciate it. In other words it is important you demonstrate that your changes have never been implemented in order to fix a broken strategy. Thank you!
You wrote: “you demonstrate that your changes have never been implemented in order to fix a broken strategy”.
Probably not the answer you are expecting, but what Frank is explaining in the article is that indeed we do review our strategies explicitly to ensure the fundamental base is not broken – and if: we do fix it, where possible – or abandon it, where needed.
Example: The last 20+ years have been marked by ever-decreasing bond yields, especially after 2008/09. This made ultra-long bonds the perfect hedge: Mostly negatively correlated with equities while offering positive return bias. This long-term trend somewhat stopped when the FED started hiking – so we looked for a new hedge and adapted our hedging approach. PDCA: Plan, do, confirm, adjust (if necessary).
An alternative approach would be to use a backtest with 100 years of historic data – this might indeed reduce the need for changes, but also the opportunity of finding alpha.
Another example: Our Maximum Yield Strategy is based on harvesting the “fear premium” from shorting volatility. This is a very opportunistic strategy as it relies on two fundamental assumptions:
– There is a market for such fear-premium harvesting – which has not been available before the GFC 2008/09, so adios long-term backtesting.
– There is (mostly) contango in the volatility curve, which has been for most time between 2010 – 2018, and then suddenly there wasn’t anymore and in Feb 2018 the strategy stopped working for some months, and then started working again with a new set of parameters reflecting the new market environment.
Again, the 20+ years backtesting approach would not work here, you would have lost the opportunity to harvest 8 years of very nice returns, which even including the tough years in 2015 and 2018 still surpasses 30+% CAGR.
So in summary, yes, as good CEO’s of our investment approach we strive to detect and harvest investment opportunities, but also have the flexibility to strategically, i.e. long-term adjust to changing market environments.
This is a great area of discussion, so hopefully can further expand on this topic.