
Install
To install QuantTrader, just unzip the downloaded file into a new folder, preferably on your desktop or another writable path, like c:/temp. You should not install QuantTrader into any system folder, as these by default are not writable.
If you get a warning by your virus program or windows shield that this file might contain a virus, this is a false positive. For convenience and flexibility we currently do not compile an installable file, as this allows files to be copied across your devices. Most programs offer a way to white-map the QuantTrader.exe or the containing folder.
Login
The QuantTrader license is validated through our server upon program start. You therefore need to be online to start the program.
Your user name and password is the same as your online account information. You can reset and change your password at https://logical-invest.com/my-account/
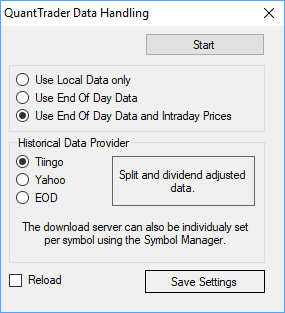
Data handling
Upon start the historical data can be updated, which depending on the number of symbols might require some minutes. If you have recently updated the historical data, you can skip this process selecting “use local data only”.
Backtest
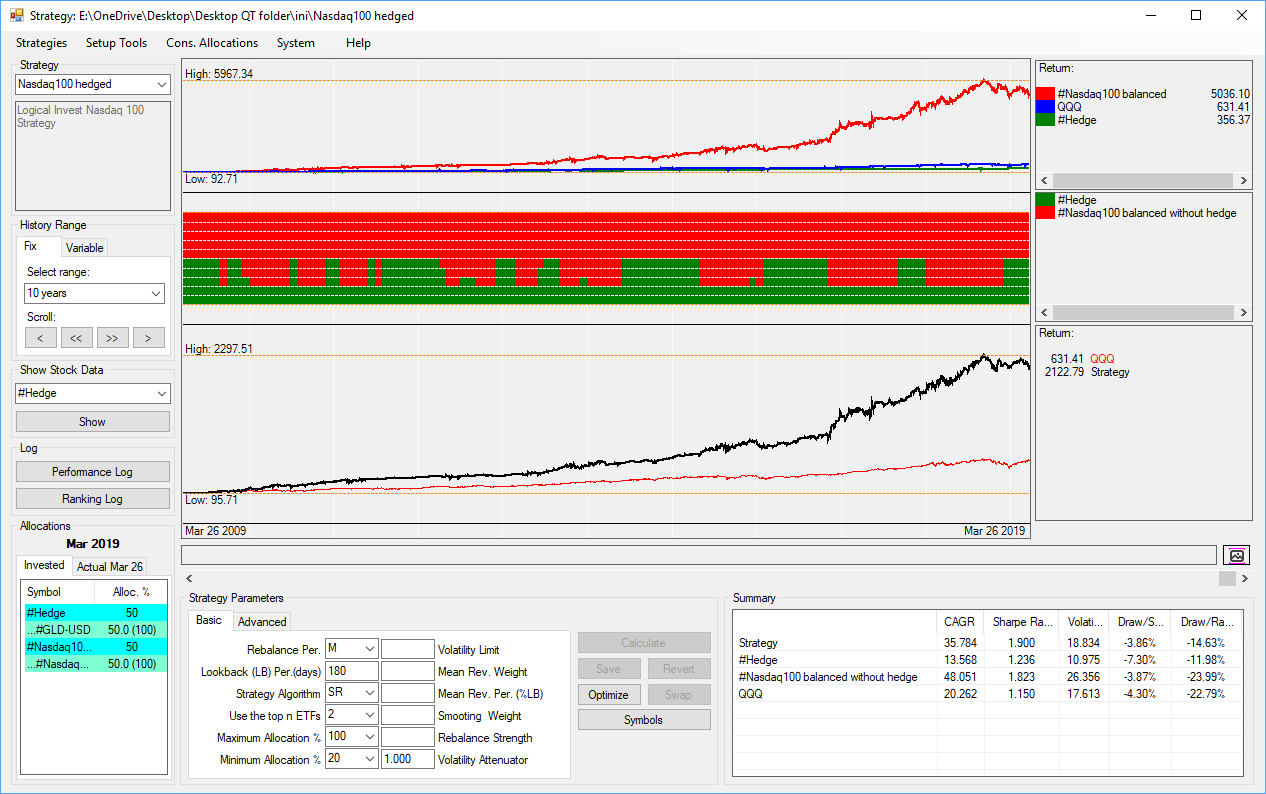
The backtester window is probably where you will spend most time, designing and reviewing strategies and meta-strategies. Therefore, let’s take a detailed walk-through of the different elements of the screen and their purpose:
- Portfolio Selection Menu: Depending on your license, you will find here the published Logical-Invest strategies, Meta-Strategies and own custom Portfolios you might have set-up using the Portfolio Manager tool.
- On the Performance Curves you can visualize the returns of the symbols you selected in the Graph Section of the Portfolio Manager. These can be the strategy components, but also can be other benchmark symbols you´d like to compare. In the example above the strategy components TLT and SPY are displayed, while you can see in below Selection of the Portfolio Manager that GLD is not displayed in the Performance Curves.
- The Allocations Graph displays the historical allocations in percent to the strategy components. Note that the resolution of the allocation percentage might be either in 10% or 5% steps, depending on what you selected in the Portfolio Manager when setting up your strategy. If you selected a volatility constraint then part of the allocation might go to cash, in this case the allocations to the strategy components do not add to 100%.
Hovering over the chart will display a popup window with further details of performance and allocation during the backtest period. - The Return Graph will display the historical returns of the Custom Strategy or Portfolio, and the constituent symbols. Note that in comparison to 2) Performance Curves, there are no benchmark symbols included, only the allocated symbols are displayed. The box to the right displays the accumulated return over the selected backtest period, while hovering over the graph will display monthly details for each symbol and the portfolio as a whole.
- The zoom bar allows you to zoom into periods to review details of the portfolio performance, allocation and comparison to benchmarks. Note that it is only available once you select a History Range that is smaller than the overall backtest lenght, e.g. weeks, months, or years. The screen symbol to the right allows you to take a screenshot of the graph area, which will be saved into the folder where QuantTrader is installed.
- The Summary Table shows you the overall performance statistics for your portfolio and the underlying symbols over the whole backtest timeframe:
- CAGR: Compounded annual returns
- Sharpe Ratio: Sharpe Ratio (Returns / Volatility)
- Volatility: Annualized historical standard deviation
- Draw/Start: Maximum DrawDown (Peak to through) in percent for the selected chart range
- Draw/Range: Maximum DrawDown (Peak to through) in percent over the maximum available backtesting range
- The Strategy Parameter Section is the most powerful feature, from here you control the input parameters of the underlying algorithms. Here we will only explain the basic functionality, for a detailed explanation of the algorithms please refer to section “Our Algorithms in Detail”:
- Rebalance per.: Options for Rebalance Period are 1 week (1W), 2 weeks (2W), monthly (M) or semi-monthly (SM). Note that for standard strategies monthly rebalancing at month-end is sufficient, higher rebalance frequency does not add performance but rather causes higher transaction cost.
- Lookback per.(days): The Lookback period for the ranking algorithm in days, that is the historical return data before the current rebalance date to be considered for calculating the modified Sharpe Ratio used for determining the ranking and allocation.
- Ranking NO/Stat/Dyn: The ranking logic to be used for the strategy, options are:
- No Ranking (NO): In a first step each of the symbols (excluding the bond/treasury symbol) receive an equal weighted allocation, for example 50% if there are two symbols and the Top2 are considered. In a second step the bond / treasury symbols is added and it´s allocation is calculated to optimize the modified sharpe ratio of the overall portfolio for the rebalancing period.
- Static Ranking (SR): All strategy components receive directly in one step the allocation which maximizes the the modified sharpe ratio of the overall portfolio for the rebalancing period.
- Dynamic Ranking (DR): In a first step each of the symbols (excluding the bond/treasury symbol) receive the allocation which maximizes the modified sharpe ratio of the combination for the rebalancing period. In a second step the bond / treasury symbols is added and it´s allocation is calculated to optimize the modified sharpe ratio of the overall portfolio for the rebalancing period.
- Static Ranking Equaly weighted (SRE): This is the same as SR ranking with the difference that all ETFs get the same allocation. So if ou for example define a top 5 Nasdaq 100 strategy with SRE, the each of the top 5 stocks will get 20%.
- Dynamic Ranking Equaly weighted (DRE): This is the same as DR ranking with the difference that all equity ETFs get the same allocation. Only the hedge ETF which is the last one in the list can get a variable allocation. So if ou for example define a TLT hedged top 5 Nasdaq 100 strategy with DRE and TLT will get a 50% allocation, the each of the top 5 stocks will get 10%.
- Use the Top n ETF: The number of symbols that should be considered for allocation after the ranking. As an example, if your strategy contains 10 symbols, you might chose Top5 to consider only the 5 best ranked symbols, or Top3 to only consider the best three.
- Maximum Allocation %: Maximum Allocation in percent each symbol can receive during the rebalance period. This is to avoid corner-solutions where one symbol might receive 100% of the allocation, and adds stability to the portfolio.
- Minimum Allocation %: Minimum Allocation in percent each symbol must receive during the rebalance period. This is to avoid corner-solutions where a symbol might receive 0% of the allocation, and adds stability to the portfolio.
- Volatility limit: Adds a volatility constraint to the optimization algorithm. If the annualized historical volatility of the portfolio allocations during the backtest period optimized for modified Sharpe would exceed the volatility limit, then all allocations are linearly scaled down until the volatility falls into the limit. The remaining allocations goes to cash, that is the allocations do not reach 100% during the rebalancing period.
- Mean Reversion Weight and Period: This is an advanced feature which allows to consider a short term mean reversion effect in our medium term momentum based algorithms. Within the ranking algorithm first the performance during the complete lookback period is determined, in a second step the performance during the last x days (Mean Reversion Period, in days) before the rebalance date is calculated and added with a weighting factor (Mean Reversion Weight in percentage, example 50, or -50) to the overall performance to be considered in the overall ranking calculation. Note that that the mean reversion effect can work on two sides: Symbols that had a high performance during the overall lookback period, but suffered a short term mean-reversion dip might benefit from recovering during the next period (“buy cheap”, negative Mean Reversion Weight). In contrast in some cases symbols which show a good performance during the overall lookback period plus a high short term performance might indicate an acceleration in their momentum.
- Smoothing Weight (0 to 1.0): Advanced feature which allows to smoothen the change in allocations to each symbols. For example a smoothing factor of 0.5 would reduce the change in allocation to a symbol to 50% of the current allocation. As an example if TLT had an allocation of 40% in the last period, and the new allocation without considering the smoothing weight would be 10%, then the new allocation with the smoothing weight would be 40 – (40% x 50%) = 20%. This feature is useful to reduce drastic changes in the allocation between rebalance periods, and therefore limit execution costs.
- Rebalance Strength (0 to 1.0): This is similar to the Smoothing Weight above, but rather a scaling factor to the rebalance signals. With 0.5, a strategy will only change between 25% and 75% (=50% range) rather than from 0% to 100%
- Volatility Attenuator: Updates the Volatility Attenuator used in the Modified Sharpe Calculation.
Buttons:
- <<< and >>> buttons: These allow you to walk-through the most recent modifications you have applied to your strategy, and undo or redo them. This is practical to quickly compare different scenarios with different parameter sets.
- Apply / Revert: Apply changes in parameters to the backtest, without saving them to the strategy definition. The Revert button allows you to undo changes in parameters which have not been saved.
- Update / Add / Delete: Once you have applied changes and are satisfied with the result, you can Update the Strategy definition definitely, or use Add to add it to the list of recent modifications which can be undone and redone. The delete button eliminates a choosen parameter set from that list.
- Symbols: The Symbols popup will open to display parameters by each symbols. These can be set as global parameters in the Strategy Parameters or for advanced use by each Symbol in the Component Definition in the Portfolio Manager as shown below.
- Optimize / Swap: Will open the Optimizer popup window to perform brute-force optimization of the lookback and Volatility Attenuator parameters. Once you apply an optimized combination in the Optimizer window its effect will be displayed immediately on the Backtester screen, and you have the option to swap between the original and optimized calculation.
Advanced Parameters: This section contains parameters for some advanced features we are still working on, and therefore will not be explained in detail here. In short, we will be adding the option to do Out-Of-Sample Tests directly in QuantTrader (something we have been doing in other software so far), and also add a feature to do a dynamic walk-forward-testing, that is, dynamic optimization of parameters within “slices” of the available data so to reduce risk of over-fitting and reducing dependency on certain parameters.
Consolidated Signals
This screen allows you to blend different strategies together into a fixed-weight portfolio, see the backtested performance and the current allocations.
For the allocations you can select from three time periods:
- Invested allocations as of last rebalance date (these will match with the signals we publish in our app)
- Current allocations as if you would rebalance with the last available close prices
- Current allocations as if you were to rebalance with intraday prices.
You can save your settings, that is the chosen strategies, weights, amount invested and period – so next time they will be readily available.
To copy the consolidated allocations for pasting into Excel or a text editor simply keep the left mouse button pressed while marking the table, then CTRL+C to copy and CTLR+V to paste, see below:
Optimize
The Optimizer allows you to run a brute-force test of selected parameter ranges, and see the outcome for each parameter set.
Parameters included in the optimization are:
- Lookback Period in days for the momentum algorithm: You can select the ‘from’ and ‘to’ range, and the ‘step’ for the loop
- Volatility Attenuator: Our Algorithm optimizes for a “modified Sharpe Ratio” (see here), also here you can select the ‘from’ and ‘to’ range
Important here to note is the difference between a regular backtest and an optimization:
- In a backtest the algo calculates each month the modified sharpe ratio for all possible combinations of all included assets during the rebalance period and ranks them. So for example a 10 years backtest with only two assets (SPY/TLT) it runs each month (120 calculations) through all combinations SPY:100% / TLT:0%, .. SPY:90% / TLT:10%, .. SPY:10% / TLT:90%, .. SPY:0% / TLT:100% using the values set in the strategy configuration for the lookback period and volatility attenuator. So this itself is a brute force optimization of thousands or hundred thousand of combinations.
- When you optimize a strategy, it does one of above backtest for each possible combination of the lookback period and volatility attenuator values, so this optimization involves hundred thousand or millions of combinations for each asset allocation, lookback and volatility attenuator value.
- In the optimizer window the “Range Sharpe” is the modified sharpe ratio (= rd/(sd^f), so with the volatility attenuator) the optimizer solves for (over the whole history range you selected, e.g. 2, 10, 20 yrs), the “annual sharpe” is the “regular Sharpe”: Sharpe = rd/sd.
- We do a couple of normalizations during the calculation of the modified sharpe ratio. We do publish the overall algo, but not all details of the normalizations, just to keep it interesting for others to replicate. But if you have a sharp look at the “ranking log” you can output on the main screen you see all input values and also the calculated modified sharpe value, from there is only takes a rainy weekend to reverse engineer the normalizations.
Upon finishing the optimization run, a heatmap of different lookback (horizontal) and volatility attenuator (vertical) combinations is displayed, the optimum is marked in red. You can now visually confirm where a broad stable range of parameters is located, and whether the chosen combination is part of such range. When moving your mouse over the combinations in the heatmap, the Sharpe Ratio, Annual Returns, Volatility and parameters for lookback and volatility attenuator are displayed.
You can select any combination by clicking on the heatmap, the selected combination will now be marked in yellow and used once you apply and return to the backtester window.
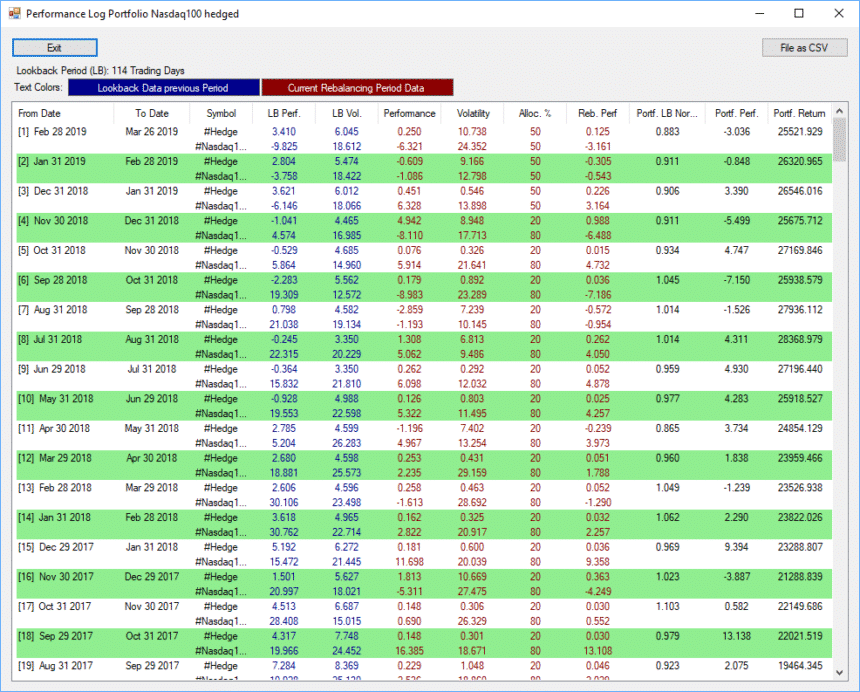
Performance Log
The performance log gives you details on the strategy performance by each rebalancing period:
- From Date: Start of rebalancing period
- To Date: End of rebalancing period
- Symbol: The symbols which received allocations (not all included in the Strategy!)
- LB Perf: Performance (return during previous period) by each symbol
- LB Vol: Volatility (standard deviation of returns during previous period) by each symbol
- Performance: Performance (return during current period) by each symbol
- Volatility: Volatility (standard deviation of returns during current period) by each symbol
- Alloc %: Allocation in percent to each of the symbols
- Rebal Perf: The Performance of each symbol during current period weighted by its allocation
- Portf. LB Normalized Sharpe: The normalized “modified” Sharpe of the symbol combination during the previous period
- Portf. Perf: The performance of the symbol combination during the current period
- Portf. Return: The accumulated return of the strategy since the beginning of the backtest
The table can be saved as csv file for further manipulation in Excel, it will be saved in the folder where QuantTrader is located.
Portfolio Manager
The Portfolio Manager allows you to add, edit or delete portfolios or strategies and their parameters. A detailed walk-through can be found in Set-up Sub-Strategies.
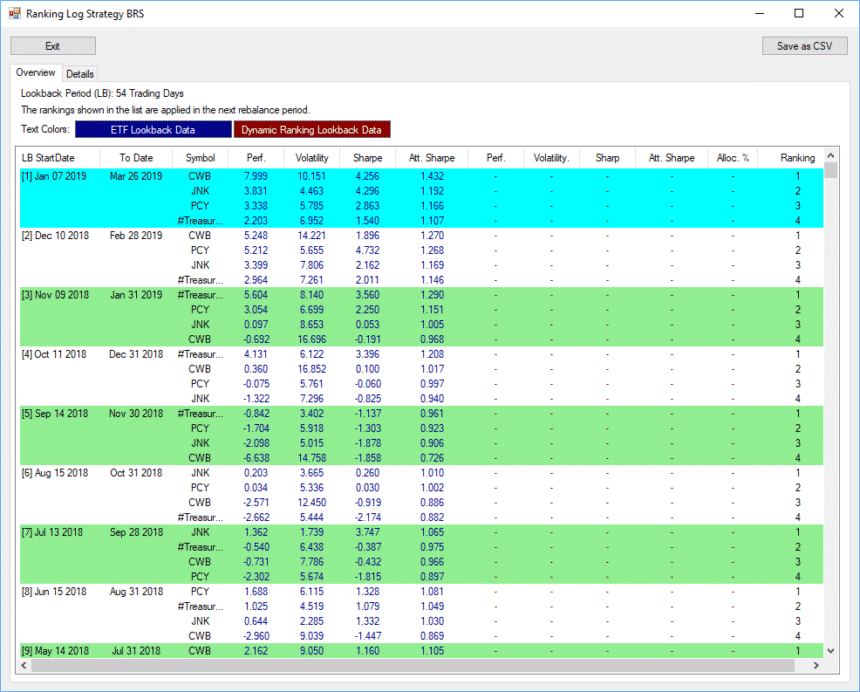
Ranking Log
The Ranking Log allows you to validate your strategy parameters, e.g. how they influence the ranking logic of the ETF.
For strategies using “SR” Static Ranking Logic, only the blue “ETF Lookback Data” part will be populated, for strategies using “DR” Dynamic Ranking Logic also the red “Dynamic Ranking Lookback Data” will be shown.
- LB Start Date: Start of rebalancing period
- To Date: End of rebalancing period
- Symbol: The symbols which received allocations (not all included in the Strategy!)
ETF Lookback Data:
- Perf: Performance (return during previous period) by each symbol
- Volatility: Volatility (standard deviation of returns during previous period) by each symbol
- Sharpe: Simplified Sharpe Ratio (Return / Volatility) by each symbol
- Att. Sharpe: Modified Sharpe Ratio (Return / Volatility ^ Volatility attenuator) by each symbol
Dynamic Ranking Lookback Data: (same as above, but ignoring the Bond ETF which will be added after initial ranking)
- Perf: Performance (return during previous period) by each symbol
- Volatility: Volatility (standard deviation of returns during previous period) by each symbol
- Sharpe: Simplified Sharpe Ratio (Return / Volatility) by each symbol
- Att. Sharpe: Modified Sharpe Ratio (Return / Volatility ^ Volatility attenuator) by each symbol
- Alloc %: Allocation to each symbol in percent
- Ranking: Ranking of each symbol (ignoring bond if “DR” is selected)
The table can be saved as csv file for further manipulation in Excel, it will be saved in the folder where QuantTrader is located.
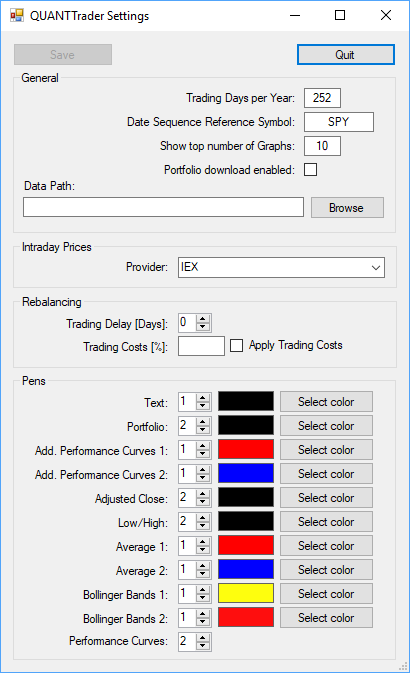
Settings
In the setting you can specify:
- Trading Days per Year: Normally 252 is used
- Date Sequence Reference Symbol: The base symbol used for aligning the time series of other symbols. Gaps in the timeseries causes by public holidays can be aligned with this.
- Data Path: Path where symbol information is stored
- URL Bank: Link to your trading account, used in the Trader window for simplifying your trade execution
- Trading Delay: Trading Delay in Days to consider when calculating performance. Use if you normally trade after the close of the rebalancing period.
- Trading Costs %: Trading Costs in percent to be considered when calculating performance. These should account for trading cost (by your broker) and assumed slippage
- Colors to be used in Backtester
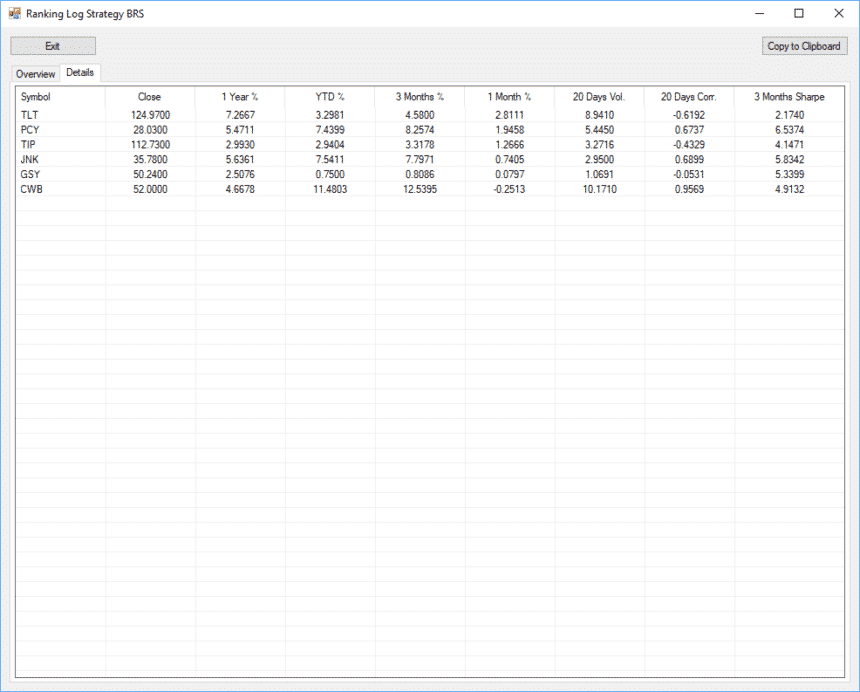
Stock Data
This screen allows you to validate the data downloaded from Yahoo Finance and to save it as file for further manipulation
In case of selecting a sub-strategy it contains the performance and accumulated return of the strategy.
Stock List Manager
The Stock List Manager allows you to import and mass-edit symbols for strategies which contain lot of symbols.
For importing list of symbols use a csv file with one symbol per line, which will then be added automatically. You can also add symbols from the existing list of components on the left.
Symbols
This window gives you details on the symbols used in the active strategy. It can be accessed from the Backtester using the “Symbols” button.
Symbols Manager
The symbols manager allows you to add, edit and delete the symbols or sub-strategies available for building strategies.
You can set these parameters:
- Currency: In case you trade other than USD please select it here. Note: You can currently not mix different currencies in one strategy
- Category: Select from “Common ETF”, “Treasury ETF” and “Currency ETF”. Note: The “Treasury ETF” setting is especially important when using the “Dynamic Ranking” (DR) as the first treasury ETF will be used for combining it with the other used symbols.
- Trading Costs: Trading Costs in percentage for the symbol (including assumed slippage)
- Description: Long name and description of the symbol
- Cross-Reference: List of strategies where this symbol is currently used.
Troubleshooting
QuantTrader is designed and developed with love and precision in Switzerland. But as with all good tools it takes some time (and debugging) to bring them to perfection.
If you experience any issue, crash or notice any error or other things we can improve, please use our online forum or let us know at [email protected].