
Welcome to QuantTrader!
This help file aims to guide you through the functionalities, trading algorithms and screens, so you have your own strategy built, backtested and invested in less than an hour.
How to get started
Some Definitions to start with, in our terminology we use:
Symbols: Stock Tickers or Indices used in QuantTrader either as components of a strategy or as benchmark symbols. All Symbols (Stocks, ETF, Mutual Funds, Futures, Currency Pairs), which have historical data in one of our data sources can be used, which is: pretty much everything around the globe.
Algorithm: Mathematical rules of how to rank, allocate and rebalance symbols in a Strategy, Meta-Strategy or Portfolio. We publish most of the logic of our algorithms online and also in this help file, but finally always reserve a bit of the secret source for us – just to keep it interesting. A base algorithm is the ranking by Modified Sharpe Ratio, which will be explained later in detail.
Strategies: Set of symbols and parameters to trigger our algorithms to perform a backtest of allocations, and do rebalancing in the futures. All of our strategies published on https://logical-invest.com/ are available in QuantTrader.
Meta-Strategy: Combination of (Sub-)Strategies with a dynamic ranging approach into one Meta-Strategies. A meta-strategy changes dynamically the allocation to individual strategies over time. This is different to fixed-weight combinations of strategies into a Custom Portfolio (like we use online), where the allocations to strategies over time do not change.
Portfolio: Combination of Symbols and Strategies into one Portfolio, which you will allocate investments. This isw somewhat a loose term, as in reality you can also choose to allocate your investments into different Strategies and Meta Strategies.
Set-up Symbols and Sub-Strategies to be used as strategy components
Setting up new symbols to be used as strategy components is straightforward. The Symbols Manager allows you to visualize the symbols already set up.
To add a new individual symbol just add a valid ticker symbol, its currency, Category, Trading Cost and a Name or Description and click “Save Symbol”. In below example I’m adding FINGX, a Mutual Fund “Franklin India Growth A”.
If you want to add a larger number or a list of symbols, for example in your initial setup or for adding a complete list of index constituents you can use the Stock List Manager, which allows you to import a csv list of symbols in one batch.
For adding a (sub-) strategy to your list of symbols to use it in a Meta-Strategy, simply select the Strategy in the Backtester, then open the Performance Log and save the csv file. The file name will be the strategy name with a # prefix, example #BRS. This is the symbol name you can now add to the Symbols Manager to have it available in the Portfolio Manager.
Set-up basic Strategies, Meta-Strategies and Portfolios
Let´s walk you through the process of creating a new strategy, meta-strategy or portfolio. As mentioned in the definitions, in our terminology a Strategy consists of tradable symbols, a Meta-Strategy consists of sub-strategies (which consist themselves of tradable symbols) and a Portfolio is any combination of Symbols, Strategies and Meta-Strategies. The process of designing and setting them up is always the same, provided their constituents have been set-up before through the Symbols Manager.
- Click “New” and enter the strategy or portfolio name and optionally a description:
- Add Components (Symbols or other Sub-Strategies) to your strategy:
In our example, we select the Nasdaq100 strategy, a bond (TLT) and Gold (Gld). As benchmark we add the S&P 500 ETF (SPY)
- Now, add the settings for the graph, we use the standard settings here.
Important: We want to use SPY as benchmark in the Performance Graph, but not as component in the strategy itself, therefore deselect it there.
- Select the Strategy Type, Benchmark Symbols, Trading Type and Allocation Step Size. We use the Defaults for our test and explain advanced features in the Backtester section.
- Save and you are done setting up your first strategy!
And the results? Go to the backtester window to see, fine-tune and optimize
(Hint: 23% annual performance without any further step!)
Advanced Settings for Strategies, Meta-Strategies and Portfolios
For advanced setups there are some parameters which can be defined at a symbols level, in contrast to the global parameters which are normally applied at strategy level.
- Allocation weights: The sum of the allocation. Normally 100%, but you can use this parameter to simulate leveraged accounts, e.g. 200%.
- Max. Allocation %: Maximum Allocation in percent the symbol can receive during the rebalance period. This is useful for example if you want to avoid a leveraged ETF to receive a higher allocation than specified.
- Min. Allocation %: Minimum Allocation in percent the symbol must receive during the rebalance period. This is useful for example if you want to avoid a hedging symbols to receive a lower than specified allocation.
- Multiplier: The Multipier just multiplies the daily performance of an ETF. So, can simulate for example a 3x leveraged ETF. TLT with a 3x multiplier simulates TMF. The unleveraged ETFs normally allow much longer backtests. 3x leveraged ETFs are quite new.
- Volatility Multiplier: This allows you for example to reduce the volatility of an ETF so that it will get a better sharpe ranking. Sometimes it makes sense to reduce the volatility of safe haven ETFs so that they will be selected early enough. Safe haven ETFs which have a negative correlation to equity have a “good” wanted volatility.
- Trading Type: Either
- “As Strategy”: Consider this symbol as sub-strategy, that is update the underlying performance report before any optimization
- “Long”: Standard, only trade this long
- “Short”: Trade this symbol only short, this is useful for hedging with equities, or volatility instruments.
Our Algorithms in Detail
Our base algorithms are ranking based on Modified Sharpe Ratio Optimization, that is, it takes performance and volatility into account and can be adjusted for different sensitivity of both factors. Optionally, a Mean Reversion logic can be added, and shorting / hedging features are available.
Here some further details:
Modified Sharpe Ratio
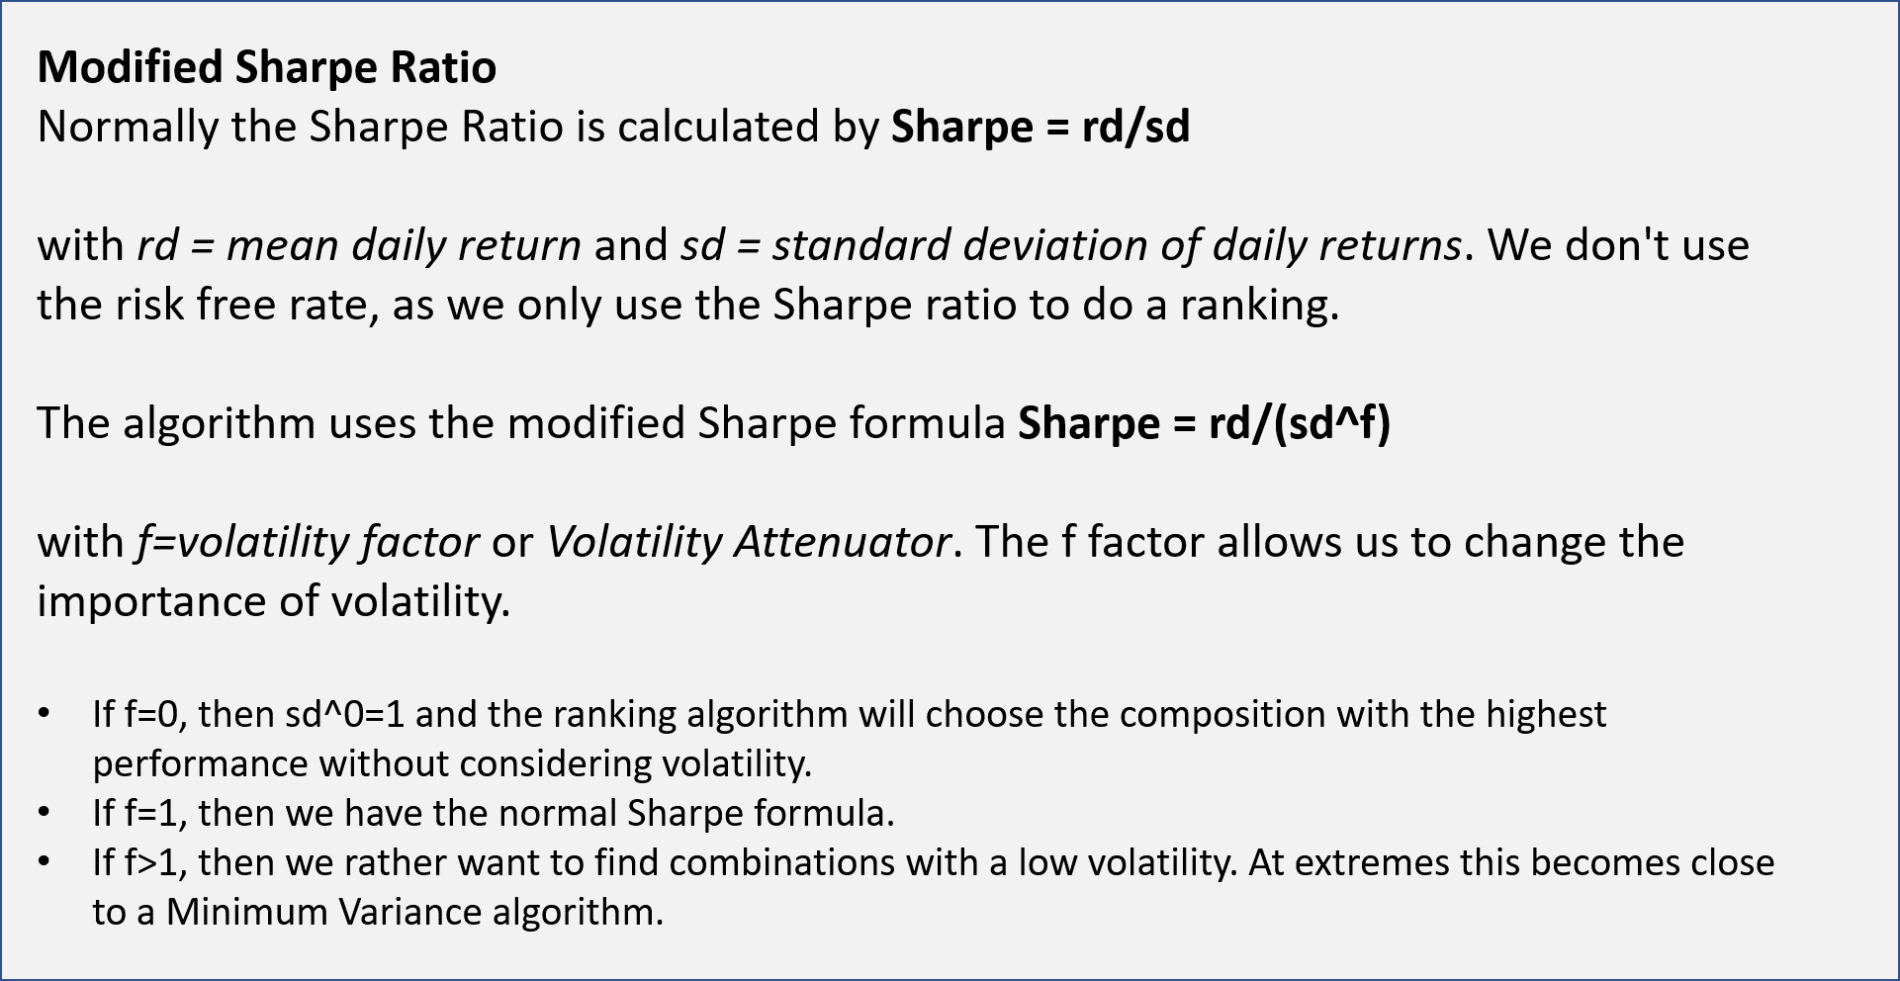
Normally the Sharpe ratio is calculated by Sharpe = rd/sd with rd = mean daily return and sd = standard deviation of daily returns. We don’t use the risk free rate, as we only use the Sharpe ratio to do a ranking.
The algorithm uses the modified Sharpe formula Sharpe = rd/(sd^f) with f=volatility factor or Volatility Attenuator. The f factor allows us to change the importance of volatility.
- If f=0, then sd^0=1 and the ranking algorithm will choose the composition with the highest performance without considering volatility.
- If f=1, then we have the normal Sharpe formula.
- If f>1, then we rather want to find combinations with a low volatility. At extremes this becomes close to a Minimum Variance algorithm.
Ranking and Allocation Logics
Several Ranking Logics are available, each one has a specific usage depending on the design of the strategy.
At first, the Ranking Logic will be applied to the ranked number of symbols specified in the TopX setting. That is, the number of symbols that should be considered for allocation after the ranking. As an example, if your strategy contains 10 symbols, you might chose Top5 to consider only the 5 best ranked symbols, or Top3 to only consider the best three
After that ranking, the allocations are calculated based on:
- No Ranking (NO): In a first step each of the symbols (excluding the bond/treasury symbol) receive an equal weighted allocation, for example 50% if there are two symbols and the Top2 are considered. In a second step the bond / treasury symbols is added and it´s allocation is calculated to optimize the modified sharpe ratio of the overall portfolio for the rebalancing period.
- Static Ranking (SR): All strategy components receive directly in one step the allocation which maximizes the the modified sharpe ratio of the overall portfolio for the rebalancing period.
- Dynamic Ranking (DR): Each ETF is always ranked against the last ETF in the list. Normally the last ETF is an ETF with negative correlation to equity like a Treasury ETF. If the Treasury ETF is for example TLT, then all equity ETF-TLT combinations are ranked. So the allocation which maximizes the modified sharpe ratio of the combination will be ranked first. The DR ranking method takes into account the cross correlation between ETFs.
- Static Ranking Equaly weighted (SRE): This is the same as SR ranking with the difference that all ETFs get the same allocation. So if ou for example define a top 5 Nasdaq 100 strategy with SRE, the each of the top 5 stocks will get 20%.
- Dynamic Ranking Equaly weighted (DRE): This is the same as DR ranking with the difference that all equity ETFs get the same allocation. Only the hedge ETF which is the last one in the list can get a variable allocation. So if ou for example define a TLT hedged top 5 Nasdaq 100 strategy with DRE and TLT will get a 50% allocation, the each of the top 5 stocks will get 10%.

Mean Reversion
This is an advanced feature which allows to consider a short term mean reversion effect in our medium term momentum based algorithms. Within the ranking algorithm first the performance during the complete lookback period is determined, in a second step the performance during the last x days (Mean Reversion Period, in days) before the rebalance date is calculated and added with a weighting factor (Mean Reversion Weight in percentage, example 50, or -50) to the overall performance to be considered in the overall ranking calculation.
Note that that the mean reversion effect can work on two sides: Symbols that had a high performance during the overall lookback period, but suffered a short term mean-reversion dip might benefit from recovering during the next period (“buy cheap”, negative Mean Reversion Weight). In contrast in some cases symbols which show a good performance during the overall lookback period plus a high short term performance might indicate an acceleration in their momentum.
Tips for designing a solid strategy and portfolio
- Diversify: 90% of investment returns come from the selection of asset class allocation, only the remainder from other factors. If you are designing a single strategy, consider different asset classes (equities, bonds, commodities, currencies, volatility) and also look for a geographic diversification to avoid a “home-bias”. A different way is to look at the strategies as specific building blocks into a broader Meta-Strategy or Portfolio. In that case each individual strategy might be asset-class or industry specific (not diversified), but when combining them into the Meta-Strategy you add the diversification by including the different building blocks.
- Crash-Protection and Hedge: In the strategy design for crash situations, we normally do not go to cash, but rather use bonds, treasuries, commodities or precious metal. Staying out of the market has historically shown to be inferior to alternative approaches investing into “Safe havens”. You can consider hedges going long index constituents and shorting the index at the same time.
- Control volatility and your comfort level: When setting up individual strategies, look at the historical volatilities of its components. Similar level of volatilities between the components will result in more stable results and avoid corner-solutions where allocation jump into extremes. At Meta-Strategy or Portfolio Level indeed consider limiting volatility (going to cash in extreme market conditions). This contrasts with the point above, but at Portfolio level might ensure your peace of mind (even if it lowers returns slightly).
- Avoid over-optimization: Even if QuantTrader allows for many “knobs” to adjust and tune, avoid making use of too many of them at the same time. Look for stable ranges of parameter when optimization, that is, ensure you are not cherry-picking the best combination of parameters but look for ranges where the results are similar across combinations.