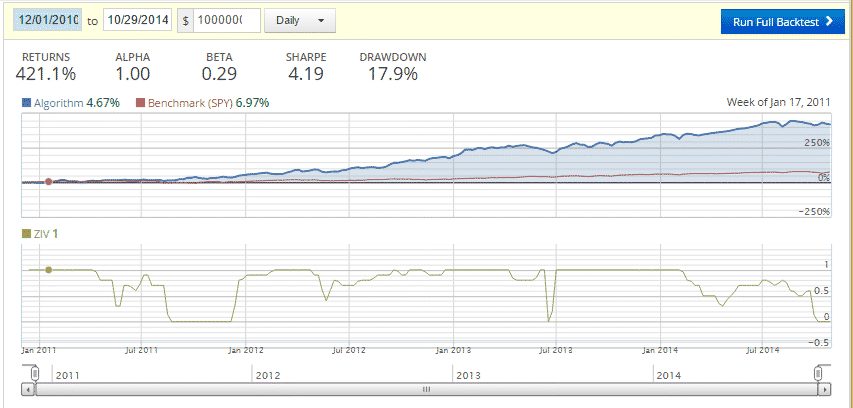
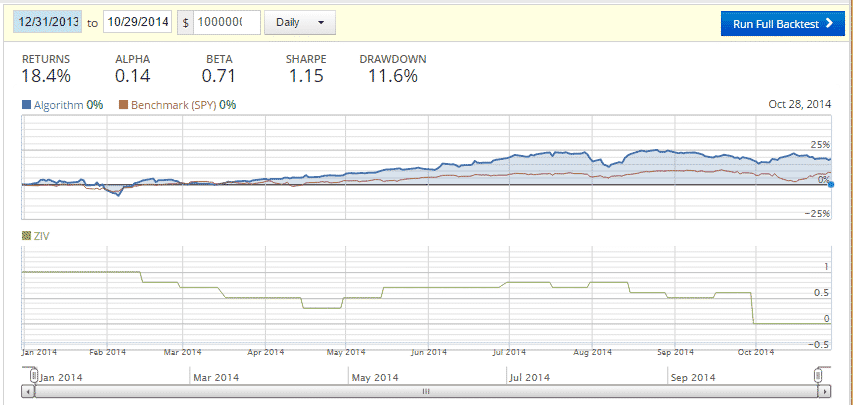
Here are two backtests charts of the new MYRS strategy with adaptive allocation, now also suitable for your retirement account. The annual return of the old and the new strategy is more or less the same. During low volatility markets, the return of the new strategy is probably slightly lower, however during difficult volatile years like 2014, the return of the new strategy is significantly higher and the drawdowns and the risk is reduced nearly by a factor of 2x. The slightly lower return is due to the fact that some time a part of your capital is invested in the Treasury hedge to reduce risk.
An option for your retirement account?
These US asset classes are:
- U.S. Treasury Bonds – (EDV Vanguard Extended Duration Tsy 25+yr)
- Volatility – (ZIV VelocityShares Inverse VIX Medium-Term)
- cash – (SHY Barclays Low Duration Treasury)
Treasury bonds and inverse Volatility ETFs have significant negative correlation to each other. This means, that whatever the market sentiment is, there is always one assets performing well. The strategy is a good way to profit from VIX contango without risking heavy losses during a volatility spike. The incredibily high return of this strategy does not mean that this strategy is very risky. The strategy minimizes the risk of losses during financial crisis by switching early into Treasurys or even switching to cash if all three assets perform worse than cash. The reward to risk ratio (Sharpe Ratio) of this strategy is 2.1 which is very high compared to 0.93 for a S&P500 investment. Since 2011 you made 6.7x more money with this strategy compared to an average S&P500 investment and this with considerably less risk.”
The allocation as of late is showing 0% for ziv, aren’t you recommending 30% in your latest update?
Also if I use tmv(shorted) instead of edv, what % for ziv should I invest ?
To add to my comment, 0% for ziv is showing on your charts in green. 30% is recommended in your latest bi-monthly update.
Yes, 0% ZIV was the October allocation, but the last 2 weeks of October ZIV went up 13%, so for November it was 30% ZIV again.
Regards Frank
Also if I use tmv(shorted) instead of edv, what % for ziv should I invest ?
Are you going to backtest using tmv allocations like you did for edv ?
If you use a TMV short or a TMF long position, then you need to buy 50% of the EDV position. So, if the signal told you to buy 70% EDV and 30% ZIV, then you need to buy a 35% TMV short position and 30% ZIV. This lets you with 35% cash.
Are you going to backtest using tmv allocations like you did for edv ?
I did a backtest, but in fact it depends how you invest. Say for example we are invested 40%ZIV and 60%EDV. You can replace EDV with -0.5x TMV. So, you can also invest 40%ZIV+30%TMV(short) this lets you with 30% cash, and like this you have more or less the same result as before. However you could also invest the cash, so ZIV%=40/(0.4+0.3)=57% and TMV=43%. You have the same ZIV-Treasury ratio but you now have leveraged the strategy by about 42% (leverage=1/(0.4+0.3)). In general you will have about a 42% higher return but the return to risk ratio stays about the same.
Great!
Is the volatility position sizing calculation still used now that the strategies have moved to adaptive asset allocation?
Thanks,
Don Krafft
Yes, the strategies have a volatility limiter and when the lookback period volatility exceeds the volatility limit, then we add cash until we reach the volatility limit.