Update: See the current performance of this ETF investment strategy here.
A new enhanced Global Market Rotation Strategy with adaptive ETF investment allocation
The GMR strategy performed well during the last 10 years. Especially during years with a strong trend in one of the 5 world markets, this strategy was able to switch early to the best ETF and stay invested until another market ETF took the lead.
A known problem for such monthly rotation strategies have been years like 2014 with no clear trend in the markets. During 2014, conflicts like Syria or Ukraine or the fear that the US market may have culminated and is ready for a correction, made investors switch several times in “risk off” mode which favors safe haven assets like our long term EDV or TLT Treasury. The bad thing was, that shortly after they switched back to “risk on” mode favoring our stock market ETFs. Such a whipsaw market is bad for “switching” rotation strategies and as a result, our GMRS strategy shows a negative return for 2014.
The strategy had two big monthly losses, both with foreign market ETF investment and both times because of a soaring dollar after a FED statement.
In fact most of the times a full switch from a stock market ETF investment to a treasury ETF is not the best strategy. Better is to keep both stock market and Treasury ETF investment and change the allocation gradually.
In January I proposed to invest 20% in a short TMV Treasury hedge which is about equal to a nearly 50% TLT hedge. This was a first approach to tell you that in such years it is better to invest in both, stock market and Treasury ETF investment.
This hedge has performed extremely well in 2014. TMV is 46% up and TLT is up 20% for the year, which is about a 10% contribution to the GMRS strategy. The subscribers which have invested in this hedge should still have a 4% positive return for GMRS year to date.
The disadvantage was, that many subscribers did not know always exactly, how much to invest in Treasuries and I also had every month questions about when to close this hedge because of the rising rates.
Rebalancing your ETF investment
To make it simple, the new Global Market Rotation Strategy is now always investing in an optimized ratio of a stock market ETF (MDY, FEZ, EEM, ILF, EPP) and a Treasury ETF (EDV).
I will for example tell you to invest in 50% MDY + 50% EDV for the month to come, so to keep your ETF investment in balance
The strategy has an adaptive allocation which can go from 0%-100% to 50%-50% to 100%-0% depending of the market situation.
The way to calculate the optimum composition is done by calculating which composition between stock market ETF (MDY, FEZ, EEM, ILF, EPP) and Treasury ETF (TLT) had the maximum Sharpe ratio during the last 40-70 days. During normal market periods, you will not get the maximum Sharpe ratio with a 100% stock market or at a 100% TLT investment, but with something in between. To calculate this maximum Sharpe ratio, I loop through all possible compositions from 0% StockMarket – 100% Treasury to 100% StockMarket- 0% Treasury and calculate the resulting Sharpe ratios for the look back period.
As a result I get a curve like this (result of July 21, 2014 for a SPY-TLT combination):
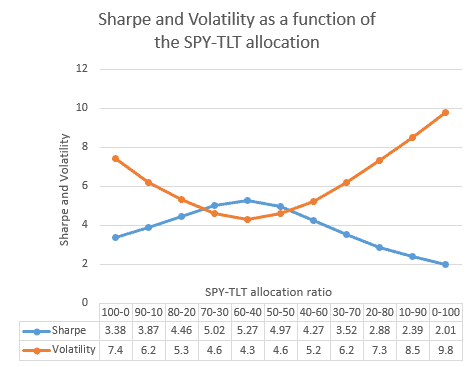
The interesting thing is that the 60%-40% combination of SPY-TLT gets with 5.27 a considerably higher Sharpe ratio then SPY (3.38) or TLT (2.01) alone. This is because the inverse correlation of the two ETFs reduces volatility (risk) a lot.
Another enhancement is, that I do not use the normal Sharpe ratio formula which is sharpe=r/sd, but
sharpe=r/(sd^f) with r=return, sd=standard deviation and f=volatility factor. The f factor allows me to give volatility an optimized weight.
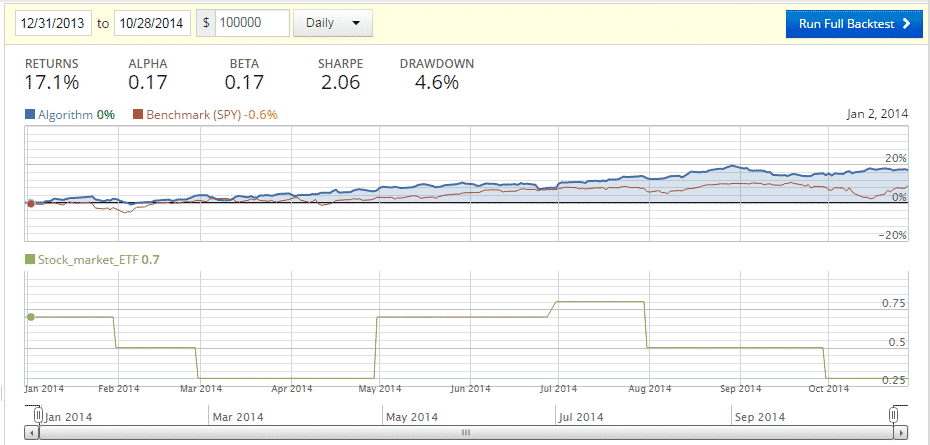
The Backtest of this new strategy achieves a Return to Risk (Sharpe) ratio, which is more than twice the Sharpe ratio of the old strategy. The difficult year 2014 would have resulted in a 17.1% profit instead of a -6.25% loss for the unhedged old strategy.
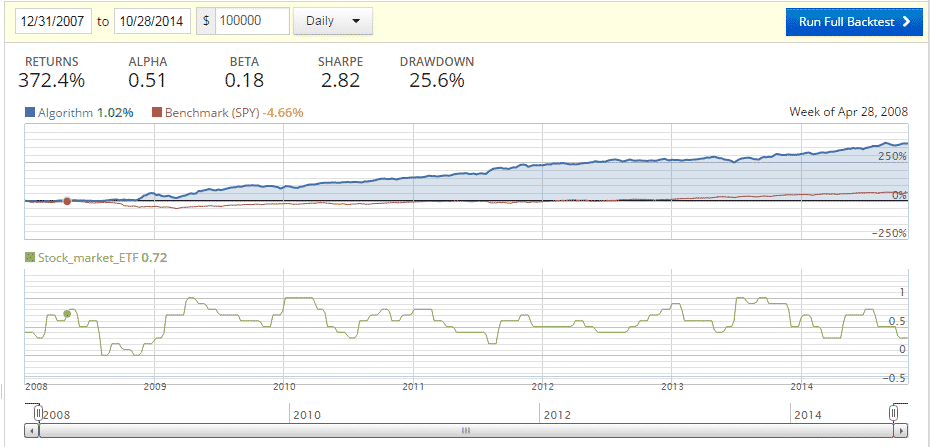
Full backtest from 31.12.2007 – 19.10.2014
Investments with percentage allocationsYou may probably think that the old strategy was still better because of the higher return, but this is not the case. Only return means nothing. The old strategy was in fact more leveraged and risky, because the investment was always 100% in the best ETF. The new strategy normally only invests about 50% in the stock market ETF (green chart). The other 50% are used as a hedge to reduce risk. The green chart below shows you the percentage invested in the stock market ETF.
Here you can see the ETF allocations backtested since 2007. For the FEZ ETF I have used IEV as a replacement, because FEZ did not exist in 2008.
The Sharpe ratio used for the allocation is a modified Sharpe. Sharpe is return divided by standard deviation (sharpe=rd/sd). In our case, we can increase the importance of low volatility with a power factor (sharpe=rd/sd^f). This results then in much higher artificial Sharpe numbers.
| Date | Sharpe | Holdings | |
| 12/31/2007 | 1,129,109 | MDY:40% | EDV:60% |
| 1/31/2008 | 186,120 | ILF:30% | EDV:70% |
| 2/29/2008 | 150,027 | ILF:70% | EDV:30% |
| 3/31/2008 | 338,703 | ILF:60% | EDV:40% |
| 4/30/2008 | 840,682 | IEV:80% | EDV:20% |
| 5/30/2008 | 2,947,827 | MDY:50% | EDV:50% |
| 6/30/2008 | 916,378 | MDY:60% | EDV:40% |
| 7/31/2008 | (39,792) | MDY:0% | EDV:1.0% |
| 8/29/2008 | 919,577 | MDY:20% | EDV:80% |
| 9/30/2008 | 354,919 | MDY:10% | EDV:90% |
| 10/31/2008 | 70,660 | MDY:0% | EDV:1.0% |
| 11/28/2008 | 165,574 | MDY:20% | EDV:80% |
| 12/31/2008 | 330,343 | MDY:30% | EDV:70% |
| 1/30/2009 | 75,955 | ILF:70% | EDV:30% |
| 2/27/2009 | 85,547 | ILF:70% | EDV:30% |
| 3/31/2009 | 3,152 | ILF:1.0% | EDV:0% |
| 4/30/2009 | 197,904 | EEM:90% | EDV:10% |
| 5/29/2009 | 590,333 | EEM:80% | EDV:20% |
| 6/30/2009 | 473,191 | MDY:70% | EDV:30% |
| 7/31/2009 | 757,333 | MDY:70% | EDV:30% |
| 8/31/2009 | 4,598,559 | MDY:60% | EDV:40% |
| 9/30/2009 | 7,079,106 | MDY:60% | EDV:40% |
| 10/30/2009 | 3,199,985 | EDV:50% | MDY:50% |
| 11/30/2009 | 1,727,388 | ILF:70% | EDV:30% |
| 12/31/2009 | 645,519 | EDV:0% | MDY:100% |
| 1/29/2010 | 60,508 | MDY:1.0% | EDV:0% |
| 2/26/2010 | 852,496 | MDY:1.0% | EDV:0% |
| 3/31/2010 | 2,779,258 | MDY:80% | EDV:20% |
| 4/30/2010 | 14,570,928 | MDY:50% | EDV:50% |
| 5/28/2010 | 12,231,739 | MDY:40% | EDV:60% |
| 6/30/2010 | 8,277,299 | MDY:30% | EDV:70% |
| 7/30/2010 | 5,704,127 | EEM:60% | EDV:40% |
| 8/31/2010 | 8,231,850 | EPP:70% | EDV:30% |
| 9/30/2010 | 8,896,873 | EEM:80% | EDV:20% |
| 10/29/2010 | 5,331,729 | MDY:60% | EDV:40% |
| 11/30/2010 | 9,402,351 | MDY:70% | EDV:30% |
| 12/31/2010 | 10,556,999 | MDY:80% | EDV:20% |
| 1/31/2011 | 8,759,029 | MDY:80% | EDV:20% |
| 2/28/2011 | 18,047,734 | MDY:60% | EDV:40% |
| 3/31/2011 | 11,357,671 | MDY:50% | EDV:50% |
| 4/29/2011 | 17,020,370 | MDY:40% | EDV:60% |
| 5/31/2011 | 18,347,774 | MDY:40% | EDV:60% |
| 6/30/2011 | 3,521,174 | MDY:40% | EDV:60% |
| 7/29/2011 | 1,622,226 | MDY:20% | EDV:80% |
| 8/31/2011 | 894,833 | ILF:60% | EDV:40% |
| 9/30/2011 | 1,128,693 | ILF:60% | EDV:40% |
| 10/31/2011 | 1,479,785 | ILF:70% | EDV:30% |
| 11/30/2011 | 6,372,867 | MDY:50% | EDV:50% |
| 12/30/2011 | 3,949,739 | MDY:50% | EDV:50% |
| 1/31/2012 | 10,795,929 | MDY:50% | EDV:50% |
| 2/29/2012 | 8,223,102 | MDY:50% | EDV:50% |
| 3/30/2012 | 20,671,879 | MDY:60% | EDV:40% |
| 4/30/2012 | 12,839,780 | MDY:50% | EDV:50% |
| 5/31/2012 | 9,075,860 | MDY:40% | EDV:60% |
| 6/29/2012 | 18,802,943 | MDY:40% | EDV:60% |
| 7/31/2012 | 35,603,872 | MDY:40% | EDV:60% |
| 8/31/2012 | 27,621,735 | MDY:50% | EDV:50% |
| 9/28/2012 | 29,739,658 | MDY:60% | EDV:40% |
| 10/31/2012 | 15,759,999 | MDY:70% | EDV:30% |
| 11/30/2012 | 10,719,906 | EPP:80% | EDV:20% |
| 12/31/2012 | 10,106,139 | EEM:90% | EDV:10% |
| 1/31/2013 | 18,216,561 | MDY:60% | EDV:40% |
| 2/28/2013 | 30,277,476 | MDY:60% | EDV:40% |
| 3/28/2013 | 42,608,396 | MDY:60% | EDV:40% |
| 4/30/2013 | 36,386,630 | MDY:40% | EDV:60% |
| 5/31/2013 | 12,729,678 | MDY:50% | EDV:50% |
| 6/28/2013 | 384,985 | MDY:1.0% | EDV:0% |
| 7/31/2013 | 3,041,581 | MDY:90% | EDV:10% |
| 8/30/2013 | (28,454) | MDY:1.0% | EDV:0% |
| 9/30/2013 | 9,587,745 | IEV:90% | EDV:10% |
| 10/31/2013 | 8,459,121 | IEV:90% | EDV:10% |
| 11/29/2013 | 7,618,120 | MDY:50% | EDV:50% |
| 12/31/2013 | 7,778,803 | MDY:70% | EDV:30% |
| 1/31/2014 | 2,932,185 | MDY:50% | EDV:50% |
| 2/28/2014 | 16,463,518 | MDY:30% | EDV:70% |
| 3/31/2014 | 36,435,148 | MDY:30% | EDV:70% |
| 4/30/2014 | 41,896,899 | EPP:70% | EDV:30% |
| 5/30/2014 | 54,623,716 | IEV:70% | EDV:30% |
| 6/30/2014 | 36,654,012 | EPP:80% | EDV:20% |
| 7/31/2014 | 32,905,840 | MDY:50% | EDV:50% |
| 8/29/2014 | 57,532,147 | MDY:50% | EDV:50% |
| 9/30/2014 | 5,203,244 | MDY:30% | EDV:70% |