Logical Invest
Investment Outlook
December 2018
The graph below is from a recent Bloomberg article entitled “A Brutal Global Market in 2018 Has Just One Champion“.
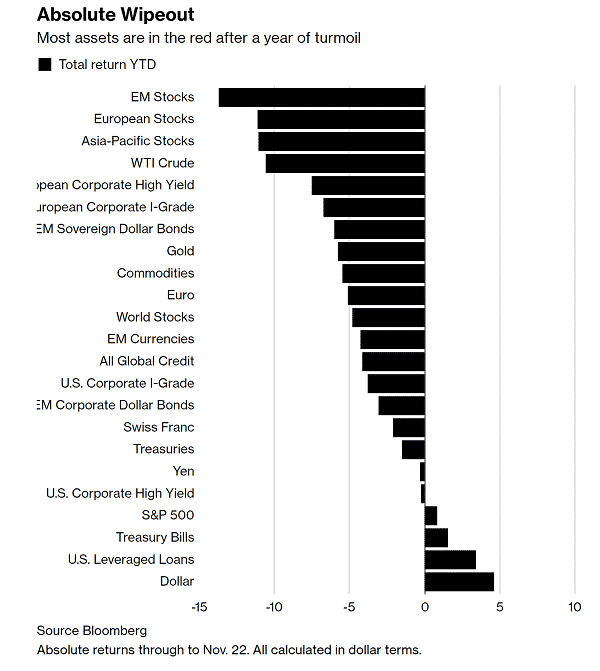
That one champion, according to the article, was Treasury bills. It goes on to say: “By one simple measure, this is the worst cross-asset performance in more than a century“. Below you can see 89% of all assets had negative performances year-to-date (as of Nov. 22).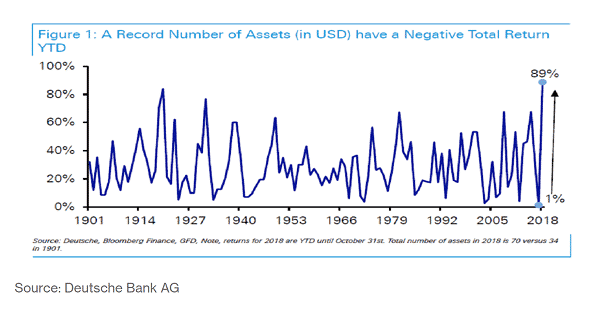
This may be an exaggeration but it goes to show we are in a difficult market. Volatility is twice what it was last year, most assets are negative or flat and the U.S. dollar (cash) is king.
A notable exception of NASDAQ 100 which is doing quite well for the year.
November proved to be a recovery month. All our strategies, but one, had positive returns. Leading were the NASDAQ 100 with +5.79 %, the U.S.Sector with +2.54% ,World Top 4 with +1.84%. The negative performance came from our Bond rotation Strategy at -0.52% for the month.
Changes at Logical-Invest
- Patrick Hill joined Logical Invest as a new partner. He is a technology veteran and a long-time Logical Invest user.
- A new home for our subscribers: http://logical-invest.com/app.
- A new personalized monthly email. It will contain your monthly allocations (“signals”) based on the portfolio you set up as “My Portfolio”.
- New CORE ‘1-click’ portfolios that are easy to setup.
- New pricing.
If you are an existing LI subscriber, please set up “My portfolio”.
This will ensure you will get consolidated signals emailed to you based on your portfolio. Don’t worry, you can always change it at any time. All of the new allocations will also be available on the web site the morning after the end of the rebalance period.
Our new Web-app – Understanding why we use backtested data
Our new ‘home’ is a place to evaluate current strategies and design new portfolios going forward. The data we use is backtested data based on the latest strategy parameters. The reason we do that is to be able to see how each strategy would have performed at current parameters so that we can then combine them into a portfolio. In essence, our new tools are forward looking tools that help build a portfolio. They are not tracking tools and should not be used to monitor your current strategy or portfolio performance.
Let’s take an example of using backtested data vs historical data:
Our first implementation of the Universal Investment strategy, had only two possible allocations: SPY and TLT, the equity and Treasury ETFs. Through the years, as the market changed so did UIS. It can now allocate to GLD (gold ETF), as well as to an inverse sector sub-strategy.
Let’s say we want to combine the current UIS with the Enhanced Permanent Portfolio (ie the BUG) strategies into one portfolio. Both strategies now use GLD.
First, we need to analyse the performance data of UIS vs the performance data of the EPP strategy. This analysis would take into consideration risk/reward and correlation of the two strategies. It should use the latest backtested data that reflects UIS allocating to GLD. If instead we used historical performance data, the data would include a long period where UIS did not allocate to GLD. This would result in a (false) lower correlation between the strategies. In other words, UIS and EPP used to be more different. They are now more similar. Using historical data would be misleading and would result in a portfolio with higher than optimal portfolio exposure to GLD.
Understanding why we tweak strategies: The NASDAQ 100 strategy.
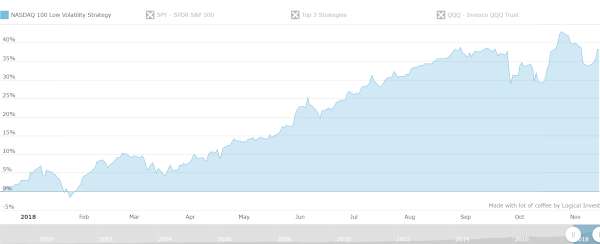
From inception the NASDAQ 100 strategy was comprised of two sub-strategies: The NASDAQ 100 low volatility and the NASDAQ 100 leaders, a more aggressive version. Depending on the market, it would pick the best of the two for next month’s rebalance.
In mid-2016 we simplified so the NASDAQ 100 stopped using two sub-strategies and got more ‘balanced’ parameters. It just picked 4 NASDAQ stocks. Starting in July 2018, the NASDAQ 100 was reset again to use the two sub-strategies (see our July 2018 strategy update).
Some quants may say that changing parameters should not be done. But experienced traders will tell that what used to always work needs to be adapted and tweaked for it to keep working. Strategies need to be updated, researched and re-evaluated as the market changes. Not often but they do.
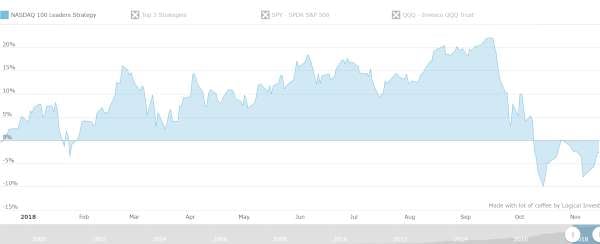
As you can see from the graph, picking the low volatility component in July was a good idea.
While the N100 Leaders sub-strategy did not do as well.
New CORE portfolios
These are 3 ready-to-go portfolios that can be set up easily. Pick one, save it as “My Portfolio” and you are good to go.
Behind the scenes, we use an optimization algorithm that looks at all our strategies and finds which combination gives the best results given some volatility constraints. We pick a maximum of 4 strategies. We use a multi-year lookback period so the allocations to the strategies do not change often. If a CORE strategy invests 30% in NASDAQ 100, 30% in UIS and 40% in Bond Rotation, this allocation will stay fairly static. What causes the monthly rebalance are the underlying strategies changing allocations.
Strategy-of-Strategies
In contrast to a portfolio that changes allocations every 6-months or a year, a strategy-of-strategies evaluates and changes the underlying strategies themselves. Our Top 3 strategy is such a strategy.
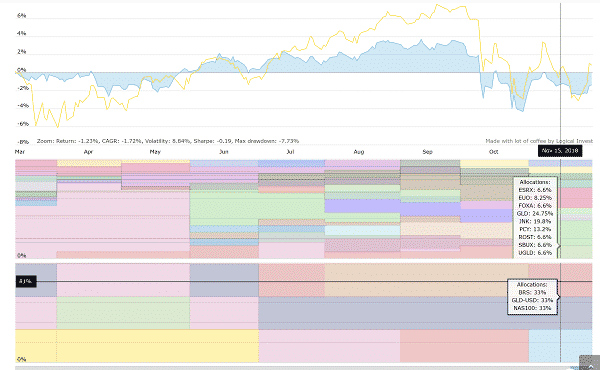
In our new chart you can see the Strategy allocations as well as the individual ETF/Stock allocations:
New Pricing Tiers:
CORE portfolios @ $50/month
Some investors want an advanced portfolio based on our strategies but lack the time to research, test and build one from scratch. Our new CORE portfolios represent a ‘1-click’ solution, optimized by LI. The lower price reflects the fact that you can see the aggregate allocation of the portfolio but not the allocations of the individual strategies.
All-Strategies @ $100/month
This is our ‘base’ product offer. We like to research and build strategies. We feel that the best way to use our services is to subscribe to all our research and then use a customized model or even discretion to decide on how to combine them for your own account(s). This subscription covers access to all our strategies/all portfolios/strategy of strategies, current and future. You get to use our pre-build portfolios, customize them, add/subtract strategies/ETFs or create your own portfolios from scratch.
QuantTrader @150/mmonth Retail (@500-750/m for RIA’s/Managers )
QuantTrader is our desktop software. If you are looking to create a new Commodity momentum sub-strategy or create different portfolios for different clients with different risk profiles, QuantTrader is up to the task. It comes with all our strategies pre-set but allows you to tweak parameters. It allows you to build new strategies from scratch. You can import your own assets. And of course you can easily combine all strategies and sub-strategies into new, fully custom portfolios that can be backtested and easily implemented.
Free @ $0/month
Register to create and backtest your own combination of ETFs. Use the Portfolio Builder and backtest the all-time-classic static Permanent Portfolio strategy: 25% GLD, 25% TLT, 25% SPY and 25% Cash.
Why we discontinued single-strategy subscriptions
Single strategy subscriptions created an administrative burden. Each strategy became a paid subscription item with it’s own set of administrative overhead. Eliminating these sets us free, so to speak, allowing us to develop and share more strategy ideas for one flat fee.
The road to a community
Logical Invest started out with a few simple strategies that you could subscribe to. It grew to 10 core strategies and from single-strategy solutions to a platform of creating multi-strategy portfolios. The next logical step is to enrich our breadth of strategies but also connect our community of subscribers many of which are experienced traders and professionals.
A very interesting strategy came from our long time user Tom Gnade. He implemented and published an article describing his own strategy-of-strategies, called the Morpheus ETF strategy. Build on QuantTrader, it consists of two sub-strategies, the “Blue Pill”, a bond-based strategy or to the “Red Pill”, an equity-based one. This made a lot of sense and we had subscribers asking to reconstruct it. Tom was kind enough to help but we had no way to set it up or intervene in Tom’s work. What instantly came to mind was creating a playground / library where users could share and further develop their own strategies or portfolios.For us at LI this would post ‘unofficial’ strategy ideas, alternate versions, etc.
Our new setup together with the continued development of QuantTrader, will allow to create the space for new ideas to be implemented, viewed and easily shared.
We wish you a prosperous rest of 2018.
Visit our site for daily updated dashboard.
Symbols:
BRS – Bond Rotation Strategy
BUGST – A conservative Permanent Portfolio Strategy
BUGLEV – A leveraged Permanent Portfolio Strategy
GMRS – Global Market Rotation Strategy
GMRSE – Global Market Rotation Strategy Enhanced
GSRLV – Global Sector Rotation low volatility
NASDAQ100 – Nasdaq 100 strategy
WORLD-TOP4 – The Top 4 World Country Strategy
UIS – Universal Investment Strategy
UIS-SPXL-TMF – 3x leveraged Universal Investment Strategy
AGG – iShares Core Total US Bond (4-5yr)
SPY – SPDR S&P 500 Index
TLT – iShares Barclays Long-Term Trsry (15-18yr)