Home › Forums › Logical Invest Forum › Misc
- This topic has 62 replies, 22 voices, and was last updated 6 years, 11 months ago by
Mark Vincent.
- AuthorPosts
- 06/04/2015 at 2:57 pm #35700
Alex @ Logical Invest
Keymasterwill bundle misc topics here for housekeeping
06/04/2015 at 2:57 pm #25398gselsidi
ParticipantI posted this in the UIS 3X leveraged, before i found the forum.
1. Can we back-test a strategy where instead of going long treasuries we go short the SPY?
So either something like UPRO for 3x long S&P and SPXU for 3X short S&P.2. A Physical rotation strategy, is it possible to develop a strategy where you are physically buying/selling a commodity for example such as gold, silver, oil?
The reason for strategy one is at one point in time the world will lose faith in the United States, and there might come a time where both equities and bonds both go down together. We can see turbulence in the bond market starting now.
The reason for strategy 2, would be a loss of confidence in the worlds financial system. This does not have to be a doomsday scenario where the world never sets up a global financial system again, because they will. It’s for a scenario where a total temporary collapse occurs, and your assets may be completely lost or confiscated as we have seen in Cyprus and soon to be many other countries.
A physical only type of system, would remove the risk of having your accounts in someone Else’s hands, for if a worst case scenario happens.
Thanks,
Elsid06/29/2015 at 3:54 pm #27588Anonymous
InactiveI would like to see an aggressive MYRS using XIV. I would assume it would be like a 2x or 3x leverage version like the UIS strategy using SPXL.
06/30/2015 at 4:24 am #27594KeymasterGselsidi, thanks for the proposals, appreciated!
We are doing some work on a commodity strategy, specifically precious metals as you mention. However so far our analysis shows this would rather be used to complement an existing portfolio with a smaller percentage, than being a main driver of growth. Reason is that the equity lines from our tests do not show a reliable smooth growth path, but rather “years of opportunity” which then fade again, thus making it more feasible as an opportunistic mix rather than a constant adder. This is also the reason we have not published anything in this respect so far. Another issue is that some commodity markets suffer from roll-effects created by the underlying future markets, for example the oil market since prices went south last year, so it’s harder for our momentum algos to detect the underlying long lasting trends.
On your proposal to use a short SP500 instead of bonds, this is a bit tricky to implement. Recall that our “crash protection method” relies fundamentally on the “save havens” which receive the money flow in crisis time. A strategy where you go long SPY when risky assets show a positive tendency and shift into short SPY when things go down might make sense as a rotation concept (inverting momentum), but does not offer any crash protection as itself. Another argument against shorting risky assets is that long term markets go up, thus by betting on falling prices you always loose – longer term.
I really appreciate your ideas and not arguing against them – just trying to show some of the results from similar tests so far. Hopefully we can discuss further and come over these hurdles jointly in our discussion.
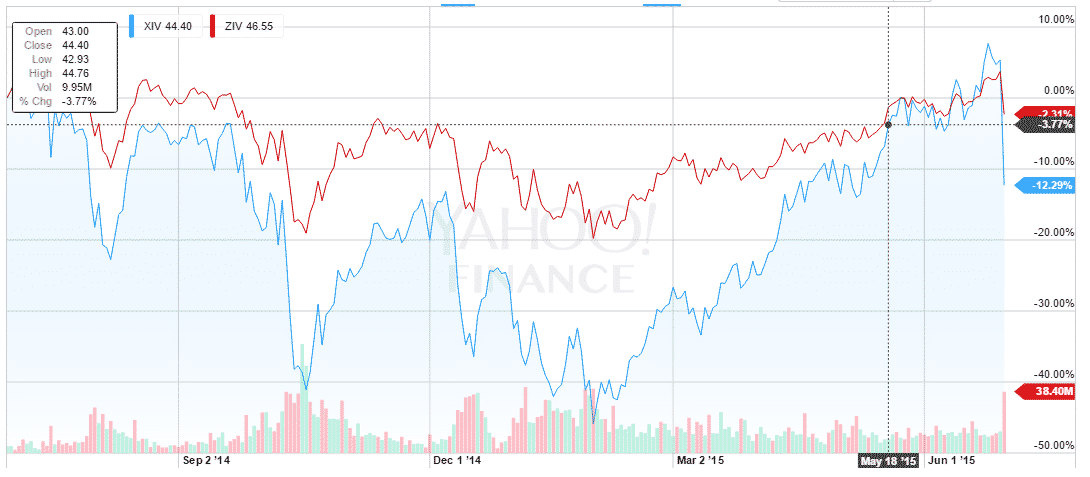
06/30/2015 at 4:38 am #27596KeymasterDeshan, compared to ZIV, the 4-7m inverted volatility, XIV, first month inverted volatility is drastically more volatile with some rather erratic price movements within a month timeframe, see below. This makes it little useful for “lazy” monthly or bi-monthly rotation strategies like we normally use. There are other blogs offering highly aggressive Volatility strategies on weekly or even daily mode, have a look at our blogroll.. Also keep in mind that we’re using inverse volatility more for harvesting the “frear premium” from the contango, than for the VIX price swings, and this effect is much stronger on the right half of the VIX term curve, e.g. ZIV.
 10/01/2015 at 10:12 am #29869
Michel Alvarez-Correa
ParticipantIs there a statistical way to measure objectively the degree of curve fitting of any model? Can one grade from 0-10, objectively, how curve fitted a model is? I understand that the more historical data the better; the more variables introduced into the model, the more curve-fitted. But I have yet to read about an objective statistical way to measure curve fitting. In the case of all your models, which show great simulated historical results, to what degree can we know that those results will hold in the future?
Thanks,
Michel10/08/2015 at 9:10 am #29985Jeroen
ParticipantHow about a “Go With The Flow” Strategy?
Looking at the ETF Fund Flows reports at http://www.etf.com/etfanalytics/etf-fund-flows-tool I saw that their ETF Fund Flows data is available (see http://www.etf.com/etfanalytics/etfcom-data-products ). I wondered if the analysis of the flow of investors money into and out of different ETF classes might be an interesting ‘external’ source of information to build a strategy from. By external I mean not based on the actual price/performance, which all of your existing strategies are if I am correct.
A quick search on Google showed that Deutsche Bank has published some promising research last year (14 May 2014): https://etf.deutscheawm.com/ESP/SPA/Download/Research-Global/16bfe77d-5e4c-48ab-adf6-0b0c50a8b6d0/Special-ETF-Research.pdf
In fact it appears that since then they have published monthly updates to their TAARSS rotational strategy, here is the latest (5 October 2015) update, which also contains additional details of their methodology:
http://pull.db-gmresearch.com/cgi-bin/pull/DocPull/1537-486C/91714753/0900b8c08a3de0f1.pdfI would be very interested if you would add such a strategy.
11/02/2015 at 10:59 pm #30445ParticipantHi Alex,
Yes I wasn’t saying this is right or not. Was just throwing some ideas out and if you guys could look into those suggestions, and see how they perform. Another idea with a commodity strategy might be something where it’s all physical all the time, never transferring into cash.
An example, of something like this would be trading the Gold/Silver ratio against each-other, this of course wouldn’t be your whole portfolio unless you so desired, but a 5-20% allocation.
Trading the ratio against eachother would help you double or even triple “returns” as you end up accumulating more of the metals overtime as gold or silver become overvalued or undervalued to each-other. This of course is clearly a long long term investment strategy, just something I think should be examined given the current climate.
Look at what happened in current day Germany during WW1 1oz gold went from 170 Marks to 88 TRILLION Marks!!!!!! We don’t know who the next Zimbabwe, Argentina, Germany, will be, could be the whole world for all we know. Given recent world governments actions to just confiscate private assets from people to bail in institutions would make it worth-while for a successful strategy in something physical as a form of insurance.
Just my thoughts on some ideas that have been running through my mind.
Best,
Elsid11/02/2015 at 11:06 pm #30446ParticipantQuick questions about the posted Annual strategy returns. Are these true returns? What I mean by this is.
If I invest $100,000 and lost -20% now I’m at $80,000 and made 30% which brings me to $104,000.
If we just go by the % you would think you are up 10% (-20%+30%), but in reality you are only up +4%.Apologize for the silly question just wanted to be sure about the returns shown.
Best,
Elsid11/12/2015 at 10:18 am #30575trr
ParticipantI understand that trend following strategies are vulnerable to losing their effectiveness on account of too many market participants getting wise to them. (See for example articles on the “Price Action Lab Blog” or Jim Simmons’ March 2015 Ted interview.) How vulnerable do you see the various Logical Invest strategies to this problem?
12/19/2015 at 6:50 pm #30941sfreewell
ParticipantAlexander
I understand that next month you’ll introduce your currency-hedged Gold strategy that plays Gold against other major currencies.
I’ve been interested in the same thing sort of thing as I’m a dollar based gold investor that has seen my investment struggle
while non$ based investors in gold are having a better time of it.I’m considering holding a gold position in other currencies, and am looking forward to your strategy. In the meantime,
I was wondering what the mechanics of such a trade would entail. I imagine that I’d put on a short fx position equal to my
gold long position. But when I do that in Euros for example, I don’t get the same results when I compare the p&l with a
chart of gold priced in euros. I don’t know if I’ve explained this well enough, but any suggestions on what I might be doing wrong
would be greatly appreciated.12/20/2015 at 10:03 am #30942Frank Grossmann
ParticipantIn the strategy we will propose to use double leveraged forex positions. This works better because the volatility of these ETFs (EUO, CROC, YCS) matches about the GLD volatility.
01/31/2016 at 3:55 pm #31790InactiveThe way oil has moved over the past few years has been incredible. It tends to trend very well in whatever direction it goes. Seems like this type of product could easily fit into LIs algorithms. Could UWTI or any other oil tracking ETF product be reviewed to take advantage of current market movements?
02/01/2016 at 3:43 am #31798ParticipantThe problem with investing in oil using ETFs is the strong contango of oil futures. Today it is at about 8$ per year. This means that even if the spot oil price goes up 25% during a year, the ETF is still flat or even slightly negative. In fact you could always make a lot of money by shorting oil ETFs, but not by going long oil. Oil is very volatile. Prices can make huge unpredictable jumps on political or terror events. I tried to backtest strategies with oil ETFs, but I was never able to achieve good results.
07/13/2016 at 4:32 pm #34479Jason
ParticipantAre there any plans for API access to the strategy subscription? As I am trying to use 3-4 of the strategies it’s getting difficult and time-consuming to do the re-balancing work every month (or every 2 weeks in some strategies). API access would really make things easy so I can script the fetching of the strategy update, auto re-balance and perform the trade programatically. Tks.
07/15/2016 at 11:22 am #34513evan.pease
ParticipantHi, it looks like the spreadsheet for June 15th was posted by accident instead of the one for July 15th?
https://logical-invest.com/blog/strategy-signals-consolidated/
Thanks,
Evan07/22/2016 at 1:22 pm #34607aw
Participant+1
07/25/2016 at 6:45 am #34649Vangelis
KeymasterThank you for your feedback. There are no plans for API access at the moment but we do see how this could help many of our clients. We will look into this.
We do license our full QuantTrader software to select professional clients so they can generate our signals in-house.07/25/2016 at 6:52 am #34650KeymasterHello Evan,
We answered via email but I will post the answer here too. We publish after the close (ie July 16) so you are still looking at the June 15th excel that was erased once the new signal are posted.
Regards,
Vangelis08/02/2016 at 3:03 am #34789ParticipantHi guys,
Thanks for the awesome service.
On the spreadsheet for August 1, the last row for MNST was not populated for the columns used to calculate the allocations (at least for me). I fixed it manually but wanted to let you know.
Thanks,
Evan08/02/2016 at 5:55 am #34790KeymasterThank you for the feedback Evan. It’s been corrected.
09/28/2016 at 5:04 am #35701KeymasterWe´re working on an automated solution using separately managed accounts, this will be interesting for followers too busy for manual rebalancing.
09/28/2016 at 5:06 am #35702KeymasterTim, we do not expect our strategies loosing their edge because of too many people trading it, the volumes are just too big than our community moving the market.
09/28/2016 at 5:08 am #35703KeymasterHi Elsid, yes, we´re considering the compounding of percentages, that is, we would also show 100k * 0.8 * 1.3 = 104k or 4% gain.
09/28/2016 at 5:13 am #35704KeymasterHola Michael,
I´m not aware of any objective statisctical way to measure the degree of curve fitting. Maybe the confidence ranges of a Monte Carlo Simulation would be such a measure? For me the ultimate measure is the performance in live trading, which sadly you only know after the fact and some years.
09/29/2016 at 3:43 am #35725Trent
ParticipantHello there, I have recently subscribed for 12 months & am impressed with the quality of your approach and service. I trade from Australia and my main concern is how to best manage the currency wildcard that awaits me. I am not asking for financial advice, however I would be interested how you & your partners manage your currency risk. One thought I had was to use a balancing rotation system similar in concept to the UIS system to monthly adjust the ratio of AUD/USD. I use Interactive Brokers with margin facilities & have access to futures, forex, options etc. but am unsure what method and vehicle would be most effective. I would appreciate some experienced thoughts on the matter. Many thanks, Trent
09/29/2016 at 3:10 pm #35739KeymasterMy thoughts:
Case A:
According to my Banker one should benchmark everything to their own native currency. In your case that would be AUD. The logic is that one should benchmark to their cost of living. So if you hold dollars, you are exposed to “currency risk”.
If you subscribe to that point of view, you have two possibilities:1. Your IB account base is $US
2. Your IB account base is AUD.If your account is based in $U.S., then you could hedge your currency risk by buying AUD/USD to cover all your funds and trade normally in $$. So if you had a $100,000 account you would buy $100K worth of AUD/USD (or use futures if you don’t want to get IB’s confusing accounting) and take the signals as they are. These would give you two main factors driving your account: Strategy performance and currency performance.
Basing your IB account in AUD is something I would not really be familiar with.
Case B:
You do not want to base your benchmark on your local currency but want to manage currency as a whole.
Assuming you have multiple accounts, you could aggregate currencies.
Example:
You trade 100K in IB with LI strategies.
You also own a bond worth 100K of AUD in your local bank.Roughly your currency split is 50/50 USD and AUD. Now you have to manage this :)
You can either do it discretionary (ie, subjectively) or develop a long term system that will re-balance your currencies. Either case you would use IB and futures or fx to increase/decrease currency exposure.11/02/2016 at 1:12 pm #36536Michael Puchtler
ParticipantHave any members used out of the money covered calls to supplement the strategy signals? If so, can you share your experience, lessons learned, and guidance? Obviously you stand to lose out in a strong uptrend; yet would benefit in a downtrend. I’m curious to learn if others have tried this, and to what success.
11/03/2016 at 4:35 am #36538ParticipantIn fact adding option strategies to strategies like UIS (SPY-TLT) or BUG (with SPY-TLT-GLD) is a very good strategy during sideways markets. You can do only covered calls, or you can also sell wide OTM strangles (about Delta 10) on GLD and TLT. The only thing not to do is to sell naked puts on SPY because SPY has a big downside risk. If you sell a strangle on SPY, then always add a protective put to limit the downside. Best is to do it so, that you do not have any downside risk but only upside risk which is acceptable because the risk of a SPY upside crash is extremely small.
The nice effect of such a option strategy on SPY TLT and GLD is that the underlyings have low to negative correlation. Even if you would once lose with one of the options strategies, you would still have a high chance to win on the two others.12/22/2016 at 10:28 pm #37231Howard
ParticipantI am trying to construct the portfolio for 2017 using ~3 strategies. While the custom portfolio tool is very helpful and powerful as it shows us the model risk/return of various strategy composition, I am trying to get a better understanding on the p&l driver for each strategy, i.e., what market will make a strategy works and what environment will make it not work as well until market normalizes. I have read the white paper, and read some of the forum posts, but would love to hear your advice on how best to get a better understanding on this.
For instance, 2015 was a tough year for various strategies given the macro events that drove volatility, especially the August 2015 cny depreciation sell off. Why is that? Is that because such events make momentum gauging difficult? I remember Alex mentioned that in one of his responses. But would love to hear your thoughts further. 2017 could be a bumpy ride given rates vol, various geopolitical events coming up etc.
Good luck investing in 2017!
Thanks,
Howard03/22/2017 at 6:17 pm #39688StFrons
ParticipantBeing new to the LI methods and the forum I am wondering if anyone are using any particular execution strategies? From what I can see there is not a lot of talk about this, apart from the general idea of rebalancing being done within one or two days after receiving the signals. This seems a rather large window with a fair bit of fluctuation(?). Is it worthwhile trying to optimize execution with these fluctuations in mind, or will the risk of not being filled within the given time frame be to big?
03/22/2017 at 6:44 pm #39689KeymasterHello StFrons, welcome to the Logical Invest family!
Several subscriber have a deferred retirement account without margin, where transactions are only settled after 3 or more days. This is mostly the biggest topic of discussion and concern.
Other than that we do recommend to trade at open after the trading signals are received. But this is more to create a monthly habit, our backtests do not show a significant (>0.5%) deviation in returns if traded within 2 days.
Execution is a big topic, it is important to use limit orders – or adaptive algos like Interactive Brokers offer – to reduce slippage and get good fills. But again, timing is rather on hour or day level, not minutes.
Hope this answers, happy to further elaborate,
Alex03/30/2017 at 4:37 am #39947rio chang
ParticipantHi all,
I am very new here as I have just subscribed to LI only a month ago.
My current meta strategies consists of NASDAQ100, MYRS, UIS 3X, GLD-USD.
I understand the concept behind rebalancing once every month, but do we want to set stop loss for each stock/etf just in case if something unexpected and really bad happens before the next signal becomes available?
Thanks!03/30/2017 at 7:25 am #39951ParticipantI studied all possible ways of stop loss limits, and the conclusion is, that whatever you do, it lowers the return of the strategies. The simple reason is, that you have a lot of up and down spikes during each month. Most of them can be considered as pure noise. They have nothing to do with the general trend of these ETFs, however they are strong enough to trigger the stop loss limits.
But once you sold, what can you do then? Reinvest in the ETF which is best at this moment?
If you do this, most of the time you realize a loss by selling low and you buy back high. This is the typical “sell low, buy high” strategy which many inexperienced investors are using.
The use of stop loss limits may be good for trading highly volatile single stocks, but it is the worst thing to use, if you trade ETFs which follow longer lasting economic cycles.03/30/2017 at 10:55 am #39978ParticipantThank you for your prompt reply and explanations!
05/09/2017 at 5:56 am #41448InactiveHi all,
Im having a look at your interesting services and I have a few questions concerning your strategies1) I really dont get the logic behind “monthly rebalance”.
I think it should be better to rebalance “when needed”, eg. according to momentum, etc (weekly RSI, weekly MACD crossover, ..)2) Many of your strategies are diverging from backtest historic performance since live. Overfitting?
3) Any advice on tax impact on BRS for a swiss investor (I see that Mr Grossman lives next door to me)
4) Any chance to have the Excel portfolio builder compatible with LibreOffice?
KR
05/09/2017 at 8:04 am #41456ParticipantGrüezi KR
1)Rebalancing “when needed” is used mainly for old style investing. You wait for example until some asset crosses the 200day moving average and then you sell the whole asset. This way to invest is not really good because you always wait until something gets bad and then you realize loss. Our strategies will rebalance even if the owned ETF is still doing quite well if there is another ETF which is doing better. Also we change allocations gradually when the market changes and this has to be done in regular intervals.
2)The main reason is the up and down of the market 2015/2016. Each time the strategies go to risk off mode and then have to go back if the market recovers. This is in general bad for such strategies. If however once you are not lucky and don’t have an immediate recovery, then you are safe with a strategy which switched in risk off mode.
3)Unfortunately you lose 1/3 of dividends due to the US witholding tax which adds up to 1-2% per year.
4)No, we need special Excel formulas and macros05/09/2017 at 11:27 am #41468InactiveGrüezi Frank )
> 1)Rebalancing “when needed” is used mainly for old style investing. You wait for example until some asset
> crosses the 200day moving average and then you sell the whole asset. This way to invest is not really good
> because you always wait until something gets bad and then you realize loss.Well, we can switch ETF when the current one is leaving weekly RSI overbought area or similar rule.
The point is not the rule but the choice to rebalance at every month last date and not, for example, once a month but on the “””best””” date according to strategy rules.> Our strategies will rebalance even if the owned ETF is still doing quite well if there is another ETF which is doing better.
Good. Same point. Why not doing this once a month but on the date ETFB surpasses ETFA performances?
> 2)The main reason is the up and down of the market 2015/2016. Each time the strategies go to risk off mode and
> then have to go back if the market recovers. This is in general bad for such strategies.Well, 2010-2017 has been a quite long uptrend in the market.
Would your strategies survive to a 2003-2006 period?Kind Regards
Luke05/09/2017 at 12:44 pm #41469John McLean
ParticipantI am using Google Sheets with just minor modifications for the Spreadsheet. You just have to change the formulas for retrieving price data. Otherwise seems to work just fine.
07/10/2017 at 9:40 am #43340ParticipantWould it be ok to change the meta strategy each time we do rebalance based on how good or bad each strategies does for the previous month?
for example, if this month I am running a combination of 25% nasqad100 / 25% 3xUIS / 25% MYRS / 25% BRS for my meta strategy, however since Tesla got a big hit and lost 14% this month, should I change the nasqad100 % allocation or even swap to other strategy next month based on the performance?Or should I keep exactly the same strategy and allocation to avoid “buy high sell low” situation?
Thanks!
07/14/2017 at 3:48 pm #43838ParticipantWould it be ok to change the meta strategy each time we do rebalance based on how good or bad each strategies does for the previous month?
for example, if this month I am running a combination of 25% nasqad100 / 25% 3xUIS / 25% MYRS / 25% BRS for my meta strategy, however since Tesla got a big hit and lost 14% this month, should I change the nasqad100 % allocation or even swap to other strategy next month based on the performance?Or should I keep exactly the same strategy and allocation to avoid “buy high sell low” situation?
Thanks!
07/19/2017 at 5:41 am #43913ParticipantNo, I don’t think it makes sense to change the meta strategy allocation each month. The problem is that if you would for example change from the Nasdaq 100 strategy to a safer strategy like Bond Rotation, then you profit only half if there is a recovery. It’s like selling half of your Nasdaq100 allocation and go to cash. This means that you realize a loss with no chance to recovery. The Nasdaq 100 strategy had a lot of such one month draw downs but it had even more really big monthly gains with single stocks surging 20% or more.
However due to the high valuation of the Nasdaq100 and the normally underperforming summer period I would not invest too much in the Nasdaq100.07/19/2017 at 7:54 pm #43947ParticipantThank you for your clarification and advise!
08/16/2017 at 7:43 am #44668Keymastersee reply here: https://logical-invest.com/forums/topic/another-newbie-question/
08/16/2017 at 7:44 am #44669KeymasterYou can now use the “consolidated signals” functionality of QuantTrader to calculate number of shares. See: https://logical-invest.com/forums/topic/quanttrader-software-updates/
08/16/2017 at 7:51 am #44670KeymasterHi Howard,
all of our strategies use medium-term trends, e.g. momentum in prices, volatility and cross-correlation within a normally 20-80 days window. Macro-events like the Chinese sell-off in August just make it difficult to detect these underlying trends, e.g. when markets are choppy there is not much of a trend.
For that purpose we always include hedging instruments like bonds, currencies and commodities in our strategies. In good times they add some performance, in bad times they minimize the impact of the corrections in equities.
Most important is: Never try to predict or time the market. With the benefit of hindsight of your comment made some months ago: Who would have expected such a strong equity market with so much complacency with volatility being below or around 10 in most of 2017?
09/02/2017 at 12:20 am #45176mlipsman
ParticipantThe return percentages you show in your tables aren’t what most of us will actually realize unless we sell our entire position each time we rebalance and then buy back the new allocation. Instead, our buy price for each symbol will be the average of all the buys and sells we’ve done so far, which becomes increasingly cumbersome to calculate as time passes and new buys and sells have to be accounted for in calculating our average cost. Is there an easier way to do this, even if it’s a good approximation rather than an exact figure? Within .5% or so would be fine. I’d just like to know if I’m winning or losing each time I rebalance, and by approximately how much.
09/02/2017 at 4:54 am #45177reuptake
ParticipantActually the prices are closing price from the day BEFORE we get signals, so it’s impossible to achieve the same results.
09/02/2017 at 2:36 pm #45192ParticipantOK, but I’d still like to know if there’s an easier way to calculate it than figuring an average cost based on all previous buys and sells of that symbol.
09/02/2017 at 8:30 pm #45194KeymasterHi mlipsman, You´re normally interested in the return over a certain time period, let´s say since you started investing in a strategy, or since beginning of the year. This is why we publish the strategy returns YTD, 12 months, etc. In the charts you can even set your own time frames and see the return. For a portfolio of strategies you can do the same in the Portfolio Builder.
These returns always consider the dividend adjusted and fully re-invested (compounded) performance, and the varying allocation to the underlying ETF. Therefore they considers the average price you realized since a certain point in time. From that perspective it is not relevant if you calculate returns as re-balancing only the needed shares, or complete sell and re-buy (excluding transaction costs, which would hit you more if you did the latter).
So when looking at your portfolio since a certain time, and trying to match your performance to what we report, just take the compounded return over that period, and you see it will match – with a slight +/- due to different execution prices and transaction costs.
Not sure if I got and answered your point, if not please let me know.
09/02/2017 at 8:38 pm #45195KeymasterHi reuptake,
think we had this topic before, so same answer. Yes, we use same-day-close prices to calculate our signals and performance – and indeed our signal subscribers can only execute at next open – which indeed leads to small variances.
But as stated before, according to our backtests this variance in performance is in a range of +/- 0.5% p.a. – in some years even higher than what we report. As we´re advocating for a “lazy” monthly rebalancing within the first or even second trading day, we stick to the current way of reporting, which we feel is transparent.
If we´d use next-day-open prices for calculating performance, this would be not in line with the prices we use for cutting signals, not allow us to immediately report performance when we send out signals, and make things more complicated.
Lastly, and in big part to your request, our QuantTrader subscribers are able to cut signals and re-balance whenever they like – even intraday. Personally, being lazy by nature, I don´t do this, and also see no added value in my account.
09/03/2017 at 4:35 pm #45230ParticipantHi Alex,
I’m not sure if you answered it either, so let me try to clarify what I mean.
Suppose I have $10,000 in MYRS, which is at a 50/50 allocation. ZIV is $50, TMF is $20. I start with 100 shares of ZIV at $50 and 250 shares of TMF at $20. My average cost per share for ZIV is $50.
Two weeks later, ZIV is at $53, TMF is at $18, and the allocation goes to 60/40.
I sell 56 shares of TMF at $18 (=$1008) and buy 19 shares of ZIV at $53 (=$1007).
My average cost per share for ZIV is:
100 shrs @ $50 = $5000
+ 19 shrs @ $53 = $1007= $6007/119 = $50.48
Your charts would presumably show a symbol return of $(53-50)/50 = .06 = 6%
However, my return would be $(53-50.48)/50.48 = .05 = 5%Two weeks later, ZIV is at $47, TMF is at $23, and the allocation goes to 40/60.
I sell 21 shares of ZIV at $47 (=$987) and buy 43 shares of TMF at $23 (=$989).
My average cost per share for ZIV is:
100 shrs @ $50 = $5000
+ 19 shrs @ $53 = $1007
– 21 shrs @ $47 = $987= $5020/98 = $51.22
Your charts would presumably show a symbol return of $(47-53)/53 = -0.11 = -11%
However, my return would be $(47-51.22)/51.22 = -.08 = -8%So every time I rebalance, my average cost per share changes: it’s the total dollar amount of shares I’ve bought less the total dollar amount of shares I’ve sold, divided by the number of shares I have left. Your gain/loss is based on the change in price of 1 share. My gain/loss is based on the change in my average cost of 1 share compared to the new price and may not be anywhere near your figure.
What I’m wondering is if there’s an easier way to calculate (or approximate) my gain/loss without having to figure the average cost per share every two weeks or month, because the calculation gets longer each time.
Thanks,
Mark09/04/2017 at 6:21 pm #45260KeymasterYour calculations are correct from what I see, but our way is slightly different. Instead of calculating in avg dollar and share terms, we simply re-calculate an internal index by multiplying the % invested with the symbol return. The outcome is exactly the same, benefit of using avg dollar and share terms is that’s it more intuitive, but indexing is just simpler.
Attached an Excel sheet with the comparison of both following your example, I ignored full-shares requirement.
09/04/2017 at 9:34 pm #45262ParticipantGreat, thanks! I knew there had to be an easier way.
09/05/2017 at 9:42 am #45277ParticipantActually, looking at your spreadsheet more closely, it appears that the number of shares to own (cols F and G) is determined by the total investment (col J). But the total investment depends on the number of shares (times the price of each), and the number of shares depends on the total investment. So it seems a bit circular.
It looks like the procedure would be this?
1. Calculate performance (cols P and Q) based on the change in price (cols D and E).
2. Multiply performance this period by the investment last period to determine the updated total investment (e.g., J4 = Q4*J3).
3. Use the updated total investment to determine the new number of shares to own.09/05/2017 at 12:58 pm #45289KeymasterHi Mark,
yes, that is the best way to describe. Sounds silly, but performance at the end is what you have in your account divided by what you had in the prior period. The new shares to own is total account value multiplied by new allocation %, divided by share price. Sorry if the sheet made it look more complicated :-)
09/06/2017 at 1:24 pm #45318ParticipantThanks for the answer.
Could you maybe recommend what is the easiest way to measure the “real” performance of strategy? I’m using IB, and reports I can generate are bit overwhelming. And I’m under impression (which may be false) that almost all of the time I got significantly worse performance than one that is published on the website. Maybe there is some shortcut? Ready made Excel sheet would be great (in which one would enter buy/sell prices, allocation and get the performance). The impression of underperformance is because most of the time (again: it may be wrong) I got “worse” price than close price.
And another question: what should I do if I cannot trade during first days of some month? This will happen in November. I’m leaving for a 2 weeks of holidays in Mexico and I really do not want to take my laptop with me. I can trade on October 27th. Should I just get QuantTrader and trade earlier? Is there a possibility to get the signals earlier (QuantTrader is a bit of a hassle for me, as I don’t have PC at home).
09/17/2017 at 8:58 pm #45585ParticipantHi Alex,
Where on the spreadsheet would you account for money added to or deducted from the original investment? For example, in week 6, if you wanted to add another $10,000 or cash out a couple of thousand? It can’t really be added to the Total in column J, because that would skew the performance.
Thanks,
Mark09/18/2017 at 1:18 am #45587KeymasterHi Mark,
you just need to account for the add/withdraw in the performance calculation, so add or subtract both in the past and current period. See example below. Hope this is what you’ve been looking for.
10/04/2017 at 1:25 am #46111ParticipantHi Alex,
I set up your example in Excel, and it seems that it has the same problem of additions/withdrawals skewing the performance. For example, if you delete the 10000 in C4, the performance in E4 goes from 10% to 18%. Maybe I’m wrong, but I’d consider 18% the “real” performance, since the reduction to 10% occurs only if 10000 is added. To me, it seems that performance should be what the market gave us, not influenced by any additional money we invested or withdrew. Is there a way to account for the additions/withdrawals so that they don’t change the performance?
To give an analogy, if I’m a merchant and I buy a product for $1 and sell it for $2, I make a 100% profit. That’s my “performance.” It doesn’t matter if I invest $10 or $100,000 in a supply of the products to sell–the *amount* of my profit will change, but the percentage/performance remains at 100. Only if I start selling them for $2.50 will my “performance” increase to 150%–again, independent of how much I invest in having stock on hand.
So my question is, is there a way to separate the amount that we invest from the return that $1 produces from the investment?
Mark
10/04/2017 at 8:34 pm #46127KeymasterHi Mark,
not sure if I understand you, here an example:
1) With 10,000 in cell C4: You assume you added 10k to your account at the beginning of week 2, so account total is 21k. In week 2 you make 2k of capital gains, so your profit % is 2k / (11+10k) = 9.5% or stated differently 23k / 21 – 1 = 9.5%
2) Without 10,000 in cell C4: You did not add to your account, so now the 2k profit are from the 11k you had in your account originally, that´s 2k / 11k = 18% or 13/11 – 1 = 18%.
Important is in this setup the assumption that you add the amount at the BEGINNING of the new week, if you want to add at the END of week 1 then need to change the formulae a bit.
Above is a simple calculation, but basically the same banks do the math.
Hope this clarifies.10/04/2017 at 10:59 pm #46134ParticipantHi Alex,
OK, I see: we add the 10k at the beginning of the period, and the 2k is the profit we realize at the end. Because the Gain/Loss column in your example came before the Add/Withdraw column, I had thought it all took place in a single rebalancing, where the 2k is our profit from the previous period and then we add the 10k.
If we don’t add the 10k, then the profit at the end would be only about 1k instead of 2k, so it would still be 9.5%.
Thanks for clarifying.
Mark
05/10/2019 at 10:13 am #64046Mark Vincent
ParticipantNewbie question:
I don’t understand the following statement made by Frank: The optimizer changes the allocation for the metastrategy every month?
“No, I don’t think it makes sense to change the meta strategy allocation each month. The problem is that if you would for example change from the Nasdaq 100 strategy to a safer strategy like Bond Rotation, then you profit only half if there is a recovery. It’s like selling half of your Nasdaq100 allocation and go to cash. This means that you realize a loss with no chance to recovery. The Nasdaq 100 strategy had a lot of such one month draw downs but it had even more really big monthly gains with single stocks surging 20% or more.
However due to the high valuation of the Nasdaq100 and the normally underperforming summer period I would not invest too much in the Nasdaq100.”Cheers,
Mark Vincent - AuthorPosts
- You must be logged in to reply to this topic.