Home › Forums › Logical Invest Forum › Portfolio Builder
- This topic has 25 replies, 9 voices, and was last updated 6 years, 7 months ago by
UkiwiS.
- AuthorPosts
- 09/30/2017 at 3:56 pm #46002
Alex @ Logical Invest
KeymasterTo enhance the visibility, here a new thread. Please see former discussion here.
11/02/2017 at 4:47 pm #47227daniel morton
ParticipantHi Alex,
The VIX is very low bottom 1% since 1990 as I understand it. I have read Frank’s post about the difficulty in going long VIX. How will MYRS respond to an increase in the VIX and in what situations does MYRS not perform? thanks.
02/03/2018 at 10:06 pm #49798Mark Faust
ParticipantHi Alex,
I was trying to run portfolio builder on the website and noticed that it is not picking up the February trading days???thx
Mark02/04/2018 at 11:47 am #49818KeymasterYes, the data in the return table of the online builder is based on weekly data, so Feb will start showing up mid next week. For daily data look at QT, the strategy pages or the excel offline tool.
03/09/2018 at 9:10 am #50772trr
ParticipantCan I bring this comment from last August back to your attention –
“[The Portfolio-Builder web site] is very useful and a pleasure to use, but I’d like to echo Greg’s comment from a year ago: it would be even more useful if there were a way of excluding some strategies from the calculations. Perhaps a column of toggle-buttons added to the strategy table at the top of the page would do this neatly? I know this functionality exists in the Excel spreadsheet, and you are trying to keep this page simple, but it is far preferable to use this page than mess around with Excel.”
Thanks.
03/10/2018 at 1:19 am #50780Patrick @ Logical-Invest
Keymaster… and max allocation per strategy. For example, you have recommended not allocating more than 15% to MYRS. The same may be true for UISx3. Or I many not want to allocate more than 25% to any one strategy.
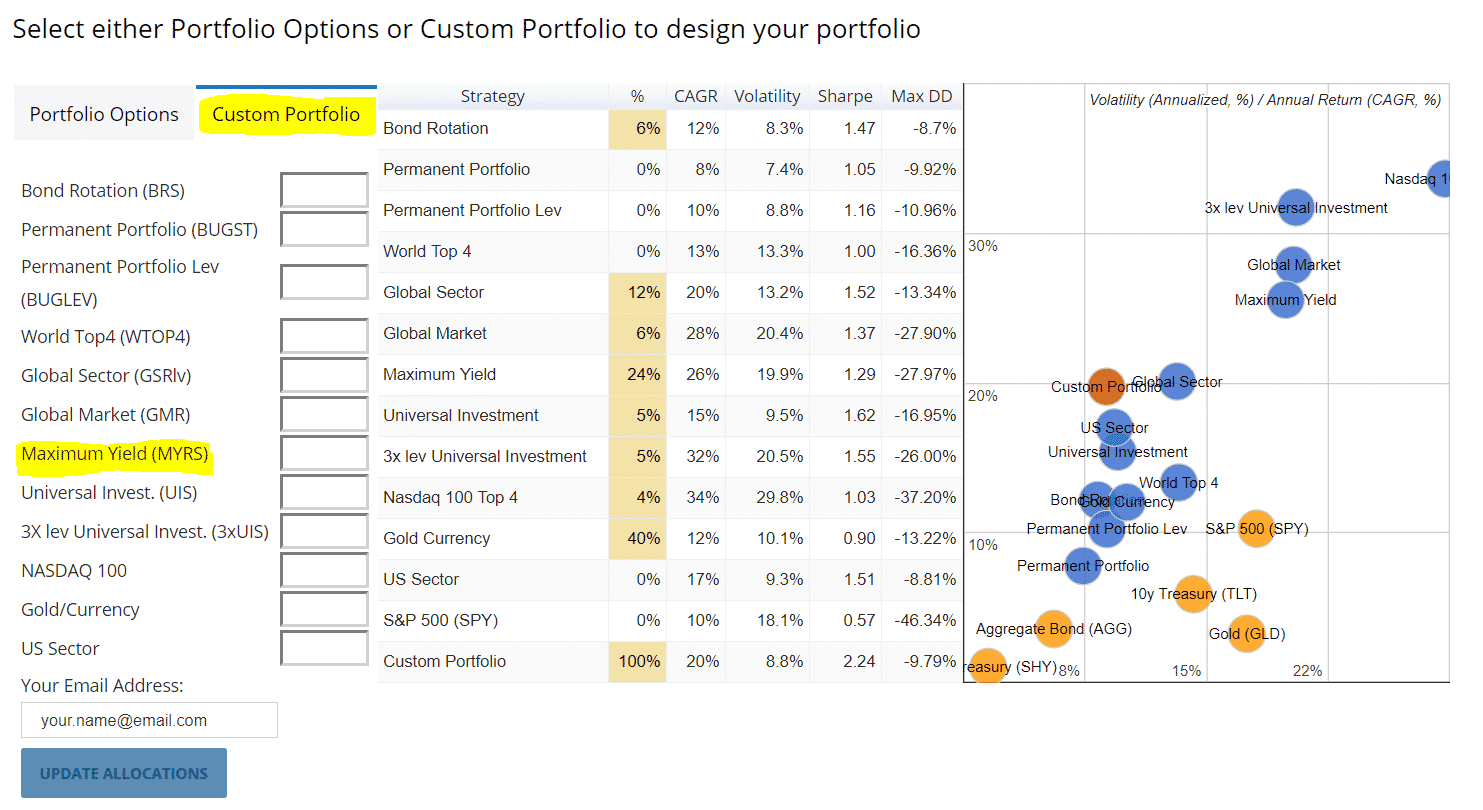
03/10/2018 at 9:58 am #50792KeymasterThe Online Portfolio Builder is limited in functionality compared to the Excel tool. In the Online tool you can:
– Visualize the pre-optimized portfolios and their statistics,
– Change allocations using the “Custom Portfolio” tab and calculate statistics on the flyBUT: You cannot run an optimization using target variables and constraints as in the Excel Portfolio Builder.
This is simply impossible due to the computation power required. It takes the Microsoft Solver around 4 minutes to compute on optimized portfolio offline on a fast computer, or 30 minutes for all pre-configured portfolios, and the MS Solver is quite a clever and speedy guy :-). This cannot be done in an online tool, or at least not with the means we have available.
We might be able to implement a brute-force optimization algorithm in QT in the future using a step-size mechanism as we do in our strategies, but this is not in the Top10 items on our prio list.
So for the time being please use the pre-configured portfolios in the Online Builder as starting point for adapting them towards your own custom portfolio like shown here: https://logical-invest.com/wp-content/uploads/2018/03/Custom-Portfolio.png.
To run optimizations excluding certain strategies or setting custom constraints please use the Excel Tool: https://logical-invest.com/?gfid=15
Also let me highlight another point I have on my mind since we updated the hedges in the strategies, and this has been point of discussion in the past. The Portfolio Builder uses HISTORICAL (aka “frozen”) allocations and performance statistics as a subscriber would have been invested. This means changes to the strategies like in the new hedge mechanism are only reflected going forward – not for the past. This makes sense as our long term subscribers can see the past as they have been invested in – but might be confusing when looking for a new portfolio going forward – with changes in the strategies.
In contrast, QuantTrader uses the most recent strategy configuration for its backtests, e.g. each time you change a parameter the historical data changes. This is useful for setting up a new strategy, but prone to permanent over-fitting if not used properly – and does not reflect the reality of a subscriber having been invested in a strategy or portfolio.
So now that you can use both tools, it´s a good practice to compare the performance statistics from the Online Builder with the backtested performance in QuantTrader. Simply put your strategy allocations into the Consolidated Signals tool in QuantTrader to see how the new hedges would have worked in the past, here a tutorial: https://logical-invest.com/consolidated-signals-interactive-brokers-portfolio-rebalance-tool/
03/15/2018 at 5:10 pm #50898ParticipantThanks Alex. I don’t see consolidated signals available anymore under portfolio builder. Is it still available without using QT? in QT, is it easy to build a max sortino ratio rather than max sharpe?
03/15/2018 at 7:28 pm #50900KeymasterHi Daniel, the consolidated signals are available from the “members area” menu, just deleted the direct link from the portfolio builder to avoid non-subscribers getting an empty page.
Also QuantTrader uses our “modified sharpe ratio” approach, e.g. considers up- and downside volatility.
03/15/2018 at 7:33 pm #50901Participantthanks Alex. Modified is that sortino out of the box? I can just max downside volatility?
03/15/2018 at 7:43 pm #50902KeymasterOur “modified sharpe” considers also upside volatility, see here for math. We could do variations of that in future, but honestly would not even be on Top100 list right now – list get’s longer each day.
I´ve done some backtests using Sortino Ratio before and there are circumstances where it absolutely makes sense and delivers better results, especially when using single and “bumpy” stocks, but generally do not feel it would be much of a boost in the mostly ETF based strategies. That’s out of the hips, honestly have not backtested our strategies using Sortino for a while now.
03/15/2018 at 8:52 pm #50904Participantok thanks Alex
03/17/2018 at 6:42 am #50929reuptake
ParticipantAlex, have you ever tried using other performance measures? Ulcer performance index would be a great candidate…
04/26/2018 at 11:29 am #51932StefanM
ParticipantHi Alex
I am using the excel portfolio builder for the first time. In a custom portfolio I have the following result:
Total Return: 1031%
CAGR: 34.1%
Period: 11/08/08-24/04/18 (i.e. nearly 10 years)Question:
The CAGR required to achieve 1031% over 10 years is 26.3% (i.e. 10th root of 10.31). Why does PB show a CAGR of 34.1%?Thanks
05/01/2018 at 10:36 am #52143Richard
ParticipantHello Alex,
I visited the Excel Portfolio Builder for the first time in some months and note some issues:
On the solver tab – return data is represented as ending on 9/16/2016.
USSECT is included for Solver optimization if we set the flag to include it, but doesn’t appear on the input tab summary of results. When viewing solver solution weights on the input tab, they don’t add to 100% – they are low by the solver’s allocation to USSECT.
On the portfolio templates tab, DataDate values are shown as back to 8/12/2016, but the updated ReturnData date is current (04/30/2018).
On the portfolio templates tab, the optimization date is shown as 01/02/2017. I tested an optimization for MAXCAGR vol<15%, expecting the optimization date to change to today, but the date did not update.
QuantTrader includes 6 US Sector strategies. Which one is represented in Excel PB and On-line PB?
As always, I appreciate your response and insights.
Regards, Richard M
05/02/2018 at 4:06 am #52167KeymasterThanks Richard, give me a day to review and upload a new version with comments.
05/05/2018 at 10:06 am #52239ParticipantHello Alex,
While you’re looking over Excel PB, I think it would be helpful to provide a clear correspondence of the pre-configured portfolio list in QT with the PB portfolios, and how similarly labeled portfolios may be different in each tool.
Regards, Richard M.
05/08/2018 at 6:05 pm #52292ParticipantHi Alex
I am using the excel portfolio builder for the first time. In a custom portfolio I have the following result:
Total Return: 1031%
CAGR: 34.1%
Period: 11/08/08-24/04/18 (i.e. nearly 10 years)Question:
The CAGR required to achieve 1031% over 10 years is 26.3% (i.e. 10th root of 10.31). Why does PB show a CAGR of 34.1%?Thanks
05/09/2018 at 7:31 am #52311KeymasterHi Stefan,
Indeed, the CAGR should be 28.3%, attached an Excel example with the exact data and formulae.
Cannot reconcile the 34% you mention, would you send me your sheet to [email protected] so I can check?
Thanks,
Starting Value 100 8/15/2008
End Value 1131 05/01/18
Total Return 1031%Days: 3,546
yrs 9.74
CAGR: 28.3%05/09/2018 at 9:42 am #52315ParticipantHello Alex and Stefan,
I ran the Excel Portfolio Builder to try and replicate the effect Stefan reported and produced a similar if not precisely identical result. (MAX CAGR Vol<20%, CAGR = 36%) See the attachment for details.
This problem arises from the observation about inconsistent dates I offered last week – on the Equitylines and ReturnWeighted sheets data is included only to 9/16/2016, while data on ReturnData runs out to the current date. CAGR is based on the duration from the EquityLines sheet.
Stefan used a 10 year duration in his calculation and thus produced a lower CAGR result than basing it on the roughly 8 years shown on the EquityLines data sheet, and used in the PB CAGR calculation, producing the error in PB results.
There must be some anomaly introduced recently in PB since these were all consistent not long ago.
Looking forward to the updated version!
Regards, Richard M.
05/09/2018 at 9:46 am #52317KeymasterHi Richard, thanks, that makes sense. I´m basically finished with the review of the PB, just fighting with some last details in the graphs, sorry if it takes longer then expected.
Here the current version with updated optimization and formulae review – so we’re using the same base while I finish up: https://logical-invest.com/?gfid=15
05/09/2018 at 10:46 am #52319ParticipantI downloaded your latest version and will take a look later on today.
I did notice that the initial data date gets later with each version.
Of course performance during the GFC is important to include in the analysis of our portfolios.Regards, Richard
05/11/2018 at 9:56 am #52349ParticipantHello Alex,
A couple of further observations –
I worked a little with the latest PB (version ID would be helpful).
Note that the solver solution includes AGG, TLT, SHY weightings even though they are excluded from the optimization on the Solver tab. Other excluded symbols also are allocated but at smaller amounts rounding to 0.Checking out the Consolidated Signals Excel workbook, the USSECT allocations don’t add to 100% so overall allocations may sum to less than 100% as well.
That’s all for now.
Regards, Richard M.
05/17/2018 at 3:28 pm #52445KeymasterHello Richard,
indeed needed to increase the decimals in the solver parameters, some solutions converged with very small percentages that should not be there. Should have noted, sorry for that. Have finished reviewing also the other things on my list, here the new file: https://logical-invest.com?gfid=15
As an early heads-up: One smart community members has managed to come up with a brilliant brute-force optimization routine. Much faster, more options and much more elegant than my Excel monster :-) We hope to get it into an online version soon.
The US sector rotation strategy signals are ok, they do not add to 100% as the strategy is 26.7% in cash this month if you use the 3x levered ERY ETF. See signals here: https://logical-invest.com/the-us-sector-rotation-strategy-investment-for-may-2018/
05/18/2018 at 10:14 am #52454ParticipantHello Alex,
Ok, thanks for the updated PB version and explanation on USSECT in the Consolidated Signals spreadsheet.
Which of the several USSECT strats from QT is represented in PB?
Very much looking forward to seeing the new approach to “brute force” optimization!
BTW, as I’ve noted elsewhere, your Excel monster is pretty impressive and has been a big help.Regards, Richard
11/16/2018 at 8:26 am #56205UkiwiS
ParticipantWith the new website, how do I view the asset allocations for my combined portfolio so I can re-balance? For instance, if I have a various weightings in the different strategies I’d like to see the total I need to have invested in TLT, SPY, GLD, ZIV etc etc.
The button that says “By Stock/ETF” is not doing it. It changes the view slightly from the “By Strategy” but I’m not seeing the individual ETFs.
- AuthorPosts
- You must be logged in to reply to this topic.