Logical Invest
Investment Outlook
September 2018
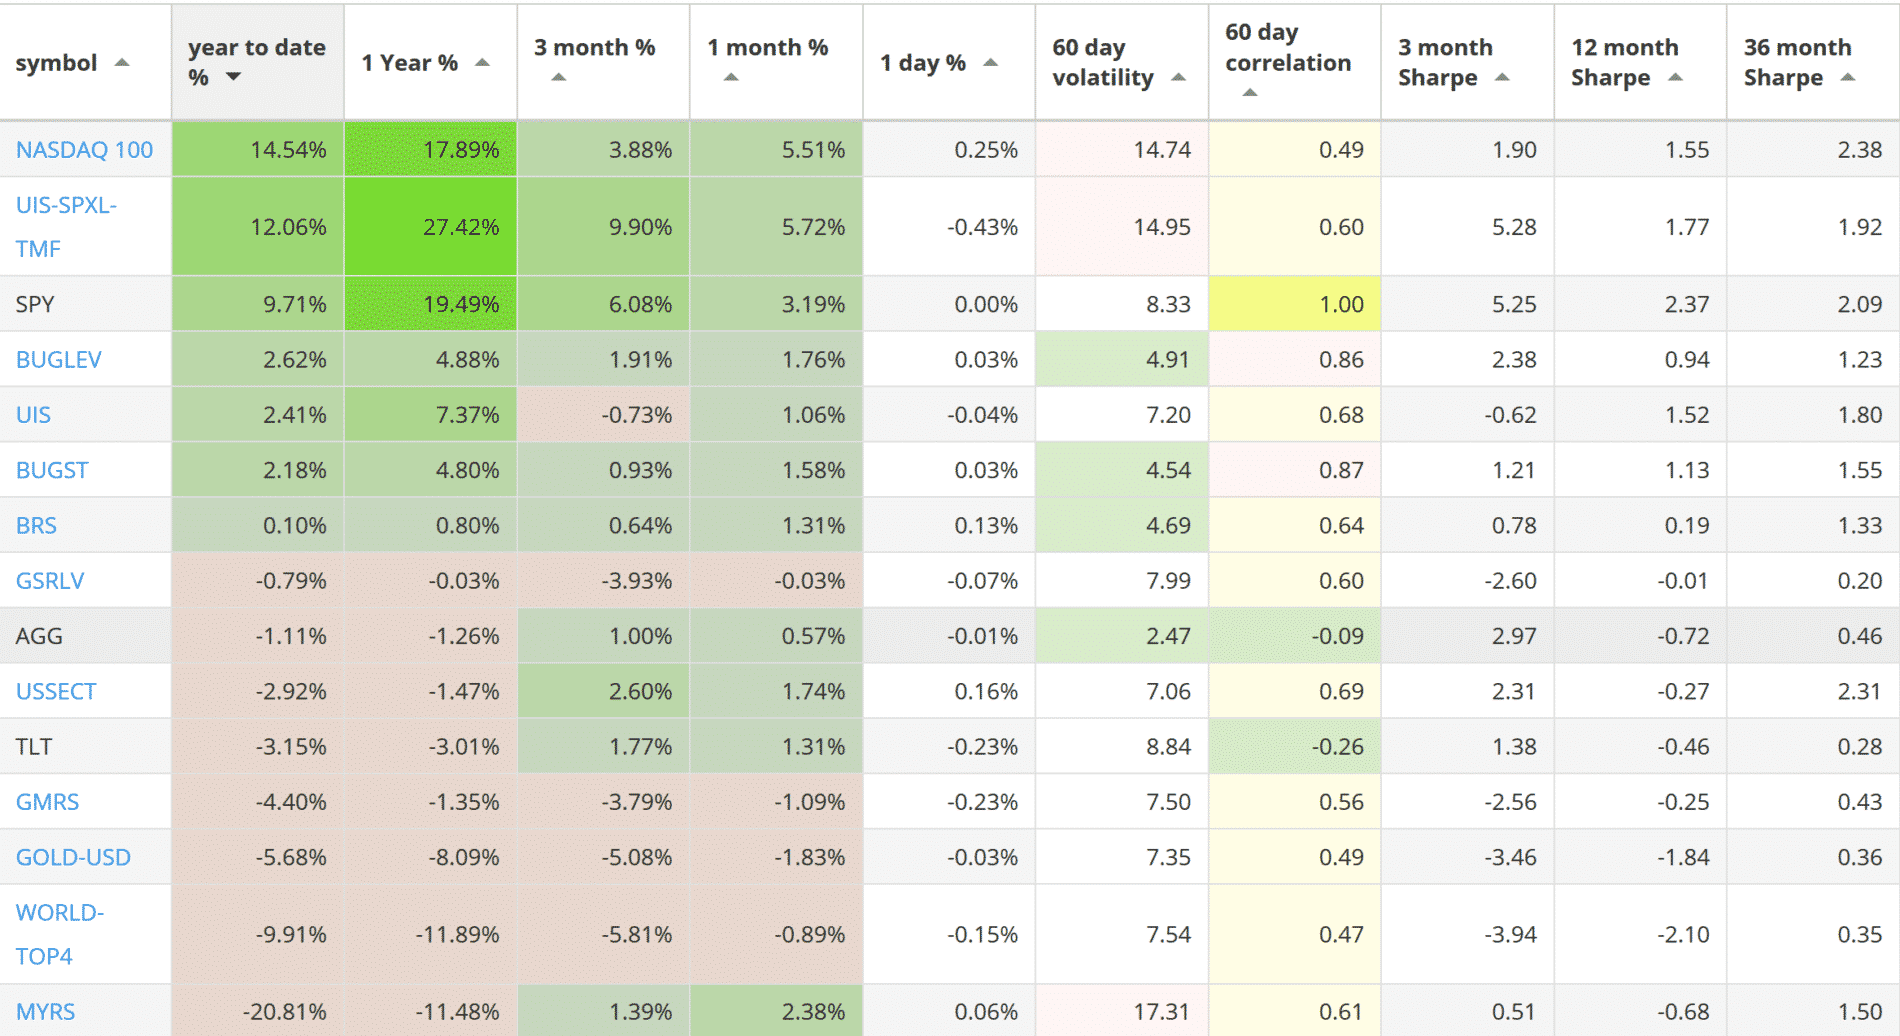
Our top 2018 investment strategies, year-to-date :
- The NASDAQ 100 strategy with +14.54% return.
- The 3x Universal Investment strategy with +12.06% return.
- The BUG Leveraged strategy with +2.62% return
SPY, the S&P500 ETF, returned +9.71%.
Market comment:
Despite tariffs, a flattening yield curve, Turkey’s currency collapse and the fear of contagion across emerging markets, the S&P 500 is yet again making new highs. The U.S. equity market has outperformed most other markets and asset classes. Part of this performance is due to real economic strength and solid corporate earnings but another part is due to U.S. dollar strength. As we have mentioned in the past, rising short term interest rates create fund flows from negative yielding currencies (Euro, Swiss franc) into U.S. assets. Taking a world view, most developed (SPDW: -0.37%) and emerging equity markets (EEM: -7.78%), international bonds (PCY: -5.03%, IBND: -3.62%) and even Gold (GLD: -8.2%) are either flat or negative for the year. In contrast the dollar index is up (UUP: +4.82%).
| ETF Symbol | SPY | TLT | EPP | GLD | EFA | EEM | FEZ | ILF | UUP |
| YTD Return | 9.71% | -3.15% | -1.96% | -8.20% | -2.30% | -7.78% | -3.65% | -10.14% | 4.82% |
Major ETF returns Year-to-date
The yield curve has continued to flatten with the 2-year Treasury yield at 2.67%. Adding 28 years to maturity will only squeeze out an additional 0.35% yield, at 3.02%. Many analysts see this as a sign of a coming recession but as we have discussed in the past even after having an inverted yield curve it may take years for a recession to materialize.
| Date | 1 mo | 3 mo | 6 mo | 1 yr | 2 yr | 3 yr | 5 yr | 7 yr | 10 yr | 20 yr | 30 yr |
| 08/29/18 | 1.97 | 2.13 | 2.28 | 2.48 | 2.67 | 2.75 | 2.78 | 2.85 | 2.89 | 2.96 | 3.02 |
Daily Treasury Yield Curve Rates, U.S. Department of the Treasury
In foreign markets, Turkey’s crisis, with the Lira losing some 40% of it’s value, seems to be tied to geopolitical factors specific to the area and President Erdogan rather than economic weakness. Fear of contagion to European markets (via major European bank loans to Turkey) did bring the Euro/USD to 1.13 and crashed neighboring Greece’s index down by -15% but it seems these fears are receding.
Most of our strategies came out positive for August mainly because of strength in both U.S. equity and Treasuries. Top performers were the 3x Universal Strategy adding 5.72% , the NASDAQ 100 with 5.51% and the Maximum Yield strategy with a 2.38% return. The U.S. sector strategy returned +1.74, the BUG strategy +1.58%, our Bond Rotation 1.31% and the Universal Investment strategy +1.06%. Worst performers were our global strategies, World Top 4 (-0.89%) and Global Rotation (-1.09%).
We wish you a healthy and prosperous 2018.
Logical Invest, September 1, 2018
Strategy performance overview:
Visit our site for daily updated performance tables.
Symbols:
BRS – Bond Rotation Strategy
BUGST – A conservative Permanent Portfolio Strategy
BUGLEV – A leveraged Permanent Portfolio Strategy
GMRS – Global Market Rotation Strategy
GMRSE – Global Market Rotation Strategy Enhanced
GSRLV – Global Sector Rotation low volatility
NASDAQ100 – Nasdaq 100 strategy
WORLD-TOP4 – The Top 4 World Country Strategy
UIS – Universal Investment Strategy
UIS-SPXL-TMF – 3x leveraged Universal Investment Strategy
AGG – iShares Core Total US Bond (4-5yr)
SPY – SPDR S&P 500 Index
TLT – iShares Barclays Long-Term Trsry (15-18yr)