Logical Invest
Investment Outlook
June 2018
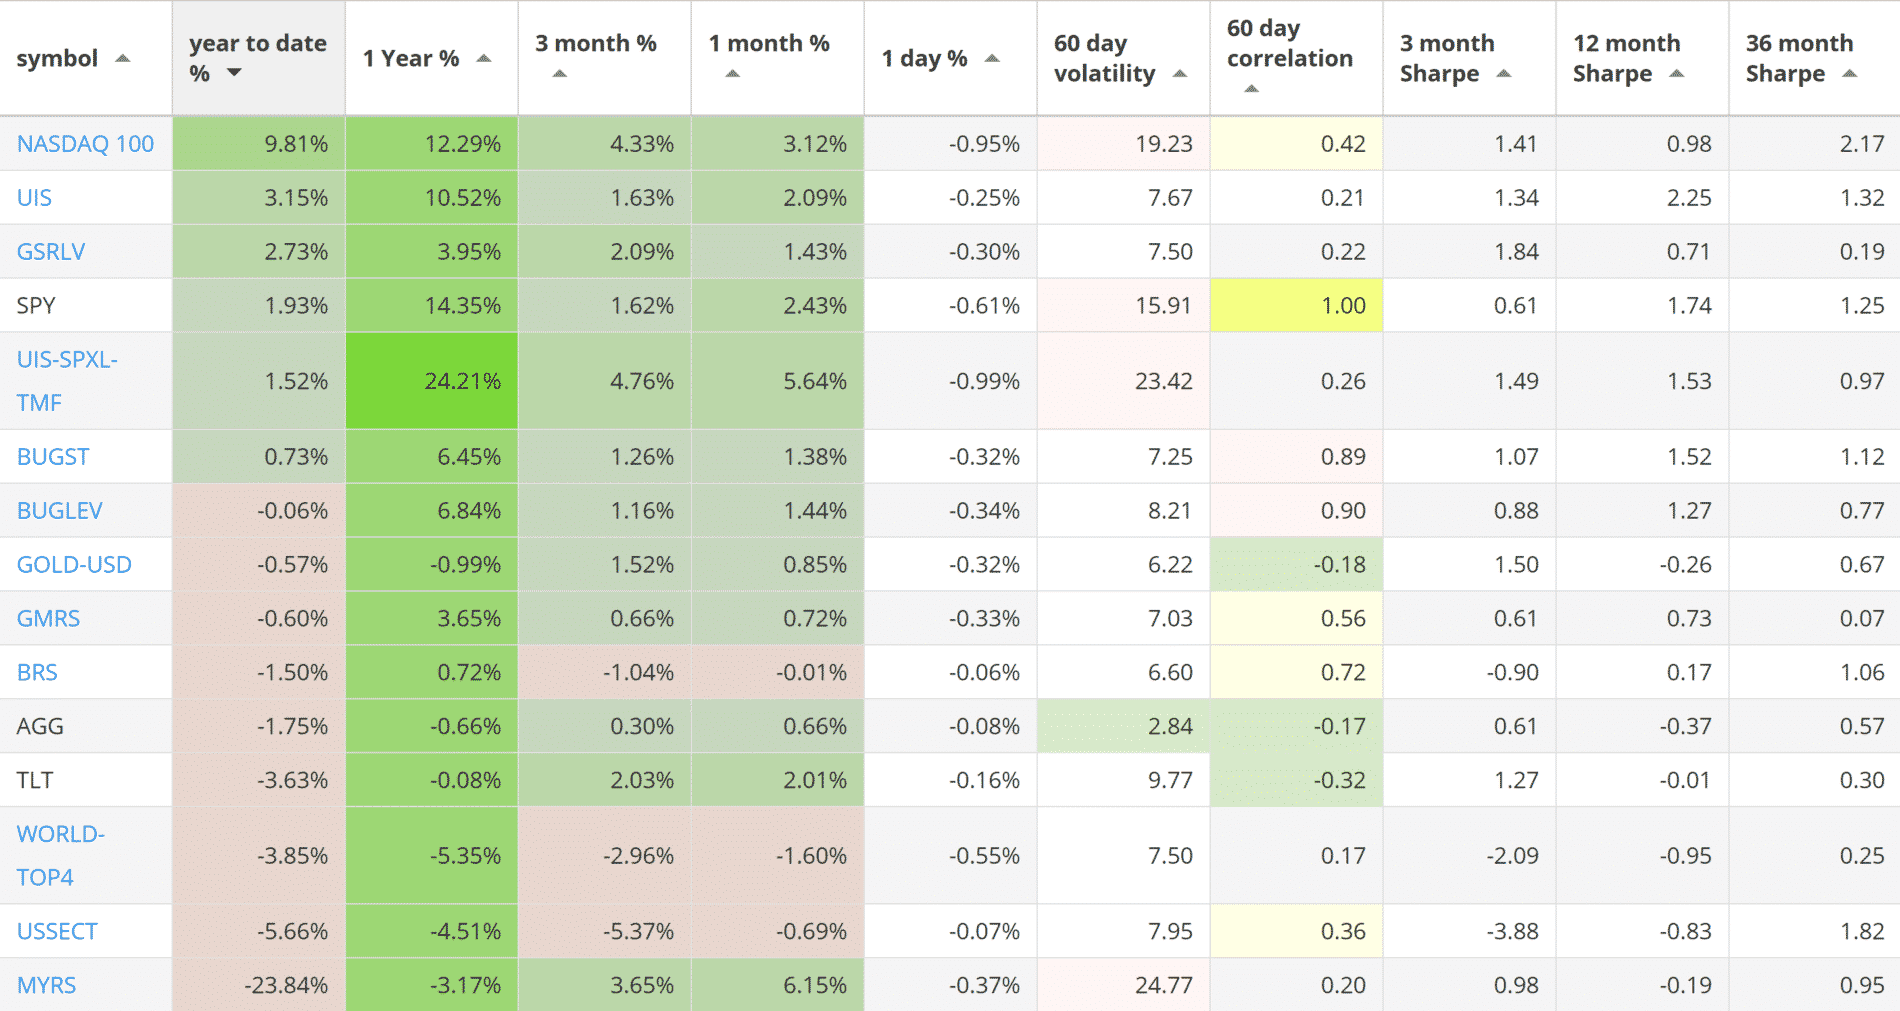
Our top 2018 investment strategies, year-to-date :
- The NASDAQ 100 strategy with +9.81% return.
- The Universal Investment strategy with +3.15% return.
- The Global Sector Rotation strategy with +2.73% return
SPY, the S&P500 ETF, returned +1.93%.
Market comment:
In May we saw both U.S. equities and U.S. Treasuries rise, returning +2.43% (SPY) and +2.01% (TLT) respectively. This was partly due to investors running away from Europe and into the safety of Treasuries, as Italy is once again in a political crisis. The dollar index (ETF:UUP) rose +2.6%, which partly explains why Gold, even though a safe heaven, lost 1.2% for the month. Same for emerging markets: Strong dollar causes weak foreign equity and the Emerging market ETF (EEM) lost 2.6%. Those affected the most were the southern Europeans: Spain -8.2%, Greece -14.1%. Some Latin American countries also went into crisis mode: Mexico -13.4% on fear of tariffs and Brazil -15.7% on a continued union strike. Volatility on the other hand behaved as expected and ZIV gained +6.74% for the month. The Euro, lost another -3.2%.
Most notable for this month is the continued flattening of the Treasury Yield. In other words interest rates on short term Treasuries are rising faster than longer dated ones. This does not mean a recession is imminent. Historically an inverted curve (ie, a shorter term treasury bill/note yielding more than longer dated one) may signal a recession, but when it has, it has taken an average of 12 months* for it to materialize.
| Date | 1 Mo | 3 Mo | 6 Mo | 1 Yr | 2 Yr | 3 Yr | 5 Yr | 7 Yr | 10 Yr | 20 Yr | 30 Yr |
|---|---|---|---|---|---|---|---|---|---|---|---|
| 05/01/18 | 1.68 | 1.85 | 2.05 | 2.26 | 2.50 | 2.66 | 2.82 | 2.93 | 2.97 | 3.03 | 3.13 |
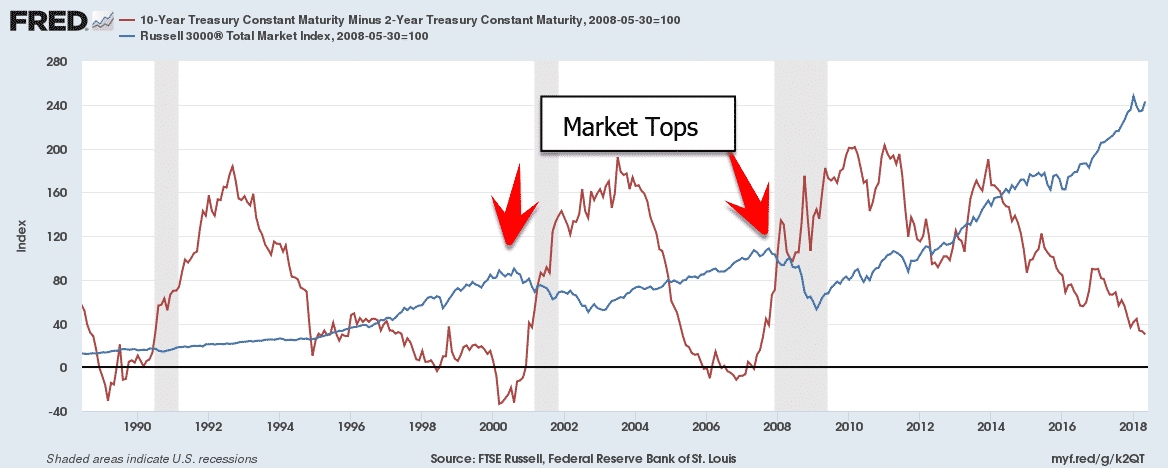
The SP500 (blue line) vs the 10 Year – 2 Year Treasury yield spread (red line). Shaded areas indicate U.S. recessions. Just before the 2000 and 2008 market tops the red line plunged below the zero line, which means the 2Y was paying a higher interest rate than the 10 Year. Source FRED.
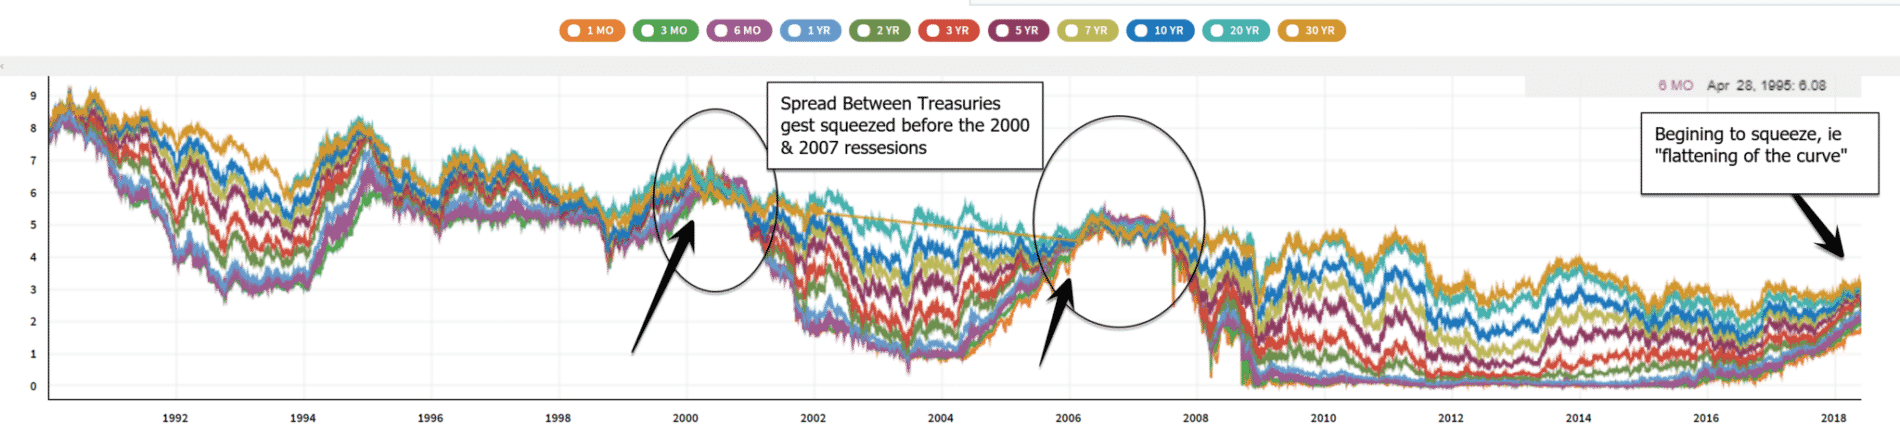
Yields of different expiry Treasuries. Before 2000 and 2008, short term rates rose and almost touched longer term yields. Source: Quandl.com
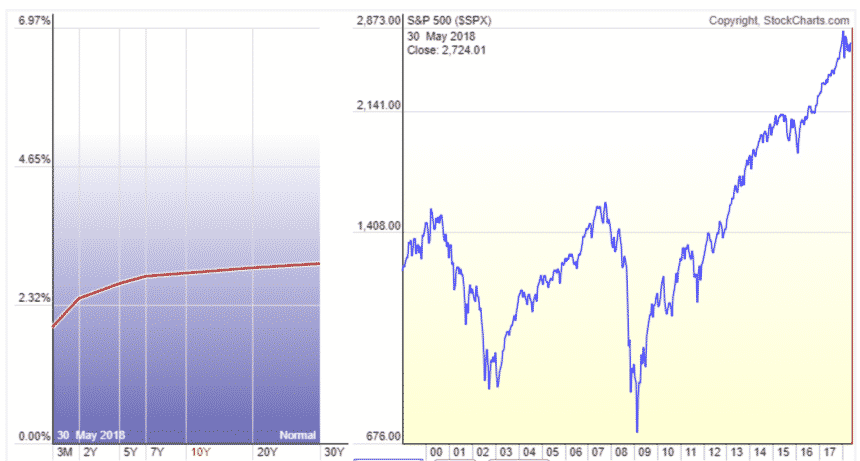
The curve vs the SP500, courtesy of stockcharts.com.
Rising short term rates do affect investors in practical terms, as they give an incentive to pull money from risk assets and place them into short term bills or cash as brokers are starting to pay interest, at least on U.S. dollar deposits.
Our strategies came in mostly positive for the month, ranging for +6% to -2.9%. The strongest where the Maximum Yield strategy at +6.15%, the 3x Universal Strategy at +5.64% and the Nasdaq 100 at +3.12%, reaching above 9% for the year. The worst performer was the World Top 4 strategy due to the reasons we mentioned. It lost a manageable -1.6%, compared to EEM: -2.6%, as the Treasury hedge dampened the fall.
Not much in crypto-land. Bitcoin continues it’s sideways movements touching once again the low 7000’s and scaring everyone as interest from retail continues to fade.
We wish you a healthy and prosperous 2018.
Logical Invest, June 1, 2018
Strategy performance overview:
Visit our site for daily updated performance tables.
Symbols:
BRS – Bond Rotation Strategy
BUGST – A conservative Permanent Portfolio Strategy
BUGLEV – A leveraged Permanent Portfolio Strategy
GMRS – Global Market Rotation Strategy
GMRSE – Global Market Rotation Strategy Enhanced
GSRLV – Global Sector Rotation low volatility
NASDAQ100 – Nasdaq 100 strategy
WORLD-TOP4 – The Top 4 World Country Strategy
UIS – Universal Investment Strategy
UIS-SPXL-TMF – 3x leveraged Universal Investment Strategy
AGG – iShares Core Total US Bond (4-5yr)
SPY – SPDR S&P 500 Index
TLT – iShares Barclays Long-Term Trsry (15-18yr)