Search Results for 'tlt as a hedge'

Home Forums Search Search Results for 'tlt as a hedge'

Viewing 69 results - 1 through 69 (of 69 total)
  • Author
    Search Results
  • #84324
    Vangelis
    Keymaster

    Dear Zeke,
    We update our strategies every few years depending on the markets. Our last update was on July 2022. When we do, we change strategy parameters and we re-backtest the whole history. Usually the backtested results are better as we change parameters to compensate for things that have already happened. A good example is TLT and the bond markets. As we adapt strategies to rely less on TLT, we create strategies that would have behaved better in the past and that we hope will behave better in the future.

    For example by adding TIPS to our hedge strategy, we make it more robust to an inflationary environments. We don’t force TIPS, we just add it to choices the algo can make. When we re-backtest the algo obviously picks TIPS more often and creates a different equity than the actual one, when TIPS was not a choice. 

    I hope this explanation helps.

    Our strategies come from QuantTrader. You can see the change log here:
    https://logical-invest.com/quanttrader-application/download/

    #84323
    Vangelis
    Keymaster

    We update our strategies every few years depending on the markets. Our last update was on July 2022. When we do, we change strategy parameters and we re-backtest the whole history. Usually the backtested results are better as we change parameters to compensate for things that have already happened. A good example is TLT and the bond markets. As we adapt strategies to rely less on TLT, we create strategies that would have behaved better in the past and that we hope sill behave better in the future.

    For example by adding TIPS to our hedge strategy, we make it more robust to an inflationary environments. We don’t force TIPS, we just add it to choices the algo can make. When we re-backtest the algo obviously picks TIPS more often and creates a different equity than the actual one, when TIPS was not a choice. 

    Our strategies come from QuantTrader. You can see the change log
    https://logical-invest.com/quanttrader-application/download/

    applet
    Participant

    Frank, thanks. This is a very good paper. I still not certain of the option portion of TLT and GLD. I think these two assets are for hedge purpose. So when the market tanks, we wish treasury and gold price will pop, to offset the loss. If we sell 0.3delta put as a replacement, then we wont see a pop, when market tanks. Can you explain your allocation between normal assets and the option for treasury and gold?
    Also in your previous post, you mentioned to sell 0.7 delta put for SPY, while in the paper, you described half long spy half sell at the money put. I guess to sell 0.7 delta put is less risky. Can you help to clarify?

    #80946

    In reply to: QT 528S

    Frank Grossmann
    Participant

    The Nasdaq100 components have been updated and 2 delisted ETFs (Gulf and Soil) have been removed.
    I only made a small change to the treasury hedge strategy. I removed the mean reversion parameter because it was responsible that we switched to cash after the first treasury spike and missed most of the strong TLT rise during the Covid crash. This mean reversion is good in sideways going markets but bad during a market correction when Treasuries perform well and as long as TLT performs well we should stay invested in it.

    Mark Vincent
    Participant

    One of the things I am constantly looking for is how to improve the existing strategies if that is possible. I’m hoping other members will give their thoughts on how to create a strategy that improves your existing strategies. What tools do you use other than LI? Are you betting inflation will come in the future and want to create an inflation strategy? We are lucky that LI has done all the hard work and we don’t have to spend hours figuring out how to create new strategies. LI gives a 3 main categories of assets that are uncorrelated and a combined Hedge. There are other assets like tips and currency but the four main ones are below:
    1. Equity
    2. Bond
    3. GLD
    4. Hedge

    What if your crystal ball tells you that when inflation happens hard assets like commodities and precious metals will rise in price. You might want to create a Hedge strategy to lower volatility that uses precious metals or metals. Here is a process to create the strategy but I am sure there are better ways and lot’s of questions:

    1. Select a precious metals ETF. I will start with PALL, GLD, SLV
    a. A big question is will PALL rise when inflation hits? It is mostly used in gasoline catalytic converters. Therefore it might not.
    b. Am I curve fitting by adding PALL since it has done so well over the last couple years?
    c. Should you add more assets like URA?
    d. How do you choose what assets are best for a strategy?
    2. Look at the correlations between them and against Equities and Bonds using the following:
    a. https://www.portfoliovisualizer.com/asset-correlations
    3. The correlations only point you in the right direction. GLD, TLT are the most uncorrelated to SPY but PALL:SPY = 0.37 and SLV:SPY = 0.38.
    4. Create the Strategy “Precious Metals” And optimize the parameters over 3 years.
    a. Monthly Rebalance
    b. 122 days lookback
    c. Use top 2 ETF
    d. Max allocation = 60%
    e. Volatility Attenuator = 2.5
    5. I choose these parameter settings based on the optimization giving stable returns across many lookback periods.
    6. Add the strategy Precious Metals to the Strategy “0 LI Strategies of strategies”. This is done in the strategy manager.
    a. Duplicate 0 LI Strategies of strategies
    b. Rename the strategy “0 Test1” or anything you like.
    c. Save it
    d. Add Precious metals
    7. Optimize 0 Test1 and choose parameters that have stability over a 3 year time period.
    a. The optimization I only changed the lookback in the original strategy from 166 to 155 and Volatility Attenuator to 0.5.
    8. Compare the results.
    a. The New model 0Test1 has a better return but a slightly higher volatility.

    Questions and Next steps:
    1. Did I curve fit by adding PALL? PALL has done very well over the last 3 years. If I added the uranium metal ETF URA it would not do as well. Selecting what ETF’s go in the strategy is critical. The objective of the strategy should drive this.
    2. Does the increase in performance justify the increase in volatility?
    3. Was 3 years a good time period to optimize across? Or should I use 5 or 10?
    4. Let the model run OS for 3 years and then reevaluate it. This is the only way to really tell if the strategy works.
    5. If there is no inflation it is possible that commodities and precious metals prices fall. I need to work on the crystal ball.

    In this process my goal was to lower volatility of an existing strategy, 0 LI Strategies of strategies. That goal was not achieved but it would be worth exploring other strategies that help reduce volatility in the future. If anyone would like to post their process for creating a strategy and how the assets are chosen please feel free to do so. LI seems to group similar assets into the strategy like US equity vs World Equity. Bond strategy vs Gold strategy. Then they combine them to optimize the KPI.

    Cheers,
    Mark V.

    StefanM
    Participant

    Hi everyone

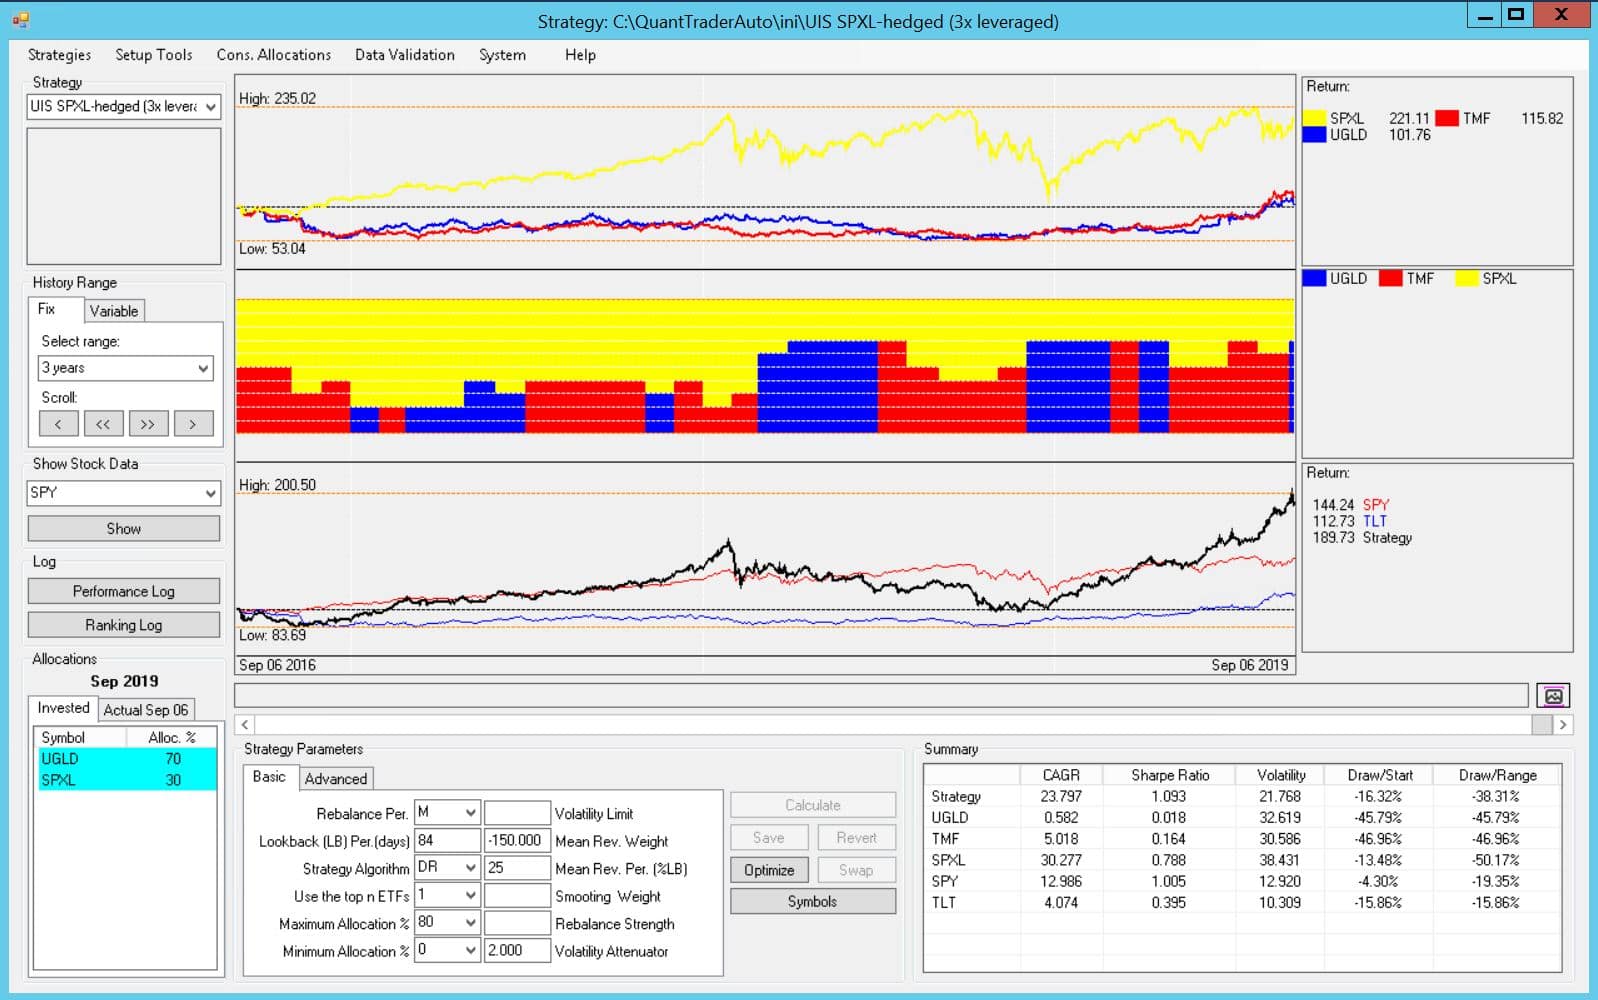
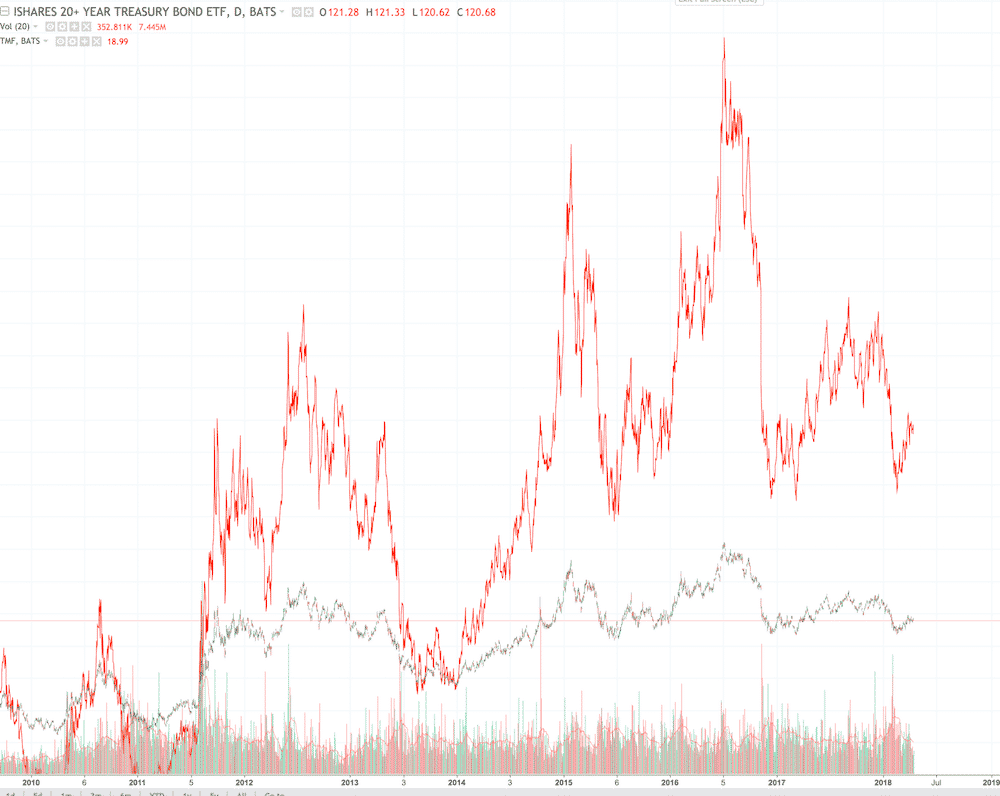
    I’ve noticed that TMF has not been rising in response to falls in SPXL, or at least its response is muted. Additionally, it has had considerable downside recently.

    In view of this, are there any other hedges we could be using?

    Or perhaps moving out of leveraged products and into unleveraged SPY/TLT type trades (UIS)?

    Have there been similar periods of hedges losing their inverse correlation to risk assets that we can draw some lessons from?

    Thanks

    #80319
    Richard Thomas
    Participant

    I would like to discuss a strategy I have been working on and would welcome any feedback.

    All my optimizations use a 5-year lookback period. I know there has been much discussion about this over the years and there does not appear to be firm consensus on the best period to use, however 5 years covers a good growth period and some good pullbacks in 2015, 2018 and 2020 so it feels to me to be a reasonable representative period.
    Whenever I run the optimizer, I do not always use the red square. I try to find a good result square that also has good stable results for the 8 squares immediately around it.
    I have not carried out any analysis using the volatility limit or the advanced QT settings.
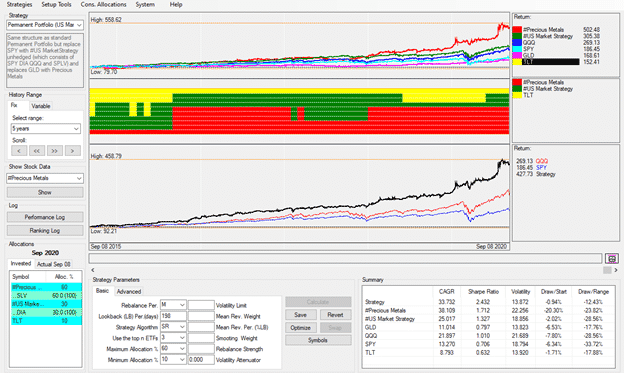
    All the stats are based on data at the end of Sept 8th 2020.

    Starting Point Permanent Portfolio

    My starting point was the Permanent Portfolio. I like that this is a very simple strategy that only uses three ETFs and is “self-hedging”. The 5-year results are CAGR = 11.192 with MaxDD = -17.38. My objective is to increase the CAGR to 20+ and reduce the MaxDD to better than -15.

    I started off with finding a replacement for GLD and created a Precious Metals (PM) strategy that consisted of GLD, SLV, PALL, CPER, JJC and PPLT which gave much better results than GLD alone. On further analysis removing the worst performers (CPER, JJC and PPLT) gave much better results.

    Incorporating my PM sub-strategy into the MPP with SPY and TLT also gave much better results so I knew I was heading in the right direction.

    Improving Treasury Hedge

    I then tried to find an improvement on the treasury element and replaced TLT with the Treasury Hedge. Despite the TH having similar CAGR to TLT but a much better MaxDD it actually gave a worse result when combined with the PM strategy and SPY. I have found this on multiple occasions when using sub-strategies in a meta strategy in QT; sub-strategy A may have better stats that sub-strategy B but the combo of B with another sub-strategy C gives better stats than combining A with C because B marries with C better. There is no way of knowing this beforehand, so I always have to run multiple versions of sub-strategies with sub-strategies.

    Equity – Stock & ETF option

    So, the final piece of the picture was to find an improvement on SPY. I tried multiple options of this – QQQ, Nasdaq 100 balanced hedged and not hedged and finally came up with two options; a stock option and an ETF option.

    The ETF option is to use the LI US Market Strategy which selects one of QQQ, SPY, DIA or SPLV.
    The stock option uses my modified version of the US Market Strategy and replaces QQQ with my version of Nasdaq 100 balance unhedged and replaces DIA with the LI version of DOW30 balanced unhedged and leaves SPY and SPLV unchanged.

    Both gave excellent results with the ETF version having a CAGR of 33.73 and MaxDD of -12.43 both of which exceeded the targets I had set myself at the beginning of the exercise.

    The stock version has a further improvement in CAGR at 39.82 for effectively the same MaxDD at -12.57

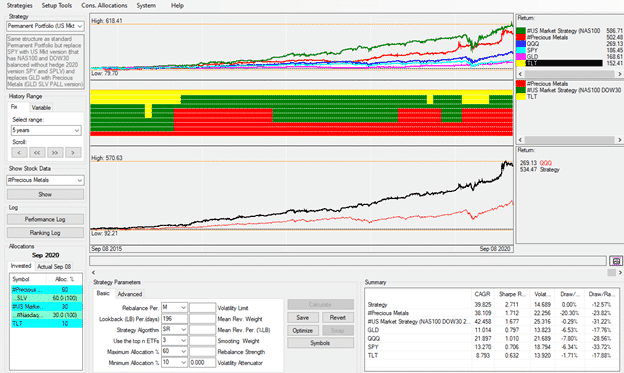
    When constructing my stock version of the US Market Strategy I did look at using the hedged versions of the NAS100 and DOW30, but these variations all gave worse results. One thing I have found with the LI strategies is that as most of them are hedged, when they are combined into a meta-strategy which itself can also be hedged there can effectively be an overabundance of hedging, so using the unhedged versions of the base strategies will usually give better overall results.

    There are probably improvements to be made to this strategy and other testing to be carried out, but it looks to me like it has a reasonable platform for going forward and it did capture the big jump in SLV in July.

    You can download a QuantTrader version with all the needed files here: QuantTrader527S Modified Permanent Portfolio.

    I would welcome any comments.

    Richard Thomas

    Mark Vincent
    Participant

    I have the following strategy that will only Optimize Quarterly. The monthly optimization is all black under any time period? Does anyone know why?

    You will need to add the ETF symbol TAIL to run this strategy.

    Here is the .ini file:

    [StrategyTitle]
    0 QQQ Tail Hedge min opt
    [StockItems]
    #Hedge=#Hedge 1,2,1,1,0.00
    TAIL=,2,1,1,0.00,,0,0
    TLT=Barclays long term treasury (10 years),2,2,1
    QQQ=PowerShares Nasdaq-100 Index,2,1,1
    [StockSets]
    StockSet95=0 QQQ Tail Hedge min opt,1,3,StockSetStrategy95,2020-09-25,2020-09-25,#Hedge@1,TAIL@1,TLT@1,QQQ@2
    [StockSetItems]
    StockSet95Item1=1111,StockSet95Item2,0,00000004,2,
    StockSet95Item2=1101,StockSet95Item3,1,00000008,2,
    StockSet95Item3=0001,StockSet95Item4,2,00000010,3
    StockSet95Item4=0100,StockSet95Item5,2,00000020,3
    StockSet95Item5=-,-,2,00001000,3,
    [StockSetStrategies]
    StockSetStrategy95=2,2,Logical Invest Universal Investment Strategy,1101,10,,1
    [StockSetStrategyParameters]
    StockSetStrategy95=-5,3,176,3,-3,7,-2,7,-6,7,-2,7,0.00,0,-200.00,1,25,1,0.00,0,0.00,0,0.50,1,0,0,0,0,0,0,0,0,0.00,4,0.00,4,0,0,0,4,0,4,0.00,0,0.00,0,0.00,0

    Vangelis
    Keymaster

    Hello Michael,

    Both Mark and Frank have a point. I may add that this same argument was present a few years back were yields were again very low. At that point, for the many reasons you mentioned, we created the HEDGE sub-strategy instead of purely relying on TLT for hedging equity risk. The HEDGE sub-strategy added access to TIPS, cash and gold. The adjustment has been towards possible inflation which can be captured via GLD and in part TIPS, or pure deflation via GSY (cash). Interestingly, despite everyone believing interest rates can only go up, TLT managed to be one of the best asset performers and was an excellent hedge to the March 2020 crash. Lesson is we just don’t know what will happen and how long interests will be close or sub-zero. Our HEDGE is flexible enough to deal with a changing environment, even an inflationary one.

    Mark Vincent
    Participant

    Hello Michael and thanks for posting that question I think about it often and there is no perfect answer.

    If you are using the QT software you can see that the Hedging strategies (Hedge) will rotate many uncorrelated assets as follows:
    Gold-USD
    o GLD
    o GSY
    o MINT (NOT ACTIVE)
    o TIP (NOT ACTIVE)
    o UUP (NOT ACTIVE)

    Treasury Hedge
    o GSY
    o TIP
    o TLT

    If the Bond market becomes uncorrelated to the stock market the Hedge should switch to a different asset class that is performing better and uncorrelated to stocks.
    This is my very simplistic view of how it should work and I am sure LI staff will have a better explanation. We as users also rely on LI to update the hedge and allocation based on market conditions. None of us have a crystal ball but LI tries to adjust the hedge based on the current market conditions. LI also updates the maximum allocation of the hedge and the assets in the hedge as volatility is increasing they apply more allocation to the hedge and I am thankful they do. I do not have the time to analyze every uncorrelated asset and make a prediction on how it will perform in the future.

    Regards,
    Mark Vincent

    #79888
    Horizon60
    Participant

    I don’t have QT so I can’t tell anything about your strategy, but I read that you use LQD, I didn’t know it and it looks better than TLT for return/risk ratio. Probably TLT is better to hedge stocks, but LQD would be a nice addition to a portfolio, I think.

    #79882
    Tom Gnade
    Participant

    I’ve played around for quite some time with S3 variants of all sorts. I now have something that I think works well. Here are the required .ini files:

    S3 ini files on Google Drive

    It uses the built-in “Hedge”, “GLD-USD”, and “Nasdaq 100 balanced without hedge” strategies. It is restricted to the following symbols:

    FVD, QQQ, PCY, TLT, GLD, LQD, IEF, TIP, GSY

    It is similar in performance to the built-in US Market Strategy hedged, except that it has far better performance over the full 20-year timespan (all values rounded):

    US Market
    1 yr: CAGR 22.1, Sharpe 1.5, Vol 15, Draw -15.3
    5 yr: CAGR 17.4, Sharpe 2.0, Vol 8.7, Draw -15.3
    10 yr: CAGR 16.0, Sharpe 2.0, Vol 8.2, Draw -15.3
    20 yr (Jan ’01 – present): CAGR 11.4, Sharpe 0.9, Vol 12.7, Draw -41.0

    S3
    1 yr: CAGR 29.1, Sharpe 2.0, Vol 14.3, Draw -14.1
    5 yr: CAGR 16.8, Sharpe 2.0, Vol 8.6, Draw -14.1
    10 yr: CAGR 16.0, Sharpe 2.0, Vol 8.2, Draw -14.1
    20 yr: CAGR 15.9, Sharpe 1.8, Vol 8.6, Draw -14.1

    From the start of the strategy (Jan ’01) to present, there is no year-end with negative returns – though there are several that are nearly flat. The simplest mix of the strategy is labeled S3 – 1 – 3. That uses even fewer symbols, avoiding using the “braking” sub-strategies. The second main sub-strategy, S3 – 2 – 4, does make use of the brakes. Either of those two sub-strategies could be used independently. The top-level strategy, S3, rotates these two sub-strategies. Each of these sub-strategies is composed of several sub-strategies:

    FIRST MAIN SUB-STRATEGY:

    S3 – 1 – 1 – LONG OPT: Rotates FVD, PCY, and QQQ with long (20-yr) optimum
    S3 – 1 – 1 – SHORT OPT: Rotates FVD, PCY, and QQQ with short (<=10-yr) optimum
    S3 – 1 – 1: Rotates S3 – 1 – 1 short and long opts

    S3 – 1 – 2 – LONG OPT: Rotates S3 – 1 – 1 and Hedge with long opt
    S3 – 1 – 2 – SHORT OPT: Rotates S3 – 1 – 1 and Hedge with short opt
    S3 – 1 – 2: Rotates S3 – 1 – 2 short and long opts (already achieves 20-yr CAGR 14.4, Sharpe 1.58, Draw -14.13)

    S3 – 1 – 3 – LONG OPT: Rotates S3 – 1 – 2 and Nasdaq 100 balanced without hedge (N100-4) with long opt
    S3 – 1 – 3 – SHORT OPT: Rotates S3 – 1 – 2 and N100-4 with short-opt
    S3 – 1 – 3 – NO OPT: A fixed-ratio of 80% S3 – 1 – 2 and 20% N100-4
    S3 – 1 – 3: Rotates S3 – 1 – 2 short, long and no-opt strategies (20-yr CAGR 15.7, Sharpe 1.7, Draw -14.13) *can be used stand-alone

    SECOND MAIN SUB-STRATEGY:

    S3 – 2 – 1 – LONG OPT: Rotates GLD-USD (GLD and GSY), IEF, and LQD with long opt
    S3 – 2 – 1 – SHORT OPT: Rotates GLD-USD (GLD and GSY), IEF, and LQD with short opt
    S3 – 2 – 1: Rotates S3 – 2 – 1 long and short opts

    S3 – 2 – 2 – CASH BRAKE: Rotates S3 – 2 – 1 and GSY
    S3 – 2 – 2: Rotates S3 – 2 – 1 and S3 – 2 – 2 – CASH BRAKE – The idea here is to use lower-volatility market, gold and US bonds ETFs (LQD, GLD-GSY, IEF) to construct a “braking” strategy that targets lower returns with lower volatility, and that moves differently from the higher volatility strategy, so it can be used as an effective fallback. This strategy is a little ugly to use on its own, it’s really intended as a low-vol “lightning rod” or “brake” for the main strategy.

    S3 – 2 – 3 – LONG OPT: Rotates S3 – 1 – 2 and S3 – 2 – 2 (“the brakes”) with a long opt
    S3 – 2 – 3 – SHORT OPT: Rotates S3 – 1 – 2 and S3 – 2 – 2 with a short opt – this ended up never being used so could be eliminated.
    S3 – 2 – 3: Rotates S3 – 1 – 2 long and short opts (but only uses the long opt)

    S3 – 2 – 4 – LONG OPT: Rotates S3 – 2 – 3 and N100-4 with long opt
    S3 – 2 – 4 – SHORT OPT: Rotates S3 – 2 – 3 and N100-4 with short opt
    S3 – 2 – 4: Rotates S3 – 2 – 4 long and short opts. This strategy achieves 20-yr CAGR 15.5, Sharpe 1.9, Vol 8.2, Draw -12.24 and can be used on its own.

    S3: Rotates S3 – 1 – 3 and S3 – 2 – 4. Total return 1845.5% from late ’00 to present, CAGR 15.872%, Sharpe 1.844, Vol 8.609, Draw -14.13%.

    Enjoy!

    Tom

    #79835
    R D HATHCOCK
    Participant

    Given that treasuries don’t have a lot of headroom, I have modified the levered hedge to UBT/UGL/UVXY. UVXY seems to be very suited for this role, as it is not a flight to safety item like TLT, but it shows volatility of people fleeing. Have you LI guys looked at something like this in hedging?

    #79819
    Horizon60
    Participant

    I wonder how long TLT will be a good hedge, as real yields are already negative. TLT performed very well during the last years, but there is very little room for yields to go lower. And what could be an alternative to it? Are you already thinking how you would modify your strategies? thank you

    Mark Vincent
    Participant

    Dwoods,

    Yes it is very surprising that a quarterly rebalance works well. It even works with non leverage just GLD and TLT. Non leveraged 3 year return is over 30% and 2.5 sharpe. Would anyone like to comment on the pros and cons of the following:

    – What are the risks of hedging with only GLD and TLT? Is there a scenario where both GLD, TLT and stocks all go down for long period of time. The backtest shows the worst 3 month period was -14% and the strategy did not work well in 2013.

    – Is hedging with GLD and TLT better than using QT Hedge? The Backtest would say yes but you loose diversification.

    – Is a quarterly rebalance high risk vs a monthly rebalance. The negative is the system cannot react as quick to a downturn and we only had 1 recession in the last 20 years so it is hard to say yes or no.

    Cheers,
    MV

    Hi guys,

    For the performance tables in the pages per strategy at what point is the rebalance struck? So if the HEDGE balanced from TIP to TLT at July month end does your performance table take the % moves as of 31st July close? Or is it 3rd August open?

    Best James

    – You can hedge by selling Forex USD versus Euros (EURUSD).
    – You can also use the Futures on these ETFs which eliminates the currency risk. There are synthetic Futures for nearly every ETF.
    – You can use real Futures like ES, GC, UB ….. instead of ETFs.
    – You can sell options with a long expiry. For example a Jan 2021 put option on TLT. The higher the delta the closer the put option behaves like the underlying. Option selling however is nothing for beginners. I would sell equity options only with a high (0.7) delta and minimum 100 days expiry.

    #78898
    ikoskela
    Participant

    I finally got QT working again today by rolling back to 520S (and accepting the strategy updates). In an effort to find out why QT gave me a different allocation for the “Volatility less than 15%” portfolio than the website is indicating, I again used the consolidated allocations feature in QT to set my portfolio to:
    27% MYRS-ZIV Hedged (to map to MYRS on the website)
    51% Nasdaq 100 Hedged (to map to NAS100 on the website)
    22% UIS SPXL-hedged 3x leveraged (to map to UISx3 on the website)

    The result is:
    TMF 15.40%
    UGLD 13.50%
    ZIV 13.50%
    GLD 12.24%
    TLT 8.16%
    CHTR 7.65%
    EBAY 7.65%
    KHC 7.65%
    PCAR 7.65%
    SPXL 6.60%
    TOTAL 100.00%

    However, the website indicates the allocation for this portfolio is:
    AAPL 5.1%
    COST 5.1%
    EBAY 5.1%
    GLD 18.4%
    MSFT 5.1%
    SPXL 8.8%
    TIP 12.2%
    TMF 13.2%
    UGLD 10.8%
    ZIV 16.2%
    Total 100.0%

    Which is right? And what is accounting for the difference between the two?

    Thanks!

    #78672

    I think even with very low or slightly negative interest rates, TLT or TMF are still an efficient hedge because of their negative correlation to equity. But there may be long periods where they will not perform well, so we really need strategies which adapt Treasury allocation to the market. However because of negative correlation it is most of the time the better hedge than going to cash

    #78657
    sean_ca
    Participant

    I think we have a challenge here. As the interest rate is so low and possibly towards negative, is the treasury bond such as TLT or using TMF still an efficient hedge? We saw that it didn’t work when the liquidity dried in March. But even when liquidity is not an issue will it still be working in the super low or negative interest rate environment? Appreciate all inputs. Thank you.

    #78650
    Vangelis
    Keymaster

    There are very valuable and correct points being made in this discussion. Let me try to show our point of view:

    The main purpose of developing these strategies was to cut down on risk and protect accounts from large drawdowns. LI was really born out of the 2008 crisis. Outperforming the SP500 was never our intention. But as James mentioned if someones wants to outperform they are welcome to create a portfolio using LI tools and then leverage it up, taking advantage of lower drawdown limits.

    We have 3 goals we try to achieve:
    a. Diversify: From individual stocks to ETFs, from ETFs to strategies-of-ETFs and from strategies of ETFs to a portfolio-of-different-strategies. What we could call a level-3 diversification.
    b. Limit risk: Cut down large drawdowns as to gain from long-term from growth. This means keep intelligent hedges that don’t cost money such as put options or (long) VIX ETFs and futures.
    c. Make it simple: Make complex rules-based models ‘investable’ and not just theoretically possible. This is a big deal since we do have complex option and futures-based strategies that we can (and have) build. But it makes no sense unless someone can actually realistically trade it, for the long run. So we tried to make everything come down to a handful of ETFs that one has to buy/sell once a month.

    Other than that we do not pretend to be very smart (except Frank who is actually a really a smart trader) or to create alpha out of nowhere. There is nothing wrong in just holding DIA or QQQ or a 60/40 SPY/TLT. The problem is that investors with no rules end up being aggravated by emotions and end up losing even though markets go up (for the most part) in the long term. So we provide some rules to help.

    You can see some actual historical returns by going back to our published end of year newsletters:

    https://logical-invest.com/the-logical-invest-newsletter-for-january-2020/
    https://logical-invest.com/the-logical-invest-mid-month-newsletter-for-january-2019/
    https://logical-invest.com/the-logical-invest-monthly-newsletter-for-january-2018/
    https://logical-invest.com/update-january-2017-401k-investments/
    https://logical-invest.com/the-logical-invest-monthly-newsletter-for-january-2016/

    #78537
    Barry Smith
    Participant

    Treasuries (TLT) are being used as the hedge for MAY. They were also available in prior months in the portfolio but were not used during the “black swam” event for this strategy. I find this to be a very strange occurrence, as the Bond strategy should be a somewhat “safe haven” low risk strategy for the long term. I got hit pretty hard during the past period. Since it has followed an “old” method without adequate hedging this should have been acknowledged to subscribers who are depending on this as a low risk bond strategy. I do like logical invest and I do like their approach, but this is a bad one.

    #78267

    Yes, this normally happens automatically in a crisis as the strategy looks for the bond pair with lowest volatility. However this time the bond liquidity squeeze came too fast and such very fast events can in fact only been handled if a fixed allocation of Treasuries is always in place. This increases security, however it also lowers return during periods where Treasuries did not perform well, like the 3 years from 2016-2018. During this period Treasuries like TLT lost and BRS did manage to achieve a 30% performance by excluding these rate sensitive Treasuries. But for us it is clear that capital protection is more important and so we will also install the permanent hedge for BRS. Personally I also think that a “black swan” event like a huge nuclear or biological terror attack in a big city is possible and if this happens over the weekend, then the stock market could well open 30% lower on Monday. There would be no time to install a hedge in time.

    #78265
    Barry Smith
    Participant

    I guess my assumption was that the strategy was hedged by using TLT and Tips to hedge the more volatile bond funds like JNK and PCY.

    #78000

    It may be wrong at the moment to liquidate the hedge (GLD or TLT) as for example TLT was trading last Wednesday 5% below the value of it’s assets. GLD is most probably also trading below its assets. This at least should recover once liquidity comes back to the markets.

    #77998

    In reply to: Gold as a hedge

    It may be wrong at the moment to liquidate the hedge (GLD or TLT) as for example TLT was trading last Wednesday 5% below the value of it’s assets. This at least should recover once liquidity comes back to the markets.
    In the forums I was telling that “I personally” close all my positions several times as it makes not sense to try to make money if volatilities of stocks, gold and treasuries are at these levels, however we are just not allowed by law to give a financial advice in an email like telling our subscriber to close their accounts. I can only reply to forum questions and tell what I do and I think.

    #77604
    Mark Vincent
    Participant

    Here is the Hedge With SH added:

    [StrategyTitle]
    Hedge SH
    [StockItems]
    #GLD-USD=#GLD-USD,2,1,1,0.00
    #Treasury hedge=#Treasury hedge,2,1,1,0.00
    GLD=Gold,2,1,1
    SH=,2,1,1,0.00,,0,0
    SPY=SPDR S&P 500 Index,2,1,1
    TLT=Barclays long term treasury (10 years),2,2,1
    [StockSets]
    StockSet43=Hedge SH,1,3,StockSetStrategy43,2020-02-04,2020-02-06,#GLD-USD@1,#Treasury hedge@1,GLD@1,SH@1,SPY@1,TLT@1
    [StockSetItems]
    StockSet43Item1=111111,StockSet43Item2,0,00000004,2,
    StockSet43Item2=110100,StockSet43Item3,1,00000008,2,
    StockSet43Item3=000001,StockSet43Item4,2,00000010,3
    StockSet43Item4=000010,StockSet43Item5,2,00000020,3
    StockSet43Item5=-,-,2,00001000,3,
    [StockSetStrategies]
    StockSetStrategy43=2,2,used only a sub strategy,110100,10,,1
    [StockSetStrategyParameters]
    StockSetStrategy43=-3,3,92,3,-2,7,-2,7,-6,7,-1,7,0.00,0,0.00,0,0,0,0.00,0,0.00,0,0.00,1,0,0,0,0,0,0,0,0,0.00,4,0.00,4,0,0,0,4,0,4,0.00,0,0.00,0,0.00,0

    Here is UIS SPY with the Hedge and SH:

    [StrategyTitle]
    Hedge SH
    [StockItems]
    #GLD-USD=#GLD-USD,2,1,1,0.00
    #Treasury hedge=#Treasury hedge,2,1,1,0.00
    GLD=Gold,2,1,1
    SH=,2,1,1,0.00,,0,0
    SPY=SPDR S&P 500 Index,2,1,1
    TLT=Barclays long term treasury (10 years),2,2,1
    [StockSets]
    StockSet43=Hedge SH,1,3,StockSetStrategy43,2020-02-04,2020-02-06,#GLD-USD@1,#Treasury hedge@1,GLD@1,SH@1,SPY@1,TLT@1
    [StockSetItems]
    StockSet43Item1=111111,StockSet43Item2,0,00000004,2,
    StockSet43Item2=110100,StockSet43Item3,1,00000008,2,
    StockSet43Item3=000001,StockSet43Item4,2,00000010,3
    StockSet43Item4=000010,StockSet43Item5,2,00000020,3
    StockSet43Item5=-,-,2,00001000,3,
    [StockSetStrategies]
    StockSetStrategy43=2,2,used only a sub strategy,110100,10,,1
    [StockSetStrategyParameters]
    StockSetStrategy43=-3,3,92,3,-2,7,-2,7,-6,7,-1,7,0.00,0,0.00,0,0,0,0.00,0,0.00,0,0.00,1,0,0,0,0,0,0,0,0,0.00,4,0.00,4,0,0,0,4,0,4,0.00,0,0.00,0,0.00,0

    Anonymous
    Inactive

    Hey guys,
    All securities in the strategies are traded on US exchanges and are subject to 30% withholding tax on dividends.
    I was thinking to sell before the ex-dividend date to avoid be hit by the tax.
    As far as I understand NAV will increase over time and dividend amount subtracted on ex-dividend date prior to open.

    This strategy should work on bonds like TLT or TIP that actually have their ex-div date on 1st of the month. So selling might make sense as new allocation for next month might not have them in the strategy.

    TLT currently has a yield of 2.2% on an investment of 100k that’s 660 of tax.

    Granted to the open price on ex-div date might be low or higher due to buying / selling pressure. Fees are not an issue for me as each trade is 1$ with my broker. Any thoughts?

    #76796
    Tom Gnade
    Participant

    @StefanM if you use the CASH strategy, it’s ultra-low volatility will act like a “lightning rod”. Try setting the volatility multiplier for CASH to about 25x in the Strategy Manager and observe the results. I’ve found using extreme settings like that causes instability in QT, so the cash stops in S3 are instead implemented using the volatility and cash Sharpe limits. I apply those limits only when they benefit the overall returns or reduce volatility/drawdowns, and only after the initial strategy is optimized. To answer your other question about holding stocks through earnings, yes, you can just manually inspect the list of stocks and check their recent performance. It’s perfectly fine to substitute a highly-ranked symbol for another. I sometimes choose alternatives just so I’m not all-in on tech stocks for example, or so I can avoid stocks with freaky looking charts.

    Overall, S3 is just a typical combination of hedge and risk sub-strategies, with a dash of Nasdaq-100 top 4 to boost returns.

    The hedge is constructed mostly of a mix of GLD and TLT, along with a few other symbols. I’ve been back and forth on using the inverse ETFs, but I’ve decided they are useful because they level out the hedge over time. Even if treasuries and gold are going down, the hedging sub-strategy is still able to move up. The inverse ETFs are used sparingly, because I don’t like their decay, but there are some periods of time when hedges are misbehaving when they prove useful.

    The risk sub-strategies are mostly based upon QQQ and SPLV, although I use a few other alternate symbols that have good long-term behavior. I hedge each individual risk symbol, apply the cash stops when they’re useful, then rotate between them using the SRE method. I’m not really inclined to share the .ini files because of the amount of work I’ve done on it. To get similar returns, you could just use the Maximum Sharpe LI strategy. Of course, I prefer my own QT strategy, which sits at around Sharpe ratio 2.3 over long and short timeframes, consistently returning about 16%. It plows straight through the 2000 and 2009 markets with solid returns. It’s a thing of beauty.

    If you have a higher risk appetite, just use any degree of leverage you’re comfortable with in your investment account.

    #70979
    Mark Vincent
    Participant

    Thank you for sharing Tom,

    Is there anyway you can post the .ini files for these strategies?

    For example here is the US Market Strategy with UIS QQQ (UIS QQQ is the same as UIS SPY using QQQ)

    [StrategyTitle]
    0 UIS QQQ US Market Strategy TLT GLD
    [StockItems]
    #UIS QQQ-hedged=#UIS QQQ-hedged,2,1,1,0.00
    DIA=,2,1,1,0.00,,0,0
    GLD=Gold,2,1,1
    QQQ=PowerShares Nasdaq-100 Index,2,1,1
    SPLV=SP500lowvola,2,1,1,0.00,,0,0
    SPY=SPDR S&P 500 Index,2,1,1
    TLT=Barclays long term treasury (10 years),2,2,1
    [StockSets]
    StockSet18=0 UIS QQQ US Market Strategy TLT GLD,1,3,StockSetStrategy18,2019-08-12,2019-08-18,#UIS QQQ-hedged@1,DIA@1,GLD@1,QQQ@1,SPLV@1,SPY@1,TLT@1
    [StockSetItems]
    StockSet18Item1=1111111,StockSet18Item2,0,00000004,2,
    StockSet18Item2=1111111,StockSet18Item3,1,00000008,2,
    StockSet18Item3=0000010,StockSet18Item4,2,00000010,3
    StockSet18Item4=-,-,2,00001000,3,
    [StockSetStrategies]
    StockSetStrategy18=2,2,,1111111,10,,1
    [StockSetStrategyParameters]
    StockSetStrategy18=-3,3,92,3,-6,7,-2,7,-8,7,-1,7,0.00,0,-200.00,1,30,1,0.00,0,0.00,0,0.00,1,0,0,0,0,0,0,0,0,0.00,4,0.00,4,0,0,0,4,0,4,0.00,0,0.00,0,0.00,0

    #70972
    Tom Gnade
    Participant

    I’ve decided I no longer want to use any leveraged ETFs in my investment strategies. The premise that they actually hedge market risk works, but only sometimes. Their inherent volatility can give you “shock and awe” moments – usually to the downside. ZIV was a trainwreck when the vol trade exploded, and hasn’t been much help since. I have done a lot of thinking about this, and here’s what I think will work best: a “super simple strategy”. It’s similar in premise to the BUG, in that the primary drivers are few, and we stick to the basics – no leveraged funds, SPY/QQQ/CWB as risk assets, GLD, TLT, SHY, and perhaps a few other symbols as “hedges”. The real trick here is that the strategy uses every single cash stop method available, separately, on each and every symbol and sub-strategy, to try to limit drawdowns, which I’ve found to be the real confidence killer.

    I begin by making a strategy for each of the foundational symbols that will be used as the primary drivers. These single-symbol strategies are only used to implement volatility limits and cash Sharpe limits, when they make a difference. For example:

    TLT 428.44% {CAGR:7.558, SR:0.586, V:12.896, DD:-26.59}
    TLT (with stops) 427.41% {CAGR:7.546, SR:0.617, V:12.232, DD:-20.26}

    Even a tiny “break” on the volatility does make a long-term difference. Sub-strategies are cheap, so let’s go with it. Every symbol we use for the S3 strategy will therefore be “stopped” using a combination of vol and Sharpe limits. So, where to go from here? One idea I’ve had for quite some time is that it might be great to pair bull and bear ETFs for the same symbol. I tested it dozens of ways, and it does work, but only for certain volatility profiles, and you have to use the bear symbols carefully. So, I use this approach for the Treasury and Gold hedges in a simple SRE rotation. To control utilization of the bear strategies, which often have terrible return curves, I increase their volatility multiplier, so the algorithm strongly prefers the bull side. By combining the bull and bear symbols for long-term treasuries (TLT, TBF), I obtain the following results over a 20-year lookback period:

    TLT/TBF 698.98% {CAGR:10.228, SR:0.873, V:11.714, DD:-19.32}

    Now we’re getting somewhere – this is a good result based upon simple rules. Remember, the goal here is to retain the shape of the treasury curve, so we still retain its “risk off” profile, but to improve upon it as a long-term holding in every possible way. I use the same approach for every symbol in the strategy, and the end result is quite surprising.

    In my quest to limit drawdowns, I’ve frequently observed that there are “magical sweet spots” in the optima that produce the best results, but that may be surrounded by poor results. Since we’re playing a statistical game with the future, I will steer clear of those “one off” results on the grid, often choosing lower optima that are surrounded by similar results. If I can find a range of lookback periods that all produce a similar range of results, then I conclude it is a statistically higher probability those lookback periods will be continue to function well in the future. Just a guiding principle. It would be nice to somehow code that as an option in QT, as well as optimizing on other criteria rather than Sharpe – for example the maximum drawdown, which is often much larger than the Sharpe ratio.

    Returning to the S3 strategy implementation, my next advancement was to think of ways I could develop a sensible set of “cash stops” that leverage the SR strategy. I’ve observed that combining several similar strategies in a simple SRE rotation can produce better results than any one of them alone. So, we begin with the “base” TLT-TBF rotation strategy, and then implement 2 variants that each use the “CASH” sub-strategy as the only other investment option. One of them is a “low cash” version, where it is limited to 30% allocation, the other is a “high cash” version, limited to 70% allocation. Here are the results:

    TLT/TBF low-cash 640.60% {CAGR:9.747, SR:0.905, V:10.774, DD:-17.62}
    TLT/TBF high-cash 562.66% {CAGR:9.037, SR:0.910, V:9.935, DD:-17.26}

    Notice the returns are lower, Sharpe ratios are higher, and the max draw-down in slightly lower than the base strategy without the cash stop rules. Combining the three together in a “Treasury Rotator” (SRE 1 rotation with its own volatility and cash Sharpe limits), the result is:

    TLT/TBF rotator 674.58% {CAGR:10.032, SR:0.916, V:10.952, DD:-20.00}

    It turns out the SRE strategy really only uses the basic TLT/TBF and TLT/TBF high-cash variants. Also, the results are good but not great compared to the simple TLT/TBF rotator, so you might think it’s not worth all the effort. However, other symbols respond better to this approach. Also, let’s compare the end result to a simple TLT holding, and to the built-in “Treasury Hedge” strategy in QT:

    TLT 428.44% {CAGR:7.558, SR:0.586, V:12.896, DD:-26.59}
    Treasury Hedge 420.39% {CAGR:7.456, SR:0.792, V:9.417, DD:-18.49}
    TLT/TBF rotator 674.58% {CAGR:10.032, SR:0.916, V:10.952, DD:-20.00}

    Since we’re using this strategy as a hedge, and we’re hoping the “rotations” we apply at higher levels of the S3 strategy eliminate some of the draw-down, I’m generally happy with this result. Here’s the results for Gold (GLD/DGZ):

    GLD 552.83% {CAGR:8.94, SR:0.509, V:17.568, DD:-45.56}
    GLD-USD (QT built-in Gold strategy) 595.31% {CAGR:9.345, SR:0.732, V:12.774, DD:-28.22}
    GLD/DGZ Rotator 988.69% {CAGR:12.158, SR:0.871, V:13.957, DD:-18.53}

    Not too shabby. Let’s see what happens when we simply combine the Treasury and Gold rotators into a simple SR2 strategy with minimum allocation 40%. Since these two strategies move in very different ways, the SR strategy can make quite effective use of the two by varying their allocations between 40-60%. Compare this to the QT built-in “Hedge” strategy, which uses a similar combination of Gold and Treasuries:

    QT Hedge 543.39% {CAGR:8.846, SR:0.771, V:11.481, DD:-24.04}
    S3 Hedge 897.16% {CAGR:11.614, SR:1.284, V:9.044, DD:-10.05}

    Wow, that’s a hell of a good result, isn’t it?

    Let’s see what happens when we do the same thing for QQQ, the Nasdaq-100 index fund from PowerShares. There is a Nasdaq bear ETF (PSQ), but I didn’t bother with it. In this case, all I do is take QQQ and implement the various cash stops to it directly. There is a base strategy for QQQ alone, and then one that uses a 30% cash stop, and a third that uses a 70% cash stop. Optimized over a 20-year timeframe, here are the results:

    QQQ 345.27% {CAGR:6.402, SR:0.232, V:27.548, DD:-82.97} Holy sh%t that’s a serious drawdown! If only we had simple cash stops in place…
    S3 QQQ with simple cash stops 819.14% {CAGR:11.107, SR:0.529, V:21.008, DD:-56.16}
    S3 QQQ Rotator with full cash stops 1447.55% {CAGR:14.320, SR:0.865, V:16.551, DD:-21.99}

    Wow! That’s something else, isn’t it? I happen to like the SPLV S&P 500 low-volatility symbol as well, so using the same approach with that symbol:

    S3 SPLV Rotator 2164.61% {CAGR:17.468, SR:0.889, V:19.644, DD:-29.09}

    Why not just flip-flop those 2 strategies against each other in a simple SRE?

    S3 QQQ-SPLV Rotator 3981.46% {CAGR:20.302, SR:1.151, V:17.634, DD:-18.63}

    Sweet result. I’ll cross my fingers and hope it comes true. Lol. Anyhow, back to reality. Let’s combine the S3 TLT/GLD and QQQ/SPLV strategies into a single S3 Risk strategy:

    S3 1475.39% {CAGR:14.522, SR:1.650, V:8.8, DD:-11.66}

    Comparing this result to the underlying symbols:
    TLT 428.44% {CAGR:7.558, SR:0.586, V:12.896, DD:-26.59}
    GLD 552.83% {CAGR:8.94, SR:0.509, V:17.568, DD:-45.56}
    QQQ 345.27% {CAGR:6.402, SR:0.232, V:27.548, DD:-82.97}
    SHY 140.33% {CAGR:1.998, SR:1.425, V:1.403, DD:-2.23}

    You would never think you could do that with those ingredients, would you? Let’s see what a simple SR3 rotation with a 60% maximum allocation would yield, without all the fuss of the cash stops and limits and such:

    TLT/GLD/QQQ/SHY (SR3, 60% max, SHY 20% max, 102d LB) 699.68% {CAGR:10.343, SR:1.188, V:8.703, DD:-10.92}

    Eliminating SHY:

    TLT/GLD/QQQ (SR3, 60% max, 98d LB, -150%MR, 25d MRP) 945.16% {CAGR:11.906, SR:1.435, V:8.298, DD:-12.41}

    And the QT Permanent Portfolio (TLT, SPY, GLD) for reference:

    QT Permanent Portfolio 748.29% {CAGR:10.605, SR:1.381, V:7.679, DD:-13.37}

    Overall, very similar results, though the QQQ variant is an improvement. I would suggest that change to the Permanent Portfolio in QT. Not too bad overall, considering we’re only using 3 symbols, with no cash stops at all. The “dumb” S3 plows right through the 2000 and 2009 meltdowns with aplomb. Wouldn’t you have killed for that back then?

    Still, implementing some cash stop-out rules and using a few extra rotation strategies, here is the result:

    S3 with stops: 1475.39% {CAGR:14.522, SR:1.650, V:8.8, DD:-11.66}
    S3 without stops: 945.16% {CAGR:11.906, SR:1.435, V:8.298, DD:-12.41}

    It’s been a worthy exercise, I’d say. A definitive improvement to the Permanent Portfolio that nearly keeps parity with a simple QQQ investment since 2009 (albeit trading costs would drag performance), but with less than half the volatility and a third the maximum draw-down. Here are the 10-year results compared to QQQ:

    S3 482.23% {CAGR:17.060, SR:2.103, V:8.112, DD:-7.33}
    QQQ 502.18% {CAGR:17.536, SR1.010, V:17.355, DD:-22.79}

    Of course, we know it’s not too easy to keep up with QQQ during it’s best rip in decades while maintaining a hedged portfolio with full cash stops. And, those stops are going to come in extremely handy the next time the market decides to go into nuclear meltdown mode, which will come sooner or later.

    Interestingly, we can improve upon these results still. If I add a similar strategy based upon the impressive CWB fund, and then also include one based upon the Global Markets Rotation Strategy (after giving it the old “S3” treatment) to improve upon the GMRS Hedged strategy results, an S3 Risk Rotator returns the following:

    S3 Risk Rotator 1422.32% {CAGR:14.569, SR:1.871, V:7.785, DD:-7.52}

    It’s an ok improvement I guess, it does cut the vol and draw-down a bit by incorporating CWB and GMRS. How about the real deal though? Starting in October, I’ll be using the S3 strategy, but I will combine it with the granddaddy of them all, the Nasdaq 100 top 4 “N4” strategy. The issue with N4 is of course the volatility. Also, since it picks 4 stocks, it poses a very focal risk. Therefore, I never allocate more than 20% of my total portfolio to N4, since any single stock should never really comprise more than 5% of your total holdings. Also, I will examine the individual symbols and often choose ones further down on the list if their returns look a bit more stable. I also like to avoid holding stocks if they are going to announce earnings during that monthly investment period. Earnings can often deliver a wicked down-side surprise, and I just don’t need any of that nonsense. So, what does this thing look like in an S3-N4 combination? We’ll call this the “real” S3 strategy, so here it is:

    S3 3244.38% {CAGR:21.315, SR:2.253, V:9.462, DD:-8.74}

    Hell yah, that’s what I’m talking about. Now, my personal implementation of this also includes one more little secret surprise that I don’t feel like sharing right now, but if you follow this same recipe, you will arrive at similar results. Happy QT’ing y’all!

    :)

    Tom

    Hi Ron, see my reply here, probably would have been better in this thread: https://logical-invest.com/forums/topic/moderate-risk-new-allocations-for-september-tlt/#post-69843

    With the 70% allocation to UGLD the strategy is basically in “risk-off” mode, and picks the better of UGLD and TMF, or the “lesser of two evils” as you say. I posted two screenshots from QT below, one for the 4 months look-back period and a 3yrs for the big-picture.

    Technically speaking, the strategy considers a volatility attenuator of 2, which means it is very sensitive to any change in volatility, and that’s what we’ve seen for quite some time now, basically since Q4 2018 the hedge was 40-70% of the allocation. Also it considers the reversion to the mean, basically it ignores or even penalizes the performance of the last month (based on the parameters performance is calculated as Performance last 84 days – 150% performance of last 21 days (25% of lookback)).

    As I referred to in the other thread:
    “That’s the psychologically tough part of Momentum driven strategies: Buy when things have already moved quite a bit, sell even if you think the party might re-start.

    However, we’re late in the cycle, and despite the ‘bit’ of volatility recently we’ve not seen any serious correction yet, were the flight to safety moves such safe-haven prices much more violently.

    Just some days ago replied to a comment re how negative yields feel like in Europe, so who says the 1.5% in the US is the bottom? See the comment by Vangelis today what it would take to devaluate the USD rate-wise.

    If you feel uncomfortable with long term bonds or gold, the signal basically says ‘risk-off’. Cash is an alternative, even if historically in our models you’d lost some of the performance.”

    4 months:

    3 years:

    Mark Vincent
    Participant

    Crazy Returns leveraged Models.
    I created a Meta Strategy for fun using 3 other strategies that seems to switch assets well. The Return is 50% over 5 years. The unleveraged version does well also. Her it is:
    1. Leveraged US Market Strategy (LB=20, SR, ETF=2, Max Allocation=70, Min Allocation =30, Vol Att=0)
    a. SPLV
    b. SPXL
    c. TMF
    d. TQQQ
    e. UDOW
    f. UGLD
    2. UIS using TQQQ (LB=28, DR, ETF=1, Max Allocation 90, Min Allocation=0, Vol Att =0)
    a. TLT
    b. TMF
    c. UGLD
    d. TQQQ
    3. MYRS ZIV-hedged
    a. ZIV
    b. TMF
    Meta Strategy (LB=104, SRRP, ETF=2, Max Allocation = 70, Min Allocation = 0, Vol Att=1.5)

    #57193
    Vangelis
    Keymaster

    Derrick,

    Since you have been with us you know our main strategies are changed/updated rarely. Maybe every few years. This past two months we have introduced 2 new strategies, and a new Hedge sub-strategy that affects all existing ones. When QT runs a backtest with the latest parameters, it just does that. Produces a backtest. So all allocations are based on the current parameters. So under the new Hedge strategy, N100 would have invested in TLT not UGLD. That does not mean that the signals issued at the time (UGLD) were wrong. It just means that we (and QT) are adapting to the markets and finding better solutions going forward. This happened in the past but was less pronounced. The actual signals and performances are here https://logical-invest.com/app/historical.php
    Also see a better explanation here: https://logical-invest.com/backtested-data-vs-historical-data/
    I hope this makes sense.

    #52675

    In reply to: Portfolio showcase

    reuptake
    Participant

    I’ve tried not to look at my portfolio value everyday, but end of month is near, so I’m preparing to rebalance.

    I went abroad for two weeks of May, so I had to rebalance bit earlier. It was very, very unlucky. Only now I learned, that for my portfolio of strategies hedge for May would be TLT if rebalanced last day of April. Unfortunately, when I did rebalancing it was mostly GLD, and GLD performed significantly worse than TLT. On May 15th portfolio value went down nearly 2% (mostly on GLD weakness).

    I’ll probably will continue with similar portfolio next month.

    Vangelis
    Keymaster

    In the context of LI strategies things are simpler. TLT is used as a hedge for many of our strategies (the most basic being the UIS strategy). What the hedge is supposed to do is to limit drawdown in a crisis. If you hold a portfolio that looses 50% of it’s value, you will have to gain 100% just to break even. So in long term investing, both empirically and quantitatively, it is of outmost importance to limit losses rather than to chase after high returns. The easiest way to limit losses is to hedge with an anti-correlated asset, such as Treasuries or Gold (and to of course diversify both in assets and strategies). So if the market fell by 50% in a period of few days, chances are that TLT (as a safe-heaven) would rise maybe 10, 20 or even 40%. Holding both would limit portfolio losses, which in the long run results in higher compound returns.
    TMF is used for the same purposes in our riskier strategies. It just “boosts” the hedge since 10% of portfolio in TMF is almost like buying 30% TLT. Whether TMF tracks exactly at 3x or 2.4X the TLT is of less importance. What is very important is that SPY and TLT, Equities and Treasuries, remain negatively correlated in the medium term so that a 2008 like crisis would result in Treasuries moving up and softening the blow.
    That said, if you were to trade UIS using SPY/TLT or SPXL/TMF or shorting SPXS/TMV it maybe better to short SPXS/TMV as you would gain a little extra return from the decay of both ETFs, although you would have to factor in borrowing costs. Hope this helps clarify.

    urghan2
    Participant

    [quote quote=51658]Leveraged funds have decay and do not track the underlying at the quoted multiplier. TMF in the long run will not perform 3x the TLT. That just means that it may perform 2.3 or 1.5 times the underlying, depending on the path. When someone says it is not recommended to hold leveraged funds it is meant in the context of expecting to make 3x or 2x the underlying. This is not what we expect with TMF. We use it as a hedge. Best is to look at a graph between TLT and TMF.
    TLT vs TMF

    [/quote]

    Hi.

    I read those two papers you mentioned above. Thanks! Still doesn’t quite get the idea of how gamma risk affects strategy performance when using monthly rebalancing and longer periods. Does it? Or does it even out itself? Maybe in the context of LI strategies?

    #51870

    In reply to: Portfolio showcase

    reuptake
    Participant

    I’ve got data from yesterday and after GLD drop, hedge switched to TLT again.

    #51787

    In reply to: Portfolio showcase

    Mark Faust
    Participant

    Thanks Reuptake…out of those 3 choices, I also would lean towards your favorite.
    I agree on the US Sector strategy…It has not been doing very well and the ERY component (even at 1/3 allocation due to its 3x leverage) has been doing horribly.
    A couple of issues I still have are the bond hedges we are currently using. I think that all the backtesting is still utilizing the timeframe when bonds were a viable hedge. Personally, I do not think they will be a decent hedge for a while to come.
    I do understand that the recent hedge allocation is moving everything to GLD which I am not sure is necessarily the greatest hedge either. Especially at 100%.
    I have been working on another momentum based minimum covariance algorithm which uses GLD, TLT and DBC as its hedge (if you will). The choice of DBC spreads out the commodity hedge across multiple entities and not just all Gold.
    I will have to make a change as well as I believe the US Sector is facing a tough road ahead. Good luck…
    Mark

    [quote quote=51786]I’m preparing for the next rebalancing. I’ll have to do it bit earlier, since I fly away for holiday Friday morning.

    I’m not fan of changing portfolio allocations every months (for most 2017 I’ve maintained the same allocation) but this time I think I’ll do quite substantial changes. I want to reduce investment in US Sector strategy which was 30% of my portfolio. I have serious doubts in robustness of this strategy (which I shared with LI team).

    So I have 30% to distribute among other strategies.

    [/quote]

    #51679
    Mark Faust
    Participant

    Thanks Reuptake…..
    Is it me or does nothing seem to be holding a negative correlation in the hedges……..
    It seems the market goes up and TMF/TLT goes down… (expected)
    Then the market goes down and GLD/TMF/TLT goes down….

    With the high concentration in TLT/TMF hedges, we lose money/barely break even when the market jumps up…
    Then when it drops, the hedges either drop or dont kick in enough and you lose money again….

    I know I am just complaining….but losing money sucks…..I guess I need to find the right combination….
    Even SoS is sitting at 5.01%…..Maybe I should just go that route and leave the creative combinations to the professionals…

    off the soapbox now….
    Mark

    [quote quote=51650]

    So…I have been keenly watching the latest “Hedge” strategy…..
    It has been bouncing back and forth between GLD and TLT and since it is a “Top 1 ETF” it is bouncing at back and forth at 100%.
    While I can see that the optimization favors the single ETF theory, I wonder if it would not be better to diversify the hedge fund a bit and take the top 2 ETF’s??? This lowers the CAGR/Sharpe but also lowers the volatility and the DD…

    I was testing this and Top1 is performing bit better. But then again I’ve tested UIS and WTOP4 strategy using GLDUSD strategy as a hedge. And the performance is pretty decent. So my plan is when Hedge is 100% TLT use GLDUSD version of one of those strategies, to diversify a bit.

    [/quote]

    Vangelis
    Keymaster

    Leveraged funds have decay and do not track the underlying at the quoted multiplier. TMF in the long run will not perform 3x the TLT. That just means that it may perform 2.3 or 1.5 times the underlying, depending on the path. When someone says it is not recommended to hold leveraged funds it is meant in the context of expecting to make 3x or 2x the underlying. This is not what we expect with TMF. We use it as a hedge. Best is to look at a graph between TLT and TMF.
    TLT vs TMF

    #51650
    reuptake
    Participant

    [quote quote=51644]So…I have been keenly watching the latest “Hedge” strategy…..
    It has been bouncing back and forth between GLD and TLT and since it is a “Top 1 ETF” it is bouncing at back and forth at 100%.
    While I can see that the optimization favors the single ETF theory, I wonder if it would not be better to diversify the hedge fund a bit and take the top 2 ETF’s??? This lowers the CAGR/Sharpe but also lowers the volatility and the DD…

    [/quote]

    I was testing this and Top1 is performing bit better. But then again I’ve tested UIS and WTOP4 strategy using GLDUSD strategy as a hedge. And the performance is pretty decent. So my plan is when Hedge is 100% TLT use GLDUSD version of one of those strategies, to diversify a bit.

    #51644
    Mark Faust
    Participant

    So…I have been keenly watching the latest “Hedge” strategy…..
    It has been bouncing back and forth between GLD and TLT and since it is a “Top 1 ETF” it is bouncing at back and forth at 100%.
    While I can see that the optimization favors the single ETF theory, I wonder if it would not be better to diversify the hedge fund a bit and take the top 2 ETF’s??? This lowers the CAGR/Sharpe but also lowers the volatility and the DD…

    thx
    Mark

    reuptake
    Participant

    This is strategy I’m using from this month replacing GMRS hedged in my portfolio. The only difference is that it uses GLD-USD for hedging instead of Hedge. Performance is very similar to original GMRS, but gives me some exposure to GLD and reduces exposure to TLT which is pretty high for my taste.

    GMRS hedged with GLD

    #51316

    In reply to: Portfolio showcase

    reuptake
    Participant

    [quote quote=51301]Update for April….

    [/quote]

    Thanks for sharing!

    What I’m thinking about now is using some strategies with GLD as a hedge. I feel uncomfortable with so much allocated in TLT. For my portfolio it will be 32.5% TLT and 12% TMF which is equivalent of, roughly 68.5% in TLT.

    I changed hedging strategy from “Hedge” to “GLDUSD” for some strategies, and backtest results are quite similar. So I may use one of those, when Hedge is 100% into TLT.

    #51301

    In reply to: Portfolio showcase

    Mark Faust
    Participant

    Update for April….
    I looked at the results from MTD, YTD, 1 year, 3 year, 5 year and Max.
    I kept the same strategies but changed up the percentages a bit.

    • 25% GSRS
    • 25% Nasdaq Hedged
    • 25% US Sectors
    • 25% World Top 4

    1 year
    • 21.58 CAGR
    • 2.65 Sharpe
    • 8.15 Volatility
    • -6.85 DD Range

    Max
    • 23.69 CAGR
    • 2.83 Sharpe
    • 8.37 Volatility
    • -6.85 DD Range

    It still has a lot of Bonds (TMF & TLT) which make up 45% of the portfolio..(more if you factor in the TMF leverage.) While the numbers above only show the portfolio using the top 4 entries in the Nas100, I will be using the top 8… Happy Trading..
    Mark

    Anonymous
    Inactive

    [quote quote=50710]

    Dear Stefan,

    We usually work with the assumption that all strategies are available to our subscribers. This is why we made such a recommendation. Obviously this is wrong and we apologise.

    How you would determine when it is recommended to re-enter into 3xUIS? Is it based on VIX having held a certain level for a certain period of time?

    You can re-enter when the VIX future’s term structure is back to normal, ie when the curve at vixcentral.com slopes upwards and it is time to rebalance.

    That the subscriber community would be informed of that change/improvement in the volatility environment.

    We can post/email when this happens.

    As I took the LI Investment Outlook comment as a discretionary recommendation to exit 3xUIS, can I please recommend that the LI team model in QT returns based on rotating out of 3xUIS and into 1xUIS.

    This would confuse a new subscriber 1 year from now. They would be looking at the UIS 3x chart and history and suddenly see a different allocation, using different ETFs. If the market was to crash tomorrow, they would look back and be sure we are somehow cheating. The forum, the newsletters and both UIS and 3x UIS signals are available online so that everyone can research and track what happened.

    I would also recommend that LI make it very clear when apparently discretionarily overriding a strategy and make explicit the basis of the reason for this override and when LI recommend re-entering the strategy.

    We will do that. If we override, we will be clear about it and write it in the signals post or via private email. Not in the newsletter which is opinion and published to the general public.

    Furthermore, we had a February recommendation to invest in Gold which is no longer in the March recommendation – can you please confirm why this changed?

    I assume you mean this:
    “Our strategies have been adapted, starting this February, to include gold in our new hedging mechanism. Gold is a well respected safe heaven asset. It performs well in inflation regimes and can be a “go-to” safety asset for institutional investors if stocks and bond fail. You can read more about this major update in Frank’s article.”

    This is not a recommendation. We adapt our strategies once every few years to keep up with market changes. We added Gold as an extra hedge to our strategies. The strategy algo may (or may not) allocate to gold depending on the state of the market.

    Thanks for clarifying. I just plan to stay true to the blue line express signals (3x UIS), rebalance and press on. Its done me well since 2014 and nothing has changed that. I expect bumps and bruises along the way and I have a 10 year time horizon and can take on these risks.

    Even when one enters at worst possible time, the strategy always seems to adapt and make rebounds. I will admit that the maximum yield strategy is looking good for entry now.

    [/quote]

    While we cannot ever know for sure the future, following the strategy signal paid off for March adding another 3% to my portfolio for the month. Had I not switched, I would have seen nearly 5% loss.

    Even with FED raising interest rates late into month, the 10yr rate, which everyone on TV predicted would rise above 2.9% and possibly take out 3% soon after, never occurred. Quite the opposite happened.

    It’s nerve racking to hold big positions in TMF when everyone is telling you that interest rates will rise. Since TMF has to fall lower under that scenario, you start second guessing everything. The fact is that no one knows anything for sure. Even with the FED .25% raise, the rate which briefly rose above 2.9%, didn’t hold and has now fallen below 2.75%.

    I know TMF and TLT aren’t based on the 10yr rate, but that metric is most closely tracked on TV and is an indicator on the short term 20 and 30yr rate direction as well.

    I still don’t quite fully understand these interest rates and how their trends are so easily predicted, but fool just about everyone doing so. Most articles posted here just focus on the correlation aspect between stocks and bonds so maybe that’s all I need to know or care about in this strategy, but I still scratch my head on why the experts can’t get it right when the obvious happens.

    #51253

    In reply to: Portfolio showcase

    reuptake
    Participant

    BTW: I’m using the same allocations for April. That said, even if GLD has worse performance than TLT I will miss it from my portfolio, I’d prefer to have a hedge not so much concentrated on TLT.

    #50701
    Vangelis
    Keymaster

    Bryan,

    Your number (2) example is correct.

    A simpler example:
    SPY
    EFA
    EEM
    TLT

    The last stock/ETF in the list in the portfolio manager works as a ‘hedge’ if the DR Algo is chosen and will always be included. So when we pick DR and Top 1 ETF, the algo will pick the best ETF from SPY/EFA/EEM and then combine it with TLT. The result will be allocation to two ETFs always inclusive of the last ETF.
    In the Nasdaq 100 hedged, the last symbol is #Nasdaq. So the DR algo would rank TMF and UGLD and then combine the best with #Nasdaq, i.e., what you mentioned as choice (2).

    Alex just included a much needed table explaining the modified sharpe algos in this new post:
    https://logical-invest.com/video-tutorial-quanttrader-a-complete-walk-through-for-new-users/

    reuptake
    Participant

    I’ve played with QT a bit today. Started with Nasdaq 100 strategy. It’s interesting, because we have long history of Nasdaq stocks, comparing to relatively short history of some ETFs. That said there’s survivorship bias: from what I understand QT has only list of stocks that are currently in Nasdaq 100 index.

    When I run optimizer on Nasdaq 100 strategy with more than 4 stocks and SR instead of SRE I found out that there’s another “island” of pretty good Sharpe, but with Vol Attenuator around 10 (not 0.5 as in original strategy).

    So I set up strategy Nasdaq 100 LowVol. The stats for 20y period, are (CARG/Sharpe/Volatility/MaxDD)

    Nasdaq100LowVol 24.70 / 1.22 / 20.30 / -31.94%
    Nasdaq100 53.35 / 1.40 / 38.23 / -67.45%
    QQQ 7.06 / 0.25 / 28.16 / -82.97%

    The period includes infamous internet bubble crash. What’s interesting is that while original Nasdaq100 has much higher CARG, LowVol seems to be much less volatile.

    So then I set up hedged strategy. I’ve used Hedge strategy not TMF/UGLD, since we don’t experience volatility which justify use of leveraged ETFs. Side effect of using TLT/GLD as a hedge is that we can test strategy performance during 2008 crisis. And it’s not bad:

    Nasdaq100 hedged LowVol 21.27 / 1.94 / 10.95 / -13.04%
    QQQ 13.31 / 0.66 / 20.29 / -53.41%

    Big improvement in terms of volatility/max DD.

    Comparing with Nasdaq100 hedged from May 20, 2009

    Nasdaq100 hedged LowVol 20.23 / 2.22 / 9.12 / -9.22%
    Nasdaq100 hedged 46.93 / 2.23 / 21.07 / -15.33%

    Parameters for Nasdaq100 LV are:

    And for Nasdaq100 LV hedged

    This is just some example, not a strategy I would actually use. I still have concerns about robustness of strategies created by QT, especially when strategy is created with metastrategies. Survivorship bias for Nasdaq 100 could be another big problem: most of the “internet bubble” companies are not around anymore.

    #50576
    reuptake
    Participant

    Now I see the announcement when I opened previous version of QT… Probably QT11 was already using new hedge so the annoucement wasn’t displayed.

    I believe the new hedge would be as efficient as the previous one, although I feel less comfortable using just one big allocation in one ETF as a hedge (previous strategy was more diversified). Eg. now my set of strategies is more than 50% in TLT…

    #50567

    In reply to: Portfolio showcase

    Mark Faust
    Participant

    I have decided to go with the following for this month….

    • 20% GSRS
    • 30% Nasdaq Hedged
    • 30% US Sectors
    • 20% World Top 4

    • 25.88 CAGR
    • 2.80 Sharpe
    • 9.2 Volatility
    • -7.72 DD Range

    It still has a lot of Bonds (TMF & TLT) which make up 34% of the portfolio..(more if you factor in the TMF leverage) I may replace 5%-7% with GLD or increase the REW component just a bit…..Have not decided….Looking for a better month than Feb. Happy Trading..
    Mark

    #50455

    In reply to: Portfolio showcase

    Mark Faust
    Participant

    Reuptake,
    While I really like the numbers of this strategy, I am not a fan of 22% being in TLT…..That seems like a lot given the recent history in bonds and where they are headed in the future….What do you think of replacing some of the TLT with some GLD? or even a little more SDP???

    [quote]Fixed strategy with: 20% GSRS, 30% NASDAQ100 hedged, 30% US Sectors and 20% WTop4 has better backtests results: CARG 26%, Sharpe 2.83, Volatility 9.32… and is less prone to overfitting.
    Even fixed strategy with allocation given by you has very bit better performance than adaptative one.
    I have to say that I still can’t see clear benefits of adaptative strategy of strategies approach. What would convince me? Much better results for wide range of lookback periods.
    [/quote]

    #50027
    reuptake
    Participant

    I’d like to discuss correction that we’re all witnessing now. I don’t want to spread fear but talk about whether we should do anything about it or rather keep going as usual.

    The hard facts are:

    1) We experience severe drawdown (in just few days it exceeded 5 years max DD for most strategies) – and there is a (quite high in my opinion) possibility that drawdown will deepen
    2) Our hedges are not working very well (TLT/TMF doesn’t work at all, GLD is not much better, only thing that kind of works is EUO)
    3) The correction started at beginning of the month after very good January, so our strategies are at nearly full-risk mode.

    It’s hard to predict right now if it’s “healthy” correction and everything will go back to “normal” (or some “new normal”) or it’s just a start of some longer bear market.

    So, what can we do about it? First idea is to do nothing, just wait for the month to end and then rebalance portfolios as usual. One can also think of adding risk to portfolio (to recover faster) or switch to less risky one (to be more drawdown proof), even to go fiat.

    What I’m considering right now is rebalancing earlier, near 15th Feb. From what I see it’s enough time for the strategies to adjust a bit. The thing is even if strategies are slowly allocating less to risky assets, the rebalancing will rather not lead to having lower allocation of risky assets in portfolio. Eg. even if SPXL allocation goes from 80% to 70% when running QT now, SPXL went down more than 20% during last week, so we’d actually have to buy more of it.

    What are your thoughts? Are you going to do anything?

    #49972
    reuptake
    Participant

    Tom, I understand now, but I still don’t think one can create a robust strategy like that. Your proposal is adding a several parameters to strategies. Eg. what level of correlation would cause a move to cash, how long should it take, do we allow correlation to be high when risky asset is rallying (would you sell everything if both SPY and TLT are going up?) Then you have to test this, and we have very limited testing period, composed mostly of bullish market. For simple “legacy” SPY/TLT strategy we have 2 principal parameters (lookback, volatility attenuator). Your proposal is to add at least another 2 (lookback for correlation, correlation level that triggers stop). Overfitting is hard to avoid. Especially when considering that this “cash everything” events would be rather rare and during our testing period we’ll have just a few (3? 5?) occurrences.

    Even now I’m very concerned if some of strategies we trade are sufficiently robust (especially since things are getting complicated more and more, eg. hedge isn’t simple TLT, but another strategy, which is strategy of strategies and so on).

    I’m less concerned about market orders because most of our assets are quite liquid.

    This is of course just my opinion, I’d love to hear what Frank/Alexander/Vangelis think about it.

    #49962
    Tom Gnade
    Participant

    I just mean if we could model the existence of trailing stops that would trigger at any time, rather than only at the reallocation frequency. If there were “triggers” that we could design around VIX spikes or non-negative correlations between the assets we define as “hedges” (TLT/TMF/GLD/UGLD) and those we define as “risk” (ZIV/QQQ/TQQQ/SPY/SPXL/Nasdaq100), then we could test the effect they might have. They could trigger a move to cash until the next reallocation on whichever assets they are configured. In the trading platform, they would be implemented as one-triggers-other sales using trailing stops or other conditional orders.

    Derrick
    Participant

    I would be interested in hearing how subscribers are adapting their portfolios in light of the new hedging strategies, particularly their allocations to MYRS, UIS3x and Nasdaq since they use hedge3x. If I understand the parameters of these updated leveraged strategies correctly, it looks like there is the potential for the new MYRS and Nasdaq 100 to be 100% in UGLD.  (hedge3x max allocation 100% and UGLD max allocation within hedge3x 100%) UIS3x hedge3x is max 80%.

    Since 2012 UGLD has maintained only a small allocation in these strategies, but that’s not a very long lookback and only in a low volatility bull market.  The regular hedge strategy has a very different structure and not just because it is unleveraged.   It uses currencies and maintains a minimum allocation of 20% to TLT, if I am understanding the QT parameters correctly.  My concern is that the new strategies probably look very different prior to 2012 and may in fact diverge sharply from the unleveraged strategies in a bear market.  I want to know how hedge and hedge3x would have performed within these strategies outside of this bull market.

    #47484

    The assumption is that TMF will absorb some losses if/when ZIV goes down, and that’s a fairly yuuuge IF.

    Remember, ZIV is shorting the 4th,5th and 6th future of the VIX term curve, so each dollar these increase is a dollar hit to ZIV (ignoring some other effects).

    I´m just looking at the Term curve, and you can see in attached chart that compared to Oct 31st the futures went up by about 1.5 (actually 1500, as multiple is thds) – this explains the dip in ZIV. Now, one thing must be clear when investing in inverse / short volatility: If some fecal mass hits the fan, even these medium term futures can go through the roof and resulting losses are theoretically unlimited – the ETF ZIV probably would be terminated and something between 0 and estimated 20% would be payed out. That’s the ZIV part, now to the hedge.

    TLT or it´s triple TMF up to our research is the best hedge when shorting volatility (beside some exotic option or future things which normally are out of the reach of retail investors). The a historical correlation of -0.45 to S&P500 comes from two effects: 1) Economic cycle and interest rates, but more importantly 2) “flight to safety” when things go down.

    Now, there are three main problems with that:

    1) We´re investing in inverse volatility, not the S&P500, and as stated above, there is a yuuge lever (formally beta) between both, e.g. if S&P500 dips by 1% VIX goes up 1% times X, and this X can be exponential, so the above stated correlation which provides a hedge to S&P500 will fall short in extreme movements of the VIX term curve. But again up to our research bonds are the best hedge for retail investors.

    2) Correlation is not causality: Means there is no direct cause-effect relation between TMF and ZIV. As in recent days BOTH can go down due to fundamental reasons (rate hike expectation / China/ Japan in our case). How long? Depends :-) Sometimes both can decouple for months, see the correlation chart.

    3) The allocation between ZIV and TMF depends on the medium-term optimization the algo is doing. If we´re 80% into ZIV like in the current allocation (because of relatively muted medium-term volatility ), then the 20% TMF are not too much of a hedge if volatility suddenly spikes as the last days).

    So, as we´ve repeatedly stated, before investing in MYRS:
    – Make sure you really and deeply understand what it is and how it works – and I mean “really and deeply”
    – Do not invest your home and pension into this strategy – it´s meant as a complementing return boost for a well-balanced portfolio – I personally would never ever invest more than 15% of my net worth into this, and I´m not retired yet (well, a bit :-))

    Answers in short: Yes you should be concerned (that’s a natural process), level depending on your “really and deeply” understanding of, and % allocation to MYRS. And no, MYRS has at least the potential to take your last trouser from you in a bear market, will this happen? Who knows.

    Attached the charts, hope to continue discussion.

    All the best,
    Alex

    #41094
    reuptake
    Participant

    [quote quote=41083]Hello – the updated allocation for this strategy is ACWV + TLT, but TLT is not the best bond ETF. Can you check into this and either correct the signal or let me know if I missed an update to the strategy? Thank you.
    [/quote]

    I have the same question, I even send a mail about it. For last few months I even used BRS strategy as a hedge for GMRS instead of single bond ETF. Now I’m bit puzzled, what should I do, since TLT is not used in BRS for next month.

    #37344
    dwedel812
    Participant

    Now that BRS top 1 is the bond hedge for both World top 4 and Global sector it seems to overweight bonds if you are holding these strategies. For example,
    A portfolio consisting of:

    BRS, 10%
    World top 4, 20%
    Global sector rotation, 20%
    Max Yield, 25%
    Nasdaq 100, 25%

    This custom portfolio has a current allocation for december of 32% in JNK. It would be interesting to see how World top 4 and Global sector perform in a backtest without the BRS bond hedge. Instead using up to 50% allocation in a couple of 1X Short etfs and/or just TLT.

    Also notably missing from the asset classes is biotech. Ishares has about 50 sector etfs. I think some of the sectors in the asset class list are more industry specific like KOL, MOO, CUT etc and some are more broad sectors such as the Ishares series which is not necessarily a bad idea to mix. But given the industry specific etf are more volatile they might be treated differently by selecting the top 2 sectors and top 2 industry specific etfs for a total of 4 holdings.

    #37339
    dwedel812
    Participant

    Have you considered backtesting using the 1x short Nasdaq etf and/or straight TLT as additional possible hedges?…model to choose only 1. I think the 3x treasury could sometimes washout gains and/or dominate the trajectory. The short etf would likely juice up the returns in 2008 or market corrections more so than 3x tlt.

    Same idea with other models add the short s&p 500 1x option.

    #36367

    I received a question on how to build a meta-strategy and or fixed weightiong portfolio, which I´d like to share:

    Q:”I am subscriber of your software. Currently, I am using your standard strategies, which you are email me each month, I would like to set optimal alocation in QUANT Trader for these strategies next month. Can you get me clue how to divide alocations by Quant Trader between all strategies to get best ratio?”

    A:”QuantTrader allows you to build what we call “Meta-Strategies”, these allocate dynamically to the underlying strategies and react much better to different market environments. This is what you are looking for, I guess.

    See example below:
    – Equity: Nasdaq + World Top4 + GMRS
    – Currency / Gold as non-correlated strategy
    – TLT at portfolio level on top as hedge
    – Portfolio level volatility limit of 12% (sometimes goes to cash)

    Look for different ranking algos (No, SR, DR) and different min and max allocations to get to a well-balanced approach, e.g. avoid extreme corner solutions. I attach a DR example, e.g. first optimum allocation between strategies, then best mix with bond, and a min 30%, max 40% allocation with about one month lookback. Another option is “No” ranking, e.g. equal weight between the five components, which looks similar, but you see bigger drawdown. Tip: Select only 3 or max 4 strategies, with a fundamental reason, e.g. equity, correlation, hedge.

    Then automatically you get the allocations to strategies and ETF each month, like below:

    1

    If you prefer to stick to static, fixed weighting among the strategies, then you can set the min/max weightings in the Portfolio Manager window for each strategy, see last screenshot. I think the dynamic approach like above is more advanced though.

    This is just a quick example, by no way the best. Let me know what you find, or post as example for others in the forum. I open a topic with this explanation.

    Hope this helps.
    Alex

    Example Dynamic Ranking:

    2
    3

    Example Fixed weight 10% for Nasdaq:

    4

    5

    #35518
    evan.pease
    Participant

    I know that your approach is very quantitate and data-driven (which I prefer as an investor). But, I’m genuinely concerned that bonds are no longer a reliable hedge due to monetary policies. Do you think this thesis holds water? If so, how will the strategies adapt?

    If monetary policy is ever normalized (debatable), I’m sure the SPY/TLT correlation will come back down. I’m more concerned about what to do in the meantime.

    #16438
    William Keys
    Participant

    Hello….

    I invest in four strategies across six accounts. To simplify my trading, I convert all signals involving TLT and EDV to lesser $ amounts of TMF plus cash. I believe I am maintaining the proper hedge and leverage ratios while at the same time freeing up cash for dry powder and/or additional investment activity. It seems like a win-win situation. Am I missing something and is there a downside to this technique?

    Thank you.

    #16408
    Frank Grossmann
    Participant

    Hello Greg. I am always reading Cliffs SA articles and he also gives me sometimes good ideas, but I think that using TBF as a hedge is fundamentally wrong. TBF is the same as shorting TLT. The biggest no go of using this as a hedge is that it is no hedge anymore because TBF has a positive correlation with the stock market. If there would have been any bigger crisis during cliffs backtest period, then stocks and TBF would both have gone down. Also using TBF is betting against the trend. Longer term, treasuries will always go up. So, keeping an inverse treasury is just very risky. Then you could as well hedge with SH which is the inverse SPY.
    In fact these are long/short strategies, and I did hundereds of backtests with such strategies, but because of the short part of the strategies these always lagged strategies which only invest long with the trend.
    One idea was for example to construct a market neutral strategy by going long the top x ETFs and going short the bottom X ETFs. But this does not work, because even if you short always the worst ETFs, it is very difficult to have have a positive performance because even if these ETFs are bad, they still have a positive trend due to inflation and other things. Shorting good ETFs like TLT or SPY is even worse because you have a strong uptrend against you. Worst of all for a hedge is a volatility ETF. There you have several percents of downtrend per month against you.

    #16195
    wigmoney
    Participant

    Hello..

    When you say by, “Now you just have to add the treasuries together and buy only once (EDV= 1.5xTLT) and you are perfectly protected.” Can you give me an example.. I just started using the Bond, Market and Sector strategies and also noticed the duplication of the bond hedge.. TLT/EDV.. So if I am using $35,000 for my EDV % in the Market Strategy then I need to by $52,500($35,000×1.5) of TLT for the same exposure?

    Thanks..

    #15737
    Roger
    Participant

    I would have liked this stategy UIS back tested using spy/vustx as proxies. Vustx behaves like tlt but goes all the way back to 1990. This would help us see how it worked through the “other” great bear mkt.of the last decade and seen how your new “adaptive” hedging would have worked. The 90s l.t.treasuries had many pos. correlations periods with spy when spy was going down. for quite awhile.
    Please consider further research for this strategy development especially to address.what to do when spy and its hedge are both losing money over an extended period.
    Thank you in advance

    #15664
    Vangelis
    Keymaster

    You can replace EDV for TLT. EDV is the zero coupon version, so more a pure play interest rates, more volatile and less liquid.

    SVXY is a direct swap for XIV, with is the short duration and more volatile version of ZIV.

    Trading these, and especially options

    Tread carefully, slowly if you are not used to trading options on things like this, they obviously create new levels of risk. I trade and portfolio hedge with options on both, and they often require watching/managing daily & never ever use market orders as the bid/ask is often very large or you will get awful fills.

    #15482
    Frank Grossmann
    Participant

    No, I think like this BRS and GMRS are much better hedged or diversified than before.
    Before it was well possible that BRS and GMRS have been all invested in ETFs with a positive correlation to the stock market. Something like CWB, JNK + MDY.
    Correlations between ETFs had no influence on the investment. Also when invested in a hihg volatile ETF like ILF, the overall allocation has not been modified.
    Today GMRS would automatically adjust the treasury part to reduce the high ILF volatility, and the same happens for the BRS strategy.

    Now you just have to add the treasuries together and buy only once (EDV= 1.5xTLT) and you are perfectly protected.

Viewing 69 results - 1 through 69 (of 69 total)