Home › Forums › Logical Invest Forum › Modified Permanent Portfolio (MPP)
- This topic has 10 replies, 5 voices, and was last updated 5 years, 6 months ago by
Frank1 Grossmann.
- AuthorPosts
- 10/07/2020 at 12:37 am #80319
Richard Thomas
ParticipantI would like to discuss a strategy I have been working on and would welcome any feedback.
All my optimizations use a 5-year lookback period. I know there has been much discussion about this over the years and there does not appear to be firm consensus on the best period to use, however 5 years covers a good growth period and some good pullbacks in 2015, 2018 and 2020 so it feels to me to be a reasonable representative period.
Whenever I run the optimizer, I do not always use the red square. I try to find a good result square that also has good stable results for the 8 squares immediately around it.
I have not carried out any analysis using the volatility limit or the advanced QT settings.
All the stats are based on data at the end of Sept 8th 2020.Starting Point Permanent Portfolio
My starting point was the Permanent Portfolio. I like that this is a very simple strategy that only uses three ETFs and is “self-hedging”. The 5-year results are CAGR = 11.192 with MaxDD = -17.38. My objective is to increase the CAGR to 20+ and reduce the MaxDD to better than -15.
I started off with finding a replacement for GLD and created a Precious Metals (PM) strategy that consisted of GLD, SLV, PALL, CPER, JJC and PPLT which gave much better results than GLD alone. On further analysis removing the worst performers (CPER, JJC and PPLT) gave much better results.

Incorporating my PM sub-strategy into the MPP with SPY and TLT also gave much better results so I knew I was heading in the right direction.
Improving Treasury Hedge
I then tried to find an improvement on the treasury element and replaced TLT with the Treasury Hedge. Despite the TH having similar CAGR to TLT but a much better MaxDD it actually gave a worse result when combined with the PM strategy and SPY. I have found this on multiple occasions when using sub-strategies in a meta strategy in QT; sub-strategy A may have better stats that sub-strategy B but the combo of B with another sub-strategy C gives better stats than combining A with C because B marries with C better. There is no way of knowing this beforehand, so I always have to run multiple versions of sub-strategies with sub-strategies.
Equity – Stock & ETF option
So, the final piece of the picture was to find an improvement on SPY. I tried multiple options of this – QQQ, Nasdaq 100 balanced hedged and not hedged and finally came up with two options; a stock option and an ETF option.
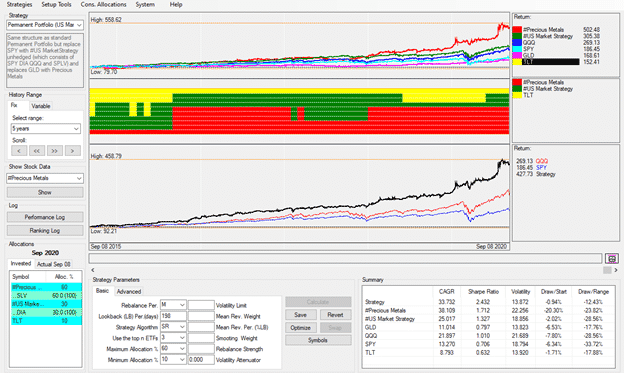
The ETF option is to use the LI US Market Strategy which selects one of QQQ, SPY, DIA or SPLV.
The stock option uses my modified version of the US Market Strategy and replaces QQQ with my version of Nasdaq 100 balance unhedged and replaces DIA with the LI version of DOW30 balanced unhedged and leaves SPY and SPLV unchanged.Both gave excellent results with the ETF version having a CAGR of 33.73 and MaxDD of -12.43 both of which exceeded the targets I had set myself at the beginning of the exercise.
The stock version has a further improvement in CAGR at 39.82 for effectively the same MaxDD at -12.57
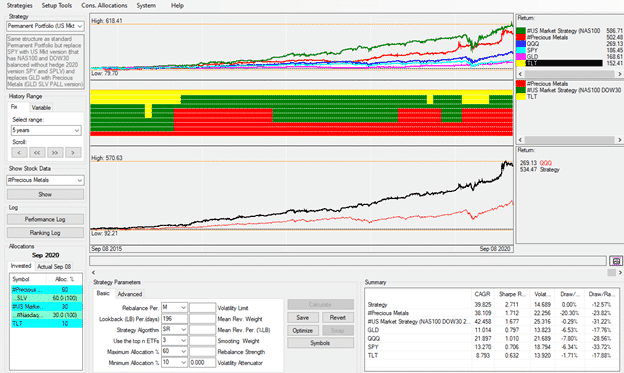
When constructing my stock version of the US Market Strategy I did look at using the hedged versions of the NAS100 and DOW30, but these variations all gave worse results. One thing I have found with the LI strategies is that as most of them are hedged, when they are combined into a meta-strategy which itself can also be hedged there can effectively be an overabundance of hedging, so using the unhedged versions of the base strategies will usually give better overall results.
There are probably improvements to be made to this strategy and other testing to be carried out, but it looks to me like it has a reasonable platform for going forward and it did capture the big jump in SLV in July.
You can download a QuantTrader version with all the needed files here: QuantTrader527S Modified Permanent Portfolio.
I would welcome any comments.
Richard Thomas
11/11/2020 at 12:05 pm #80528Nelson Brady
ParticipantI downloaded to play with it. The file does not say the % allocation to each of the 4 strategies?
I tried 25% to each and if I am reading correctly the CAGR is 40% with DD of 16% looking at a 5 year history. For 1 year it was 60% CAGR. I wanted to put in a screen capture but have not found a way to either paste into here or attach a file.I love the unleveraged aspect of this but am leery of it choosing such a small set of stocks. Just 5 stocks plus a small amount of DIA and TLT. 47% PALL was particularly worrisome.
I would love to hear one of the LI guys thoughts on this. Or anyone smarter than me which is almost everyone.
11/11/2020 at 3:13 pm #80529ParticipantI think I was not understanding you. I switched to the Consolidate Allocation tab to see what it would say to buy for a specific cash amount. It shows 4 strategies available there which are what I set each to 25%. Now I think your final strategy was just the one that says Permanent Portfolio (US Market Stock Prec Metals vers)?
If so still 30% just to PALL but better than 47%. Huge difference though if tell it to allocate based on NOV 2020 end of period close (whatever that means) and Actual Allocation Nov 10 2020 (based on intraday price). Since I am doing this on Nov 11 I am not sure what Nov 10 intraday price means either. But the intraday price choice says to invest 60% in GLD.11/17/2020 at 4:31 pm #80589ParticipantNelson, there are two final strategies; an ETF only version called Permanent Portfolio (US Market ETF Prec Metals version) and a version that can also use individual stocks called Permanent Portfolio (US Market Stock Prec Metals version).
In consolidated allocations you should just select 100% of one of these (and NOT their sub strategies). Remember, as the name indicates this is a modification of the Logical Invest Permanent Portfolio which only allocates into SPY, GLD and TLT and can have a maximum of 60% allocated to one of these. If you feel that this is too small a set of ETFs or stocks to allocate into then you should only allocate a portion of your funds to this strategy and the rest to another strategy.
Most of the LI strategies invest in 1-5 stocks or ETFs, so spreading your funds across multiple strategies will limit your exposure to any one ETF.
Allocate based on NOV 2020 end of period close uses the data for the end of OCT 2020 to generate the signals for November. Note that for the allocations it uses the latest price in the system (based on your last reload) to calculate the number of shares.
Allocation Nov 2020 based on intraday price will uses the most current data (you will see the system download intraday prices when you select this option) to calculate the allocations and sometimes this can be very different to the end of period allocations.
Hope this helps.
11/18/2020 at 1:08 pm #80609ParticipantAny thoughts on why such a very different set of ETFs and Stocks chosen depending on whether I choose allocation based on end of period close vs intraday close?
11/22/2020 at 10:21 am #80640ParticipantI am not entirely sure of the answer to that. I think that is a good question for the LI team. It is down to how quanttrader does the allocations. It is based on the ranking log that you can view from the strategy screen, but not sure exactly how the allocations are calculated from there. I suspect that if there is a lot of volatility during the month then the rankings can completely change, but there maybe other factors that I am unaware of.
I would always try to do the end of period allocations as all the performance calculations and the graphs in quanttrader are based on this.
11/22/2020 at 12:37 pm #80641Patrick @ Logical-Invest
Keymaster“Invested Allocations (based on end of period close)” are the allocations at the beginning of the current period, which is typically the first day of the month.
“Actual Allocations (based on intraday price)” or “(based on last close)” are new allocations using the current date as the end of the period. For example, if it is November 10th and the strategy uses a 30 day lookback it will do the rankings based on the period from Oct 12 to Nov 10, whereas the Invested Allocations were based on Oct 1 to Oct 31 rankings.
It typically makes little difference if you rebalance a day or two after the Invested Allocation date, but if you missed that date and want to rebalance on the 8th or 14th, it may be better to use the current Actual Allocations. You may also want to get a head start and rebalance on the 31st of the month before everyone else.
01/04/2021 at 9:33 pm #81042CoryCasanave
ParticipantWow!
I tried the stock/metals portfolio at 20, 10, 5, and 1 yearThis is the result of CAGR, Volatility, and maxDD for each of the years:
Perminant Modified (US Market/ETF Prec Metals)
20: 14.5, 14.6, 26
10: 18.454, 13.5, 21.75
5: 32.6, 15, 15.44
1: 50.348, 23, 15.44
This is amazing!I then added some “Volatility Limit” and it improves some of the results, here is the results for a limit of 12:
Permanent Modified (US Market/ETF Prec Metals) vol limit 12
20: 16,11.7,19.56
10: 20, 11.55, 12
5: 29, 11,8,10
1: 28, 14, 10And here is vol limit of 15 – better for all but current year with dramatically low drawdown!
Permanent Modified (US Market/ETF Prec Metals) vol limit 15
20: 19,13.7, 23.29
10: 23.8, 13, 12.9
5: 35.5, 14, 12.5
1: 34.3, 17, 12.5Thanks for this!
01/07/2021 at 10:37 am #81053ParticipantThanks for your feedback, Cory.
I have never used the volatility parameter in QT, but based on your results it is something that I will definitely start experimenting with as your results are very impressive.01/08/2021 at 12:26 pm #81059ParticipantNot doing great the first month I actually tried the strategy. But that is my superpower, and no fault of the strategy.
01/11/2021 at 5:50 am #81069Frank1 Grossmann
KeymasterThe problem of the MPP precious metal strategy is that it only works with 3 metals and two of them Gold and Silver have a very high correlation. In fact, Silver is a sort of 2-3x leveraged Gold with a much higher volatility. It is always difficult to combine assets with a very different volatility in a strategy.
I tried myself to build commodity strategies with many more ETFs adding for example copper, platinum, palladium, zinc, lead, nickel and also strategies with wheat, soya, lifestock …. but I was not able to achieve much better results as most commodities are quite correlated. It is probably better to build a strategy with baskets like precious metals, industry metals, grain (corn, wheat, soya ..) as the single components can show huge spikes which are of a big risk to any strategy. A problem is also that some of these ETFs have a very short history which makes the backtest results quite unreliable. There is quite some additional research necessary to find a stable more or less working strategy. - AuthorPosts
- You must be logged in to reply to this topic.