- The Leveraged Universal Investment Strategy returns +13.3% for the month
- Free Enhanced Permanent Portfolio and BUG strategies return 3% and 2%
Thank you FED (again)
On March 20th the Federal Reserve announced that it will leave its benchmark rate unchanged at 2.25% to 2.50%, also indicating that no rate hikes would be likely this year. This is a substantial change in stance from December, when the Fed projected that as many as two rate hikes could be possible in 2019.
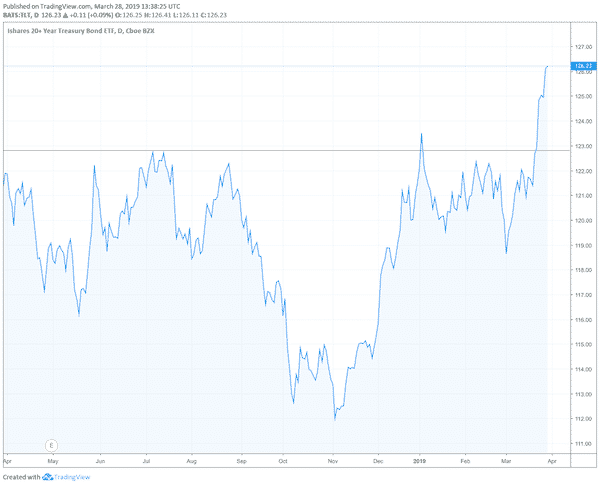
This is connected to the Fed taking a more cautious look at the U.S. economy as it lowers its 2019 growth expectation from 2.3% to 2.1%. Some analysts predict stable rates all the way out to 2020 and some go even further to suggest the Fed may cut rates again if needed. Whether it does or not is irrelevant. What is important is that the Fed is giving a clear indication it will adjust policy if markets are threatened. This is a positive development overall but especially for bond investors as it implies that bonds prices are less likely to be affected by rate changes. In our March newsletter we mention: “Another interesting trend to watch is the performance of bonds. They have been out of favor… “. Looking at the 30-year Treasury ETF, we see that this is being priced in already with TLT gaining 5% in March.

The yield curve has reversed!
The over-hyped and much feared ‘reversal of the curve’ has materialised. It is official: Buying a 1-month treasury Bill will yield more (2.45%) than a 10-Year Treasury (2.39%).
| Date | 1 mo | 3 mo | 6 mo | 1 yr | 2 yr | 3 yr | 5 yr | 7 yr | 10 yr | 20 yr | 30 yr |
|---|---|---|---|---|---|---|---|---|---|---|---|
| 03/27/19 | 2.45 | 2.44 | 2.46 | 2.40 | 2.22 | 2.16 | 2.18 | 2.28 | 2.39 | 2.63 | 2.83 |
source: www.treasury.gov

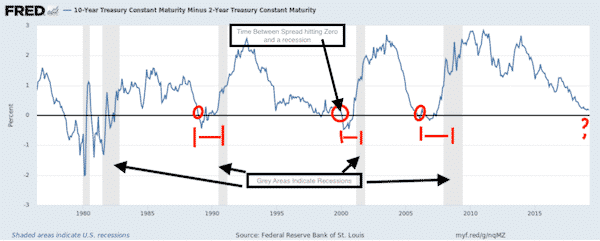
As we have mentioned in the past, history shows that inverted yield curves are often followed by recessions. Timing is up for debate, since a recession can take an average of 12 months to materialise. In the chart you can see the historic spread of the 10-Year minus the 2-Year Treasury yield. The vertical grey areas indicate U.S. recessions. You can see that the time it takes from the spread turning negative to a recession varies.
The best strategies for the month were the Leveraged Universal Investment Strategy with +13.3% and the Maximum Investment Strategy with +5%. Our free Enhanced Permanent Portfolio and BUG strategies returned 3% and 2% respectively, for the month.
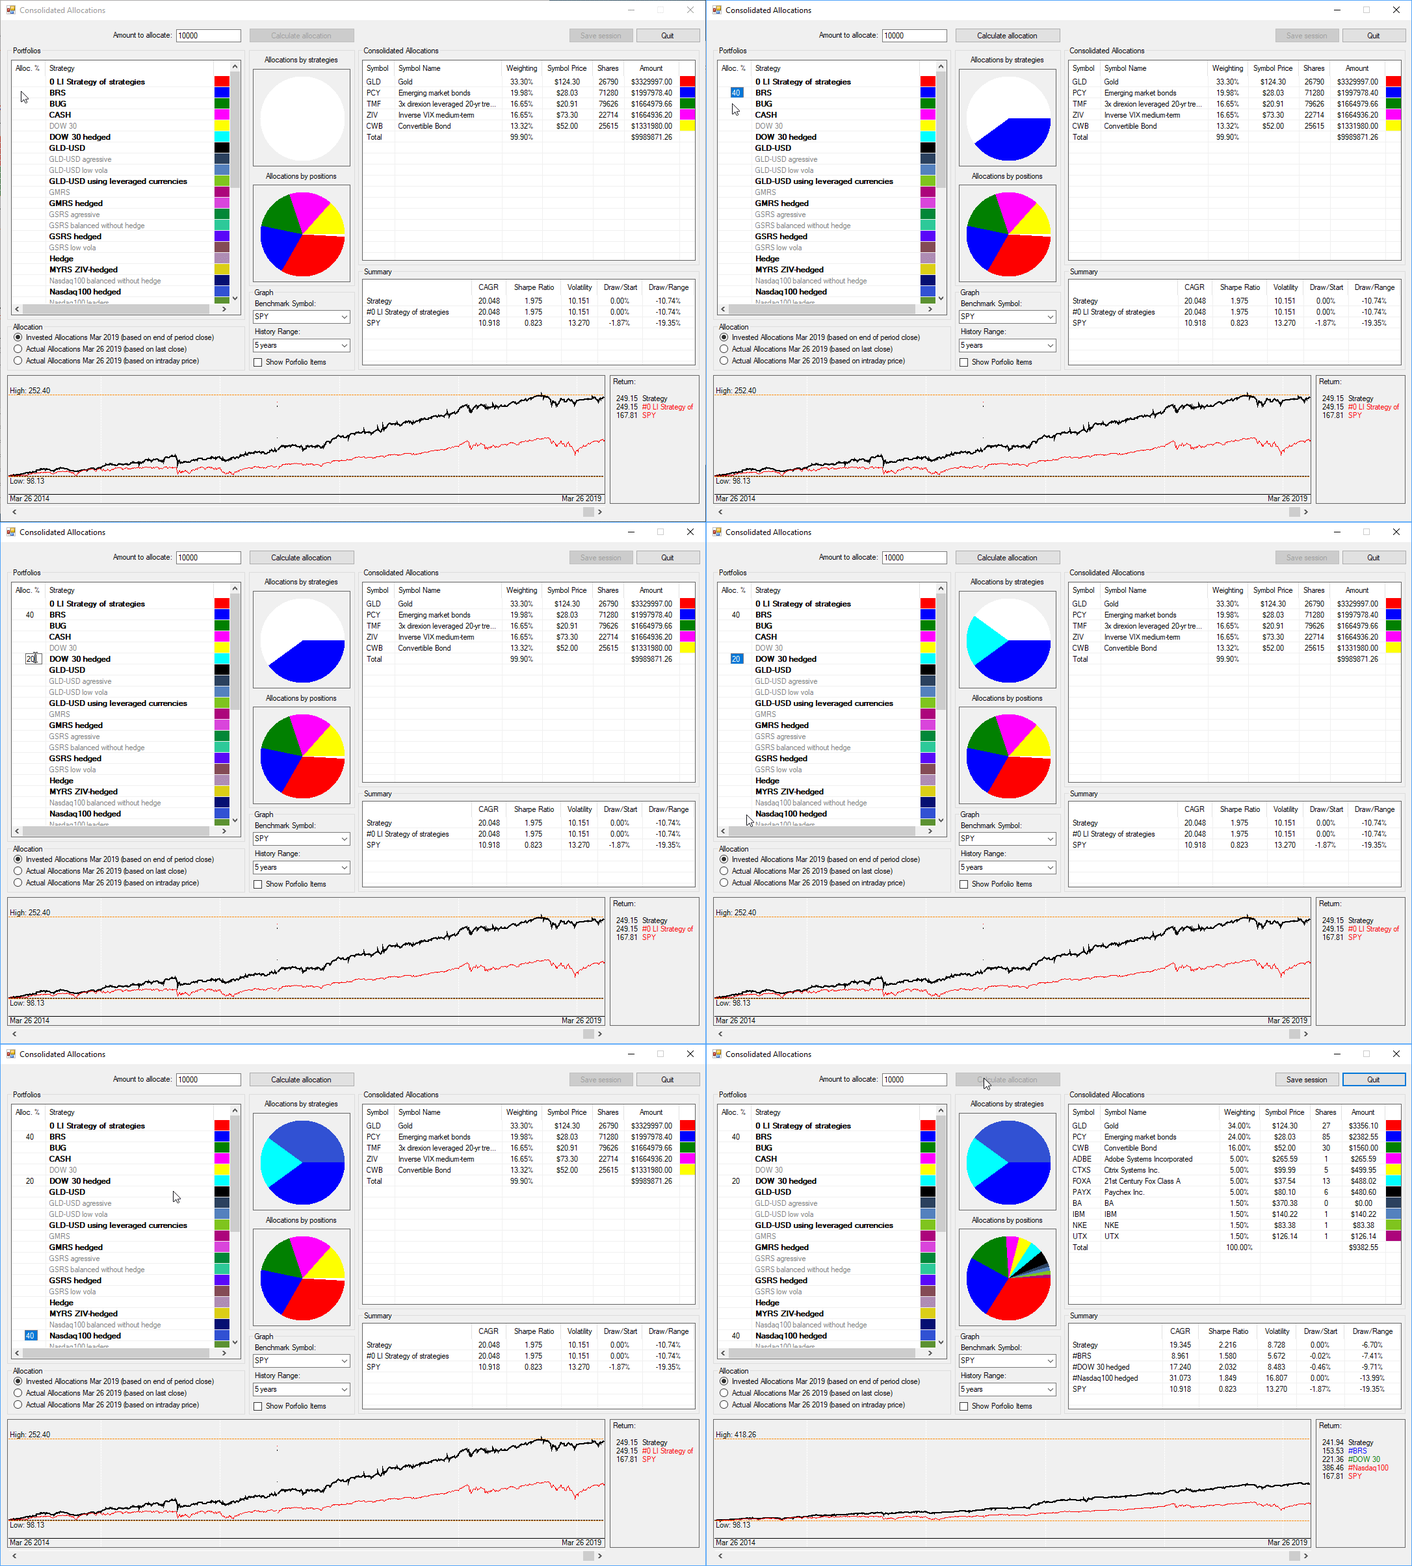
A note for our new members who might not be fully aware of it: As an All Strategies subscriber you can also use our QuantTrader software to generate the signals whenever you prefer, even using intraday data.
See QuantTrader in action and download it now! Or test it, free one-month trial!

We wish you a happy new year and a prosperous 2019, and look forward to a vivid discussion. Visit our site for daily updated dashboard.