This is the monthly monthly Logical-Invest newsletter for June 2015. From now on this newsletter will replace the individual comments for the single strategies. The newsletter includes a strategy performance overview which can help you to switch between strategies. The same table is available if you login to your logical invest account at “My Account” and select the strategy performance menu.
The table on the website is a dynamic table and will be updated every day. This way you can easily compare the performance of the different strategies. There are times when a subset of strategies may lag, like this is the case at the moment for all strategies which invest in bonds. Using the dynamic table you can click on the column headers and sort the table by any of the columns. If you sort for example by 3 month Sharpe, then you see which strategy performs best in the current rising rates sideways market environment. If you sort by 12 or 36 month Sharpe, then you see which strategy performs best over a period which includes also some market corrections. The table also includes the most important benchmarks SPY, TLT and AGG.
Here is now a static copy of the table sorted by year to date performance.
Strategy performance overview:
| symbol | close | year to date % ▴ | 3 month % | 1 month % | 1 day % | 60 day volatility | 60 day correlation | 3 month Sharpe | 12 month Sharpe | 36 month Sharpe | LastModified: 5/29/2015 |
|---|---|---|---|---|---|---|---|---|---|---|---|
| UIS-SPXL-TMF | 6151.80 | 11.42 | -2.39 | 1.15 | -1.50 | 26.65 | 0.79 | -0.48 | 3.40 | 3.22 | |
| MYRS | 626.86 | 7.04 | 2.37 | 3.55 | -0.03 | 16.39 | 0.62 | 0.91 | 2.21 | 3.04 | |
| WORLD-TOP4 | 283.91 | 6.53 | -1.07 | -1.40 | -0.83 | 13.76 | 0.67 | -0.44 | 3.13 | 3.21 | |
| GMRS | 4408.85 | 5.63 | -0.26 | 1.13 | -0.58 | 10.24 | 0.75 | -0.15 | 0.47 | 1.59 | |
| GSRLV | 499.13 | 4.56 | -1.38 | 0.10 | -0.54 | 9.78 | 0.64 | -0.77 | 2.35 | 2.33 | |
| UIS | 476.65 | 3.90 | -0.30 | 0.51 | -0.46 | 9.02 | 0.78 | -0.19 | 3.08 | 2.99 | |
| SPY | 211.14 | 3.18 | 0.33 | 1.29 | -0.62 | 10.60 | 1.00 | 0.17 | 1.61 | 2.48 | |
| BRS | 254.00 | 2.36 | 0.43 | 0.66 | -0.02 | 8.15 | 0.50 | 0.32 | 1.48 | 2.79 | |
| BUGLEV | 285.72 | 1.06 | -0.14 | -0.42 | -0.05 | 10.83 | 0.60 | -0.07 | 1.09 | 2.43 | |
| BUGST | 219.62 | 0.60 | -0.69 | -0.79 | 0.00 | 7.32 | 0.69 | -0.52 | 1.46 | 2.73 | |
| AGG | 110.17 | 0.56 | -0.57 | -0.62 | 0.04 | 4.10 | 0.22 | -0.81 | 1.21 | 1.04 | |
| GMRSE | 6106.16 | -0.04 | -4.25 | -2.91 | 0.16 | 12.09 | 0.51 | -1.84 | 0.49 | 2.46 | |
| GSRAG | 512.31 | -1.04 | -3.89 | -2.41 | -0.43 | 13.59 | 0.81 | -1.45 | 0.44 | 1.84 | |
| TLT | 122.71 | -1.96 | -4.08 | -2.57 | 0.22 | 16.10 | 0.00 | -1.34 | 1.06 | 0.28 |
Symbols:
BRS – Bond Rotation Strategy
BUGST – A conservative Permanent Portfolio Strategy
BUGLEV – A leveraged Permanent Portfolio Strategy
GMRS – Global Market Rotation Strategy
GMRSE – Global Market Rotation Strategy Enhanced
WORLD-TOP4 – The Top 4 World Country Strategy
UIS – Universal Investment Strategy
UIS-SPXL-TMF – 3x leveraged Universal Investment Strategy
AGG – iShares Core Total US Bond (4-5yr)
SPY – SPDR S&P 500 Index
TLT – iShares Barclays Long-Term Trsry (15-18yr)
Market comment:
Since beginning of the year the stock markets are going sideways. Treasuries had quite a strong correction and it seems that now the first rate increase is more or less priced in. Anyway rates will be increased very slowly over many years. I do not think that this correction continues like last month. Treasuries will probably go rather sideways for some time, but they will still be the safe haven asset to go when there is a bigger market correction.
Strategies which are heavily invested in bonds, like the BRS, and the two BUG strategies will probably rather underperform in the near future. Strategies which are more aggressive and momentum driven like GMRSE and GSRSAG also normally don’t do so well during volatile sideways markets like we have them since beginning of the year. If you want to outperform broad indexes during sideways markets, then you need to invest in selected sectors which still perform well, or another way to perform well is to invest in selected well performing countries. For this we have developed a new strategy the Top 4 World countries strategy.
This new strategy was added as a response to raising rates and an under-performing US stock market. The strategy is the Top 4 World countries strategy and you can read about it in the latest blog: The World Country Top 4 ETF strategy – A way to fight rising rates and a stalling US stock market
The MYRS strategy also still does reasonably well because even if the US market goes sideways, inverse volatility (ZIV) still collects about 2% roll yield per month. However, you have to be careful with this strategy. Because of the bad performance of Treasuries, this strategy is not well hedged at the moment. If there is a bigger market correction, then the 7% YTD may quickly be erased.
Strategy Signals for the Website
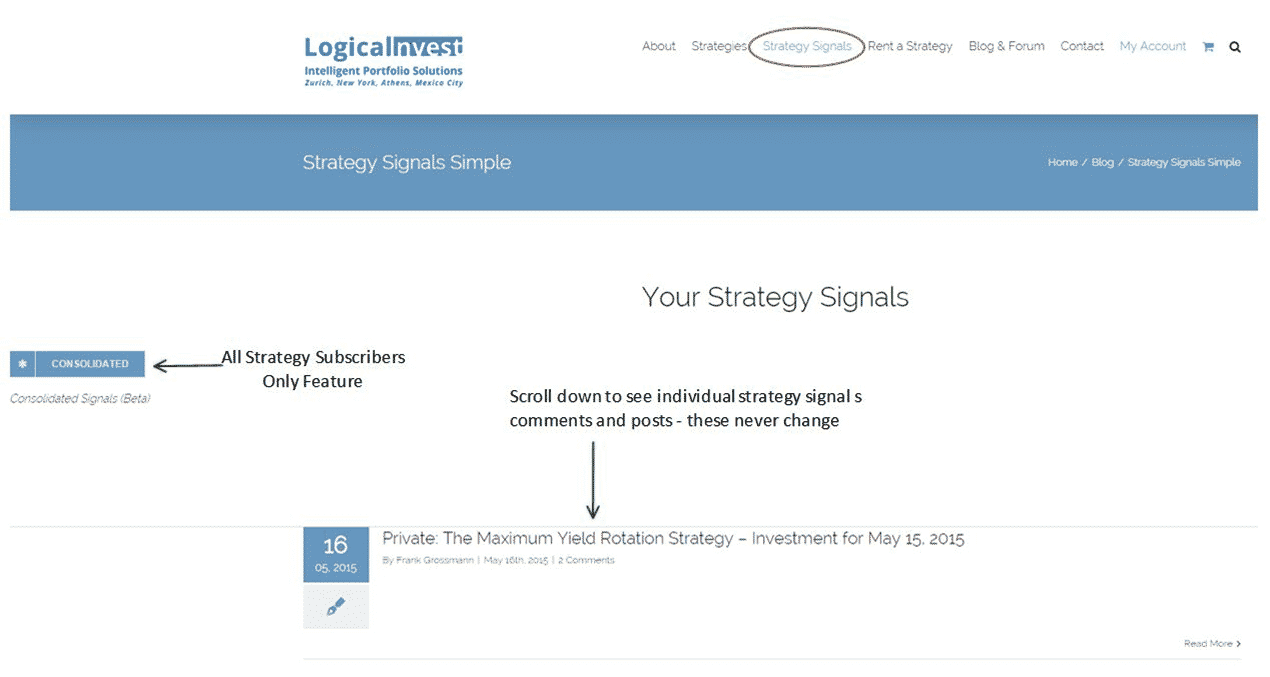
We have reorganized the delivery of signals on the website with the goal of making them easier to find for new subscribers, and streamlining website response. We provide multiple ways to view and organize the information, based on preferences and to accommodate different medium.
If you click on Strategy Signal on the main menu, also this link:
 [/fusion_imageframe]
Each individual subscription strategy update is available, current and history. Additionally, by clicking on the blue button you can access the beta version of our signal consolidation spreadsheet if you have an all strategy subscription. This generally does not work on a Mac. We are targeting having a more refined version of this consolidation spreadsheet.
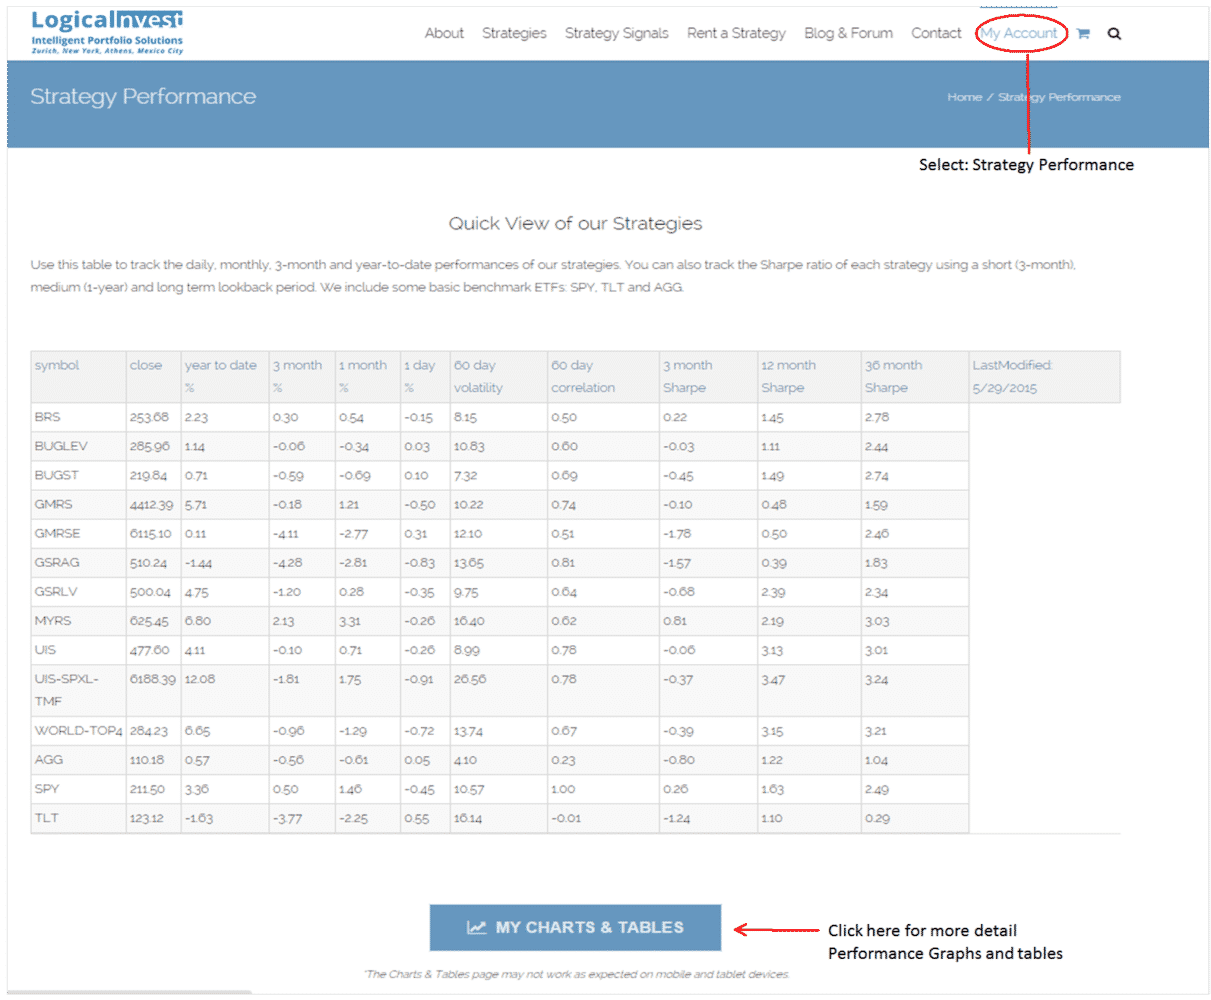
Under My Account menu, by selecting Strategy Performance you will see a one page view of all of our strategies, and their returns, Sharpe, volatility and correlation with S&P 500 in various time-frames, as discussed earlier.
 [/fusion_imageframe]
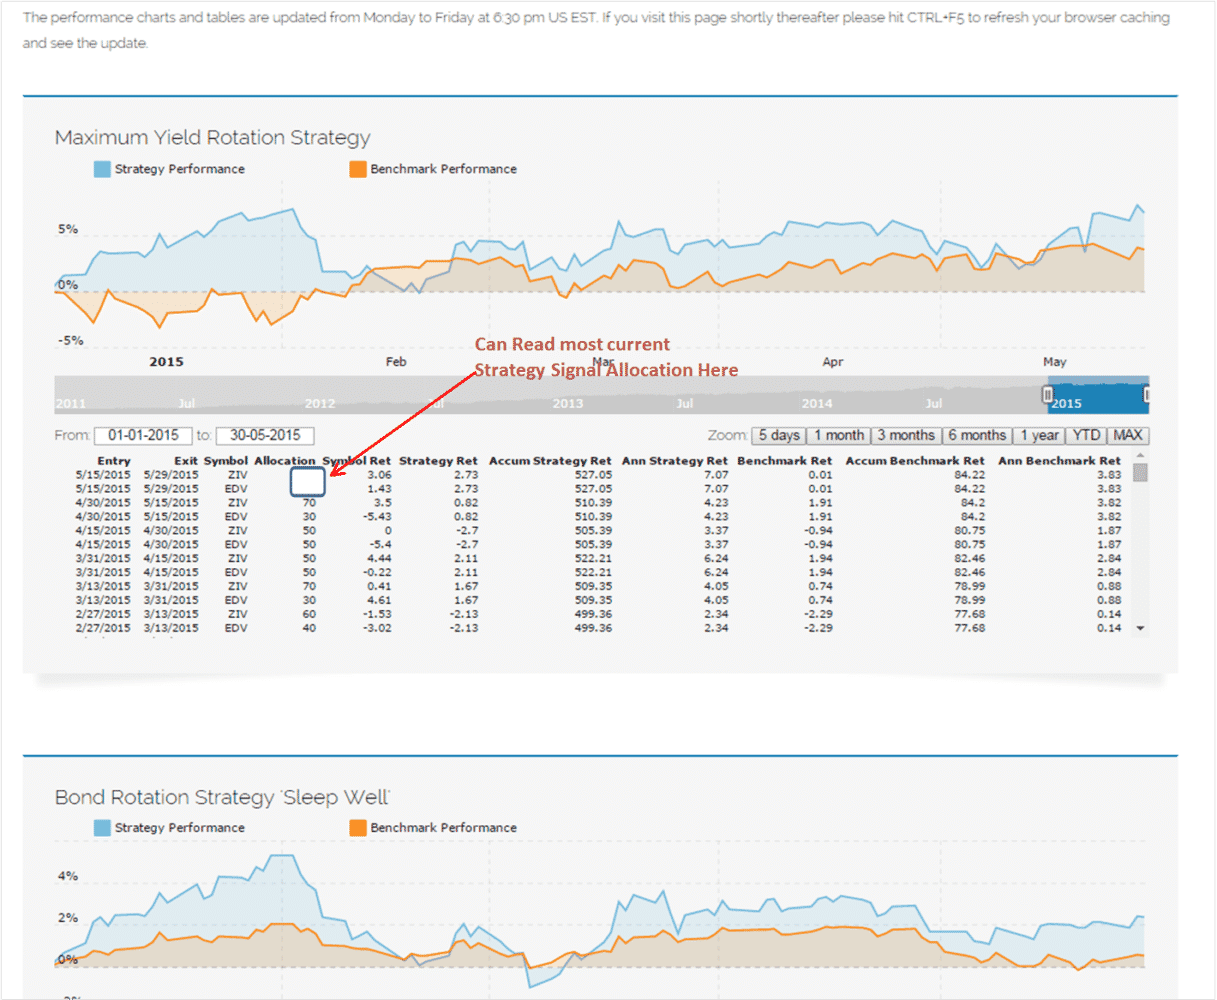
At the bottom of this page you can further click on “My Charts & Tables”. This brings up the graphs by strategy, along with the most recent symbol & allocation for each strategy at the top of the table below the graph. It always shows an exit date for the most recent trading day, as this calculates returns through that date. [/fusion_imageframe]
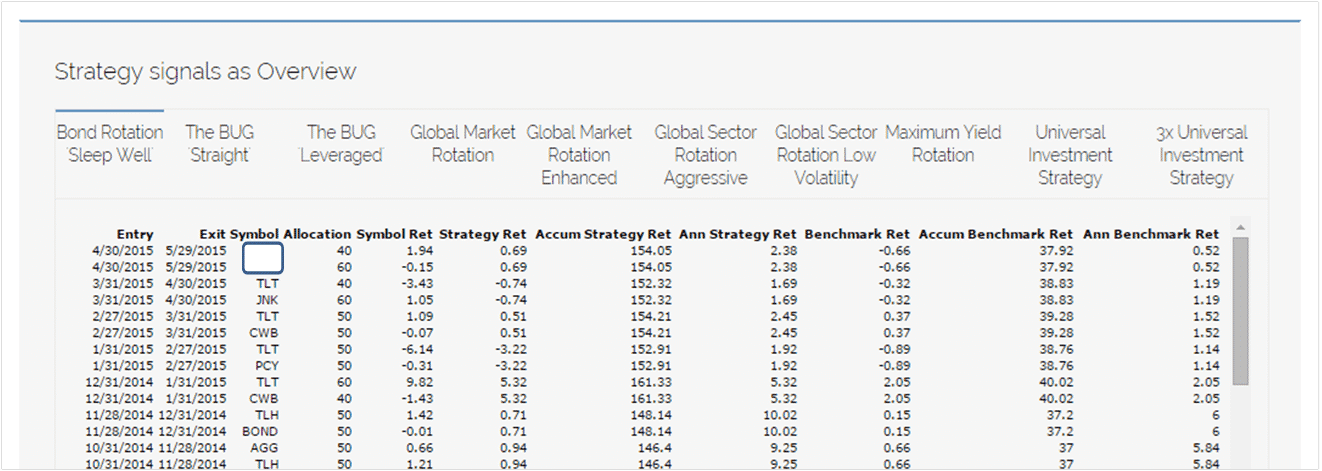
If you scroll down through the graphs to the bottom, you will see a tabbed table of latest signals by strategy. Please note, while this format generally works well on a PC, it does not always work well on a mobile device/Mac.

Please let us know any questions and how we can help.
Best Regards,
Logical-Invest