Logical Invest
Investment Outlook
July 2017
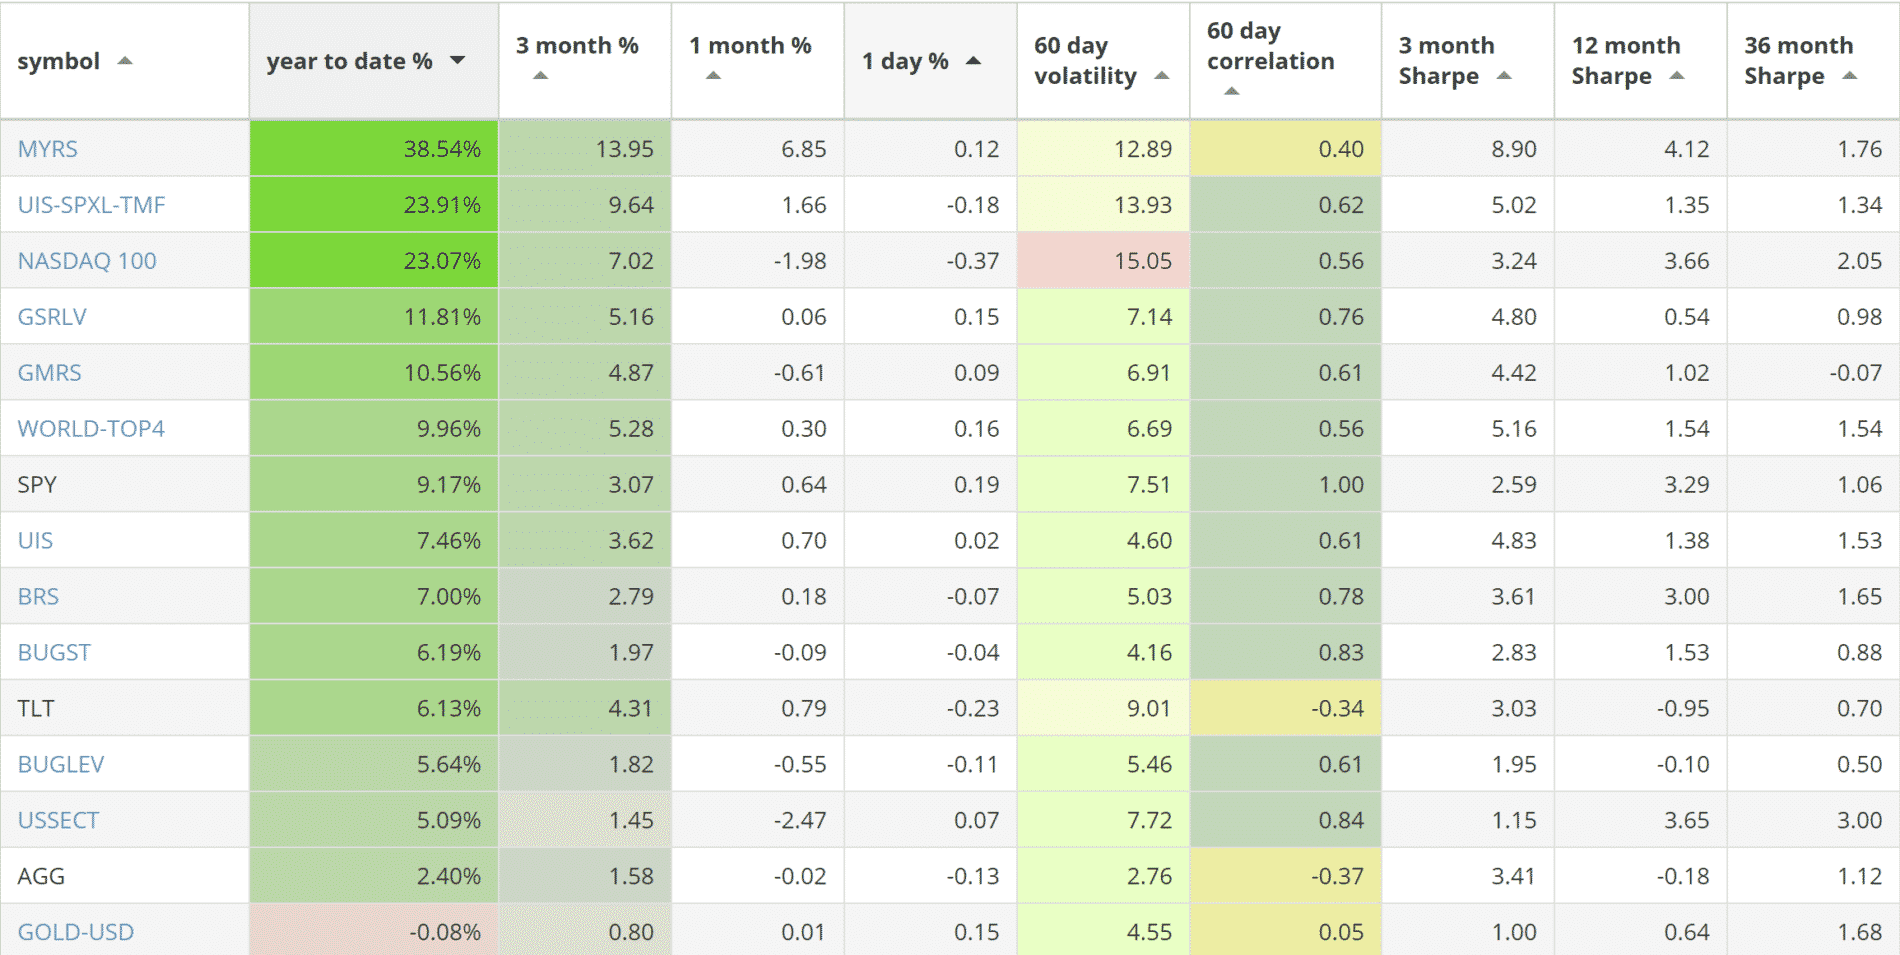
Our top 2017 investment strategies, year-to-date:
- The Maximum Yield strategy with 38.54% return.
- The Leveraged Universal strategy with 23.91% return.
- The NASDAQ 100 strategy with 23.07% return.
SPY, the S&P500 ETF, returned 9.17%.
News:
Our professional portfolio software QuantTrader continues to evolve and can now download data from 3 different providers: Tiingo, Yahoo and Google. Tiingo is an inexpensive solution for DYI investors that need good quality dividend-adjusted end of day data.
Market comment:
The U.S. Federal Reserve raised its benchmark federal-funds rate on June 15th by a quarter percentage point and hinted to further hikes. Individual investors remain skeptical of the bull market as the AAII survey shows 43.4% being neutral (historical average is at 38%). Mainstream market analysts keep a positive outlook quoting decreased risks and equity strength in Europe, global strength in developed and emerging markets, low unemployment in the U.S. and a sense that the Fed’s tightening is predictable.
We continue to see a low volatility environment and a weakness in U.S. dollar for 2017 which benefits non-U.S. stocks, bonds as well as gold. The European market returned 17% YTD while India and China achieved 20%+ returns for the year.

Out top strategy, the Maximum Yield strategy, added another +6.85% to reach +38.5% return for the year. The Universal Investment 3x strategy had a correction in the last few days of July but came out positive adding +1.66% for a +23.9% YTD return. Both the Nasdaq 100 and the U.S. Sector strategies had corrections: -1.98% and -2.47% to achieve +23% and +5% YTD respectively. All other strategies remained flat with gains/losses below 1%.
A final note: We do keep a watchful eye on recent developments in the crypto-currency markets as Bitcoin and Ethereum are attempting to make their way into the mainstream. It may be worth watching the roller-coaster ride and how this ‘new’ market behaves as new people are drawn into unstoppable up-trends and initial coin offerings (ICO’s) only to get “shaken out” by deep and sudden drawdowns. A promising but difficult market and a good example why one needs a system of rules to adhere to.
We wish you a healthy and prosperous 2017.
Logical Invest, July 1, 2017

Strategy performance overview:
Visit our site for daily updated performance tables.
Symbols:
BRS – Bond Rotation Strategy
BUGST – A conservative Permanent Portfolio Strategy
BUGLEV – A leveraged Permanent Portfolio Strategy
GMRS – Global Market Rotation Strategy
GMRSE – Global Market Rotation Strategy Enhanced
GSRLV – Global Sector Rotation low volatility
NASDAQ100 – Nasdaq 100 strategy
WORLD-TOP4 – The Top 4 World Country Strategy
UIS – Universal Investment Strategy
UIS-SPXL-TMF – 3x leveraged Universal Investment Strategy
AGG – iShares Core Total US Bond (4-5yr)
SPY – SPDR S&P 500 Index
TLT – iShares Barclays Long-Term Trsry (15-18yr)
Cryptocurrency markets are wild (I’m active on those markets since 2011, so I’ve been thru a lot). But that said, I found it quite adhering to support zones, fibonacci’s and the likes. The trends tend to be strong and long lasting, so momentum investing may be a good choice here. I’d love to hear more about your research in these area.
Our interest is to:
a. See if Bitcoin can further diversify existing portfolios as it may be one of those ‘rare’ uncorrelated assets with a positive bias.
b. Try the LI methodology on a monthly rebalanced basket of coins to create a wider “crypto-index” for longer term investors.
The market is definitely wild and missing some key ingredients like safety of funds, brokerage insurance, broad investable indices, etc. By the way, I also noticed that Bitcoin does hit Fibonnacci and res/support lines.
If you are trading since 2011, you must have some interesting insights… :)
I think b) would be very interesting, and momentum based investment technique would do well.
On metrics and creating a crypto index, I think the methodology https://cyber.fund is using is quite interesting. It is an attempt to come up with a sharpe ratio for crypto assets performance, and shows some resemblance to the LI approach.
What’s lacking though is a hedging instrument that exhibits negative correlation to the cryptocurrency assets in a market downturn- There is no TLT/TMF for SPY equivalent for Bitcoin or other cryptocurrencies. Hence any momentum based strategies will also have to have a decent portion in cash which buffers volatility but drags return on the normal days.
Would be interested to chat further and be posted on what you guys are doing in the space and help where I can.
Keep up with the good work.
Regards,
Howard
Hello Howard,
Thanks for sharing the info. What you said about the lack of a hedge is very true. It would be an interesting exercise on how one could create a coin negatively correlated to bitcoin that also pays some type of interest so that it keeps a positive long term bias (like IEF or TLT do).
1 month Performance reported for MYRS in the newsletter is 6.85%. Performance for MYRS in the Strategy Performance link is 3.27%. Can you explain the difference or is there an error?
You are looking at 3.27% performance from 5/31 to 5/15 (mid-month) not the whole month.