First of January 2018 after a fabulous year in the markets and hopefully also your account. What better time than to spend some hours on revisiting our portfolio allocation to be ready for whatever the new year will bring? As stated previously we update and re-optimize our fixed-weight portfolios in the Portfolio Builder about twice a year.
To recap, why do we re-optimize portfolios periodically?
Modern Portfolio Theory by Harry Markowitz uses past returns and covariances to construct portfolios which optimize the expected return and variance. While fundamental MPT aficionados would advise to stick to your allocation for several years, at Logical Invest we advocate for a more flexible approach with regular reviews which in our view ensure your portfolio allocation considers also recent market developments.
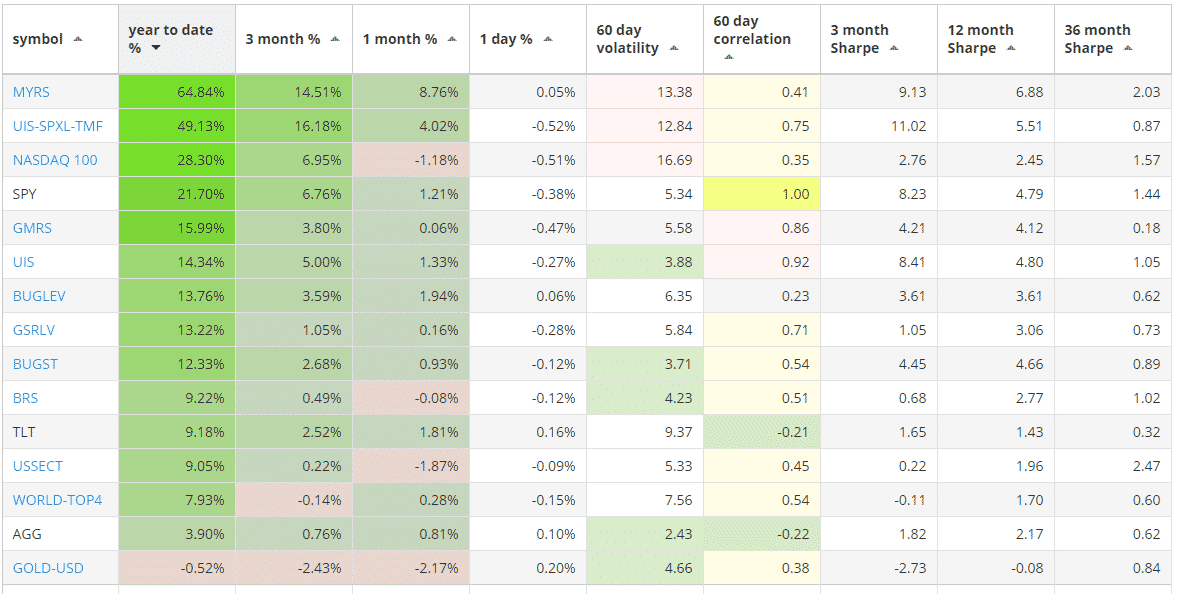
2017 has been marked by steadily increasing equities while subdued volatility is taking historical levels. SPY, our proxy for the S&P 500 has returned 21.7% while TLT, proxy for the 20+ year bond market has returned 9.2% . The “fear index” VIX, representing S&P 500 volatility, has seen readings in the lower tens most of the year, a historical low of 8.84 and only four spikes above 15, which is the 10 years average.
How have our individual strategies performed so far? The strong run in equities coupled with low volatility has provided clear medium-term trends and therefore runs to our high-performing strategies. For example, the Maximum Yield strategy returned close to 65%, this thanks to being in average two thirds invested into ZIV, which alone represents around 48.0% of this return.
How has this translated into our Markowitz optimized Portfolios?
2017 has been a mixed picture for the pre-configured portfolios. As some strategies like the Maximum Yield and 3x Universal Investment performed well at or above the historical levels, others performed below expectations or historical levels. At the same time the subdued volatility in the markets led to some portfolios having drastically less than expected volatility, or in other terms due to the fixed allocations being “overly cautious” and not fully participating in the strong equity trends. For example, the Portfolio optimized for a maximum return with historical volatility level of less then 15% only experienced an overall 9.8% volatility.

As a result, all portfolios greatly exceeded the expected sharpe ratio levels, but what many readers may perceive at the cost of not fully living to expectations in returns. Well, that’s rather normal for a long-term optimization based on the historical risk/return profile. In extremely bullish markets the performance of the portfolio stays slightly behind the market, but this pays out once markets turn and the diversification effect kicks in.
What’s new in 2018? What are the new allocations of the portfolios?
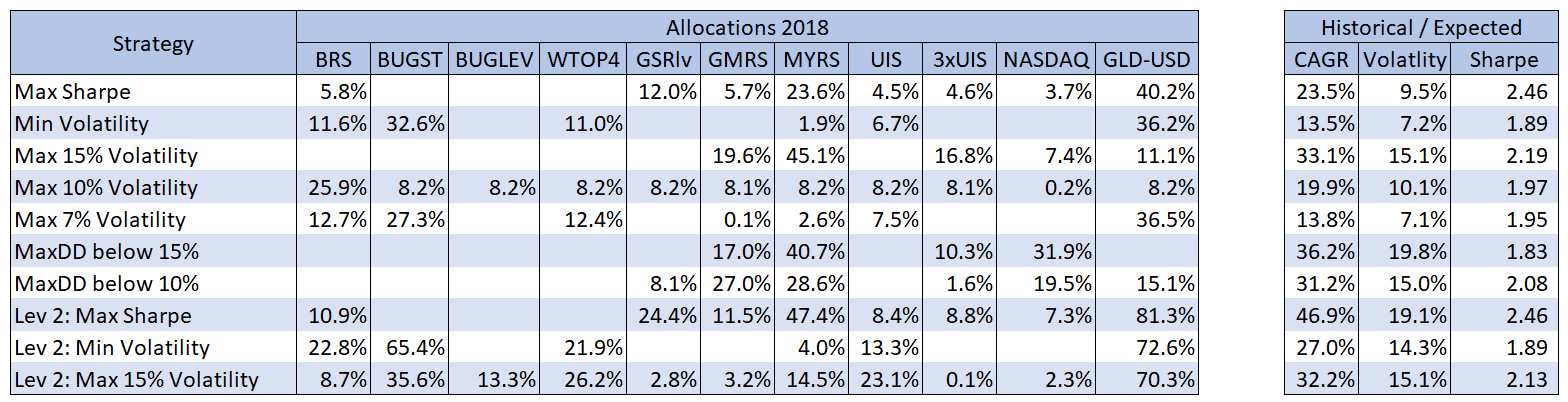
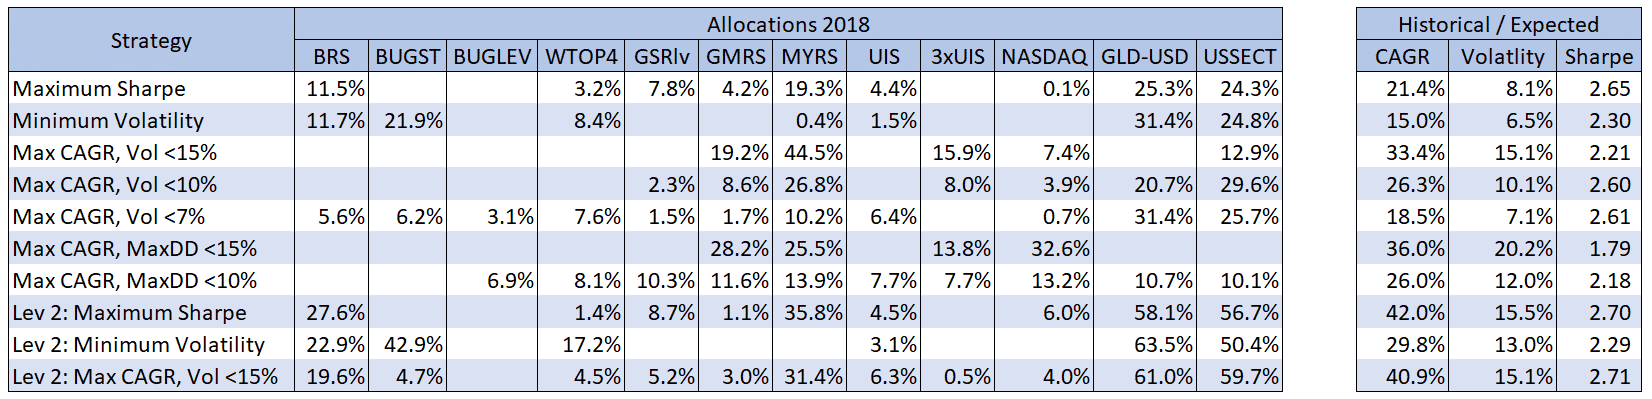
For the new optimization including the daily performance of 2017 I offer two pictures. The first option is only including the strategies which had been considered in the current optimization, that is, excluding the US Sector Strategy, while the second option includes also this strategy, so now allocates across all 11 strategies.
My thinking hereby is twofold: First I want to allow subscribers to remain with the prior set of strategies, as they might have become used to them, and secondly as many long time subscribers in the meantime might have developed their custom portfolios, so use the new allocations rather to review their own portfolios.
Ultimately, I will use the full optimization including the US Sector Strategy in the online and offline tools, but for January will not yet include the US Sector Strategy so you have the opportunity to see the differences and decide which way to follow. In case you decide to include the US Sector Strategy, this time just use a custom portfolio and input the percentages.
1) Allocations 2018 – without US Sector Strategy – As updated in Online Tool
2) Allocations 2018 – with US Sector Strategy – Update February in Online Tool
Compared with the past allocation it is easily visible how after a great year with low volatility some more weight is given to high performing strategies, while some our “classics” like the Global Market Rotation Strategy get less allocation. Hedges go more towards the Gold-USD strategy than the Bond Rotation Strategy, but the defensive part of the allocation remains overall about even.
Impressive is to see how strong the shift in allocations is once including the US Sector into the equation. We’ll do a more detailed review and post of how nicely the US Sector Strategy fits into a balanced portfolio with other strategies – as heads-up and easily visible in the table above, the high allocations to the US Sector Strategy result from the extremely low correlation to most other strategies, thus serving both as very nice performance boost in good times as well as a great hedge when things go south, the latter thanks to the short component it includes.
So especially the subscribers to the free-forever US Sector Strategy should stay tuned and start trying out some of the amazing portfolios outlined you can achieve upgrading to an “All Strategy” subscription. And yes, that’s a humble marketing pitch – but in the best interest of your account size, smiley.
You can also download the updated Excel Portfolio optimizer to further research and optimize to your need. The files includes both versions, optimized with and without the US Sector Strategy.
Further outlook 2018
As now all our “All Strategy” subscribers have access to QuantTrader and its signal consolidation functionality we plan to gradually start putting more emphasis on QuantTrader, and ultimately skip the online and Excel tool – at least if there is no big outcry from the community and we cannot satisfy the requirement of the big majority.
Two more things are in the cooking for the next days:
First a detailed article with video on how to effectively and efficiently use the consolidation functionality in QuantTrader and by request of several subscribers, how to use the Portfolio Rebalance tool of Interactive Brokers to rebalance in less than 15 minutes.
Secondly we will come up with a new QuantTrader version which will already include all above mentioned portfolios, so you can easily backtest and cut signals whenever you like – even intraday so to trade shortly before close.
Let’s start this year with a great discussion in the comment section, count on you!
All the best,
Alex
Me interesa especialmente conocer la Herramienta de Reequilibrio de Cartera de Interactive Brokers.
Espero que la explicacion sea en texto asi puedo usar el Google Translate para traducirlo al español y si es en video en Settings deberian poder configurarse subtitulos como en cualquier video de Youtube.
Muchas gracias y saludos,
Jorge
Hola Jorge, el articulo va a ser en ingles, pero con gusto tambien podemos hacer una sesion en Skype y te explico como utilizo la herramiento. Saludos de tierra santa mejica, Alex
I am looking forward to the video showing rebalancing at Interactive Brokers.
I’d like to learn to take best advantage of Interactive Brokers as well.
IB Portfolio Rebalance Tool has an option of importing CSV file with allocations. It would be awesome if QT could export such a file.
+1
Hello Alex,
from – Further outlook 2018, above:
“… ultimately skip the online and Excel tool (i.e., Portfolio Builder) …”
I’ve found Portfolio Builder (PB) to quite helpful in developing several “strategies of strategies” but also recognize the limitations inherent in its approach – primarily fixed allocations, and lengthy look back periods.
But there’s a particular strength -The LI Portfolio Builder enables the user to develop a “strategy of strategies” that explicitly attempts to match portfolio performance with the user’s risk / reward objectives. This theme is very appealing.
I think that if some capability to optimize the portfolio explicitly on a risk / reward basis finds its way into QT, with all QT’s other benefits, then I think skipping PB would do no harm.
Happy New Year, Alex,
I really enjoy the service and especially the online builder, but I look forward to this.
However, when testing new ports, I find the Quant Trader Optimizer seems to be too conservative by going high Sharpe. For example, if I add SHY as an additional choice, it tends to push towards that.
Please help me understand how to force QT to replicate the options that exist with the online builder, e.g. to go for Max Sharpe, Max CAGR with x% volatility, Max CAGR with x% drawdown, etc., and then I would agree that would be a replacement for the online builder.
Thanks for the comments, R D,
try using a volatility attenuator below 1, e.g. 0.7 or even less (see last parameter in the bottom box in optimizer). If you recall the modified Sharpe formula we use is Sm = R / V ˄ f (“f” is the volatility attenuator). So the lower you go with “f” the more weight is given to return instead of volatility or risk adjusted Sharpe.
We’ve not yet build the constraint optimizations into QT, as these are quite computation intensive and not naive at a second look, so it´s better to run them off-line like I currently do. For the time being I´d recommend you either use the online version, working on replicating the portfolios in QT so you can backtest and tune – but will take some time until you´ll be able to perform realtime optimization on-the-go in QT.
Thanks, I find that works well. I like to use 1 year and 3 year time frames with QT. I like 3 year since it captures the harsh reality of 2015. And one year because it reflects the more current situation.
What is the time frame used for the online port builder?
Gentlemen, Quick question re: Quant Trader V05.08S
Under “Consolidated Allocations”/ “Allocation” ….
“Invested Allocation (based on end of period close)”
“Actual Allocation (based on last close)”
The position weights for these two choices are substantially different. For example, under “Max. Sharpe” Weights for both, CWB alone moves from 4.4% to 12.2% even though the difference between the signal dates is only 16 trading days….Given that I wish to rebalance at T-2 or T-1, which setting should I use? Thanks in advance!!! Great tool
Hi Michael,
if you normally trade around month-end, e.g. T-2 or T-1 I’d use the “Invested Allocation (based on end of period close)” for consistency reasons. Only if due to vacation or other reasons you trade mid-month I´d use the “Actual Allocation (based on last close)”.
This month we had quite some movements in bonds and related, normally the difference between both allocations is much less.