The following ETF strategy is one of my favorite rotation strategies, which many of my friends, customers and I use now for some years.
The Global Market ETF Rotation Strategy (GMR)
The GMR Strategy switches between 6 different ETF on a monthly basis. The back tested return of this strategy since 2003 is quite impressive.
- Annual performance (CAGR) = 41.4% (S&P500=8.4%)
- Total performance since 2003 = 3740% (S&P500=134%)
- 69% of trades have positive return versus 31% with negative return
You find the most recent performance table here.

These global markets and ETF are:
- US Market (MDY – S&P MidCap 400 SPDRs)
- Europe (IEV – iShares S&P Europe 350 Index Fund)
- Emerging Markets (EEM – iShares MSCI Emerging Markets)
- Latin America (ILF – iShares S&P Latin America)
- Pacific region (EPP – iShares MSCI Pacific ex-Japan)
During market corrections I invest in:
- US Treasury Bonds (EDV – Vanguard Extended Duration Treasuries (25+yr))
- Cash or SHY (SHY – Barclays Low Duration US Treasury)
Selection of the strategy ETF
For the design of a well performing rotation strategy, it is important that the selected ETF are not too volatile, show longer term visible trends and have a good market volume, so that they cannot be manipulated. They all should have more or less the same volatility. The 5 global markets ETF fulfill this condition. They all are capitalized enough, so that they cannot be manipulated in the short term.
Why rotating?
The 5 ETFs follow slightly different economic cycles and there are long periods where one market outperforms the other until it becomes so overpriced and investors begin to remove their money from that market in order to invest in other cheaper valued markets.
Looking back 12 month, we see that the US market was the clear winner and the MDY S&P Midcaps performed +35%. In comparison, the ILF Latin America market lost nearly -10% and the more important EEM Emerging Markets ETF only made +3.5%. Rest assured that this outperforming will not continue forever. At one moment EEM, ILF or another ETF will bounce back and outperform the US market. This is the moment when I switch the ETFs.
However, switching between these markets alone is not enough to really get a good performance. By switching only between this 5 ETFs I would have made 21% annual return since 2003. Not too bad, compared to the 8.4% of the SPY S&P500. But if I look at the charts, I recognize that during periods of big market corrections also all my 5 ETFs suffered big losses. Although these markets are globally distributed, the correlation between them is very high. The 60 day correlation is mostly higher than 0.75. This means there is no way to escape a market correction like the subprime crash in 2008 when the S&P500 lost nearly 55%. To avoid this scenario, we would need to switch to some negatively correlated assets. The best are US-Treasuries and if they do not work, then cash is an option as well.
Based on my strategy back tests, I have chosen the EDV – Vanguard Extended Duration Treasuries (25+yr) ETF. At the moment, due to rising yields, the correlation to the S&P500 (SPY) is nearly 0 which is quite abnormal. Normally the correlation it is between -0.5 and -0.75. However, I am sure that during a future market correction these correlations will go down very quickly.
When designing a good rotation strategy, the Return to Risk ratio (Sharpe-Ratio) is one of the most important numbers. The higher it is, the more return you will get for the risk you have within your investment.
Return to Risk ratio (Sharpe ratio)
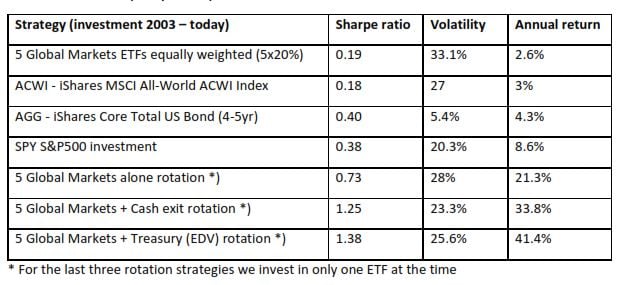
ETF Rotation compared to diversification
If we compose an equally weighted portfolio of these 5 ETFs then the back test chart since 2003 is nearly 100% identical to the ACWI ETF (iShares MSCI All-World ACWI Index). Both would have about 3% annual performance and a maximum draw down of about nearly 60%. This shows you that this strategy is really trading an all-world selection.
It shows you also that maximum diversification which we have in the equally weighted portfolio is not the way to achieve good performance. The strategy did very well in selecting the good ETFs to achieve an annual return of 41% instead the 2.6% for an equal mix of the 5 ETFs. A good rotation strategy is always better than broad diversification.
You can also see the important to escape bigger market corrections. The strategy does it by switching early to cash or Treasuries.
The automatic “crash guard” of the ETF strategy
The Treasuries plays the role of automatic “crash guard” of the rotation strategy. Think of the 5 global markets be a truck speeding down the highway. Now I am following close with my car and my car has one of these new automatic brake systems which brake automatically to avoid a crash. These braking systems measure the distance to the car in front of you. Such a control system has a gain setting which has to be fine-tuned very well. If the gain is too low, the car will not brake enough. If the gain is too high the car will begin to brake hard and accelerate which will cause oscillation.
You can tune the gain of the treasuries by selecting the duration of the treasuries. Duration acts like a leverage. If you choose a short duration Treasury it will take too long to switch and you will suffer losses at a sudden market correction. If the duration or also leverage is too high you will switch too early which results in buy high sell low.
For this strategy we tried all Treasuries from SHY, IEI TLH, TLT, EDV, and also leveraged Treasuries. EDV had the best “gain” for the “automatic brake system” for this strategy.
About Risk and Return
Many conservative and cautious investors think that they have a small risk investing in a bond ETF like the AGG. However, if you compare the Sharpe ratio, you recognize that an SPY investment has about the same risk under the condition, that you invest only half your money and keep the rest in cash. The SPY investment return would be the same, because the annual performance was exactly twice the annual AGG performance.
With the Global Market Rotation strategy, you can reduce your risk and your volatility easily by just keeping a good part of your money in cash or short term bonds.
Even if the volatility of 25.6% seems a little bit high, this does not mean that the strategy is risky. The 25.6% is the medium 20 day volatility since 2003 which is slightly higher because of the switching between the ETFs. However, it is much more important, what happens during a market correction. Here my strategy showed its strength in the past. During the S&P500 market crash in 2008, the strategy produced a solid return of 55.5% while the S&P500 was -36.8% down by the end of the year.
I consider such a strategy as quite save, because the strategy will avoid big losses during market corrections. It will always switch quite early into treasuries or into cash for the case that treasuries would not anymore play the role of a safe haven asset.
Annual performance of the Global Market Rotation Strategy

How to rotate the ETFs
I rotate or switch the ETFs on a monthly basis. Every month I calculate a ranking of the 6 ETFs and based on the results I invest in the best ETF for the next coming month. I use a software which I have written in Mathlab to find out which the best look back period (a) and the best investment period (b) is. The (b) period will give me my investment return. The software just varies the look back period (a) between 1 week to 12 months for investment periods of 2 weeks to 3 months. The software just loops through 10 years of historical price data and outputs a scatter diagram which shows which (a) and (b) periods give the best positive return. The result is a 3 dimensional mountain diagram which highlights the best periods. The investment period (b) is less critical than (a). However (b) should always be shorter then (a). One month for (b) is a good value for our 5 ETFs. The look back period (a) can make big differences. However (a) normally lies somewhere between 1 and 5 month.

My Mathlab method is very interesting to test if an ETF can be used for a rotation or a trend following strategy. You cannot use an ETF if you cannot find a look back/investment period pair which gives you a stable positive return. Also for some ETFs you get completely different returns, only by changing the (a) parameter a little bit. Such ETFs are also not good for rotation strategies.
For example, it is nearly impossible to design good rotation strategies for commodities. They are too volatile and they can be very easily be manipulated. Also, if you the look back (a) and investment periods (b) are too short, it becomes difficult to achieve positive returns. The shorter the periods are, the more your performance becomes a function of the random market noise which overlays existing trends. This is why I am not a friend of intraday trading. In addition intraday trading is really a hard work. I rather make money without being shackled to a computer screen the whole day.
For the ranking, I also use the volatility of the ETFs. While this is not so important for the 5 Global market ETFs, it is important to lower the EDV ranking a little bit according to the higher volatility of the EDV ETF. EDV has a medium 20 day volatility which is roughly 50% higher than the volatility of the 5 global market ETFs. This results in higher spikes during small market turbulences and the model would switch too early between shares (our 5 ETFs) and Treasuries.
This probably sounds now very complicated, but you can get quite good results by just looking at the 3 month historical performance and then always invest the next month in the best ETF. This is something you can do by yourself. You will still make about 34% annual return per year. The additional annual return I get for these complicated calculations, however, is +7.4% which is also not too bad.
Here is an example of the investments since September 2012

As you can see, since January the strategy is invested in MDY. It is not necessary to switch the ETF every month. I would say, that you have to switch all 2-3 month on average. In addition, instead of buying the ETF, you can buy Comex futures for some of the ETF. This is what I do. It is the case for MDY and IEV (Europe). Instead of the EDV you can buy Ultra-TBonds which are similar to the TLT ETF, but you have to buy about 1.5x your normal investment because EDV behaves like a 1.5x leveraged Ultra-TBond.
My concern is that major portfolio managers have discovered this rotation strategy & this will cause the strategy to underperform the market. I believe this is what happened to the dogs of the Dow strategy. Do you think that these markets are too large to be influenced by portfolio managers using a rotational relative strength strategy?
I do not think that this would ever be a problem. These are world markets with hundreds of companies, which can not really be influenced by such a strategy. The dogs of the dow strategy is much more limited, as it invests normally only in the 10 DOW companies with the highest dividend.
…wondering about EPP and it’s weighting in Australia and financials ….
how and why did you decide on this ETF and does the weighting concern you?
You are right, but based on backtests it was by far the best ETF for the Pacific region. The relatively small size and diversification is only acceptable because of the very low volatility of this ETF. It proved that this region is a good hideaway if volatility goes up in mayor regions like US and Europe.
…http://etfdb.com/etf/EPP/#holdings – Australia 64%, Hong Kong 21%, Singapore 12%;
and Financial Services are 39% …. so this ETF with 97% in 3 countries (GDP’s #12, 36, 39 in world), and financial weighting seems a lot less diversified than the others chosen for GMSR…
so as I said above, as a new subscriber I am wondering how and why you decided on this ETF and as the weighting seems so much less diversified than others in GMSR?
You are right, but based on backtests it was by far the best ETF for the Pacific region. The relatively small size and diversification is only acceptable because of the very low volatility of this ETF. It proved that this region is a good hideaway if volatility goes up in mayor regions like US and Europe.
Hello Frank and other subscribers.
Frank thanks for clarification. Two questions.
Regarding ZIV – what a “call” this past month – I am still trying to understand it better along with vix.
Is there a “cliff notes” anywhere or could you say some basics to see if I can
get it better? I also need some help with contango and backwardation!! :-D
Also do we ever adjust a “core etf” … say switching from ILF to EWZ or GXG …. if
the indicators show ILF to be strong could that be used to point to Latin America, but
perhaps as has been the case this yr Columbia is looking very strong and Brazil
seems to be having problems with the world cup and upcoming olympics?
Thanks.
Larry
Leeds MA USA