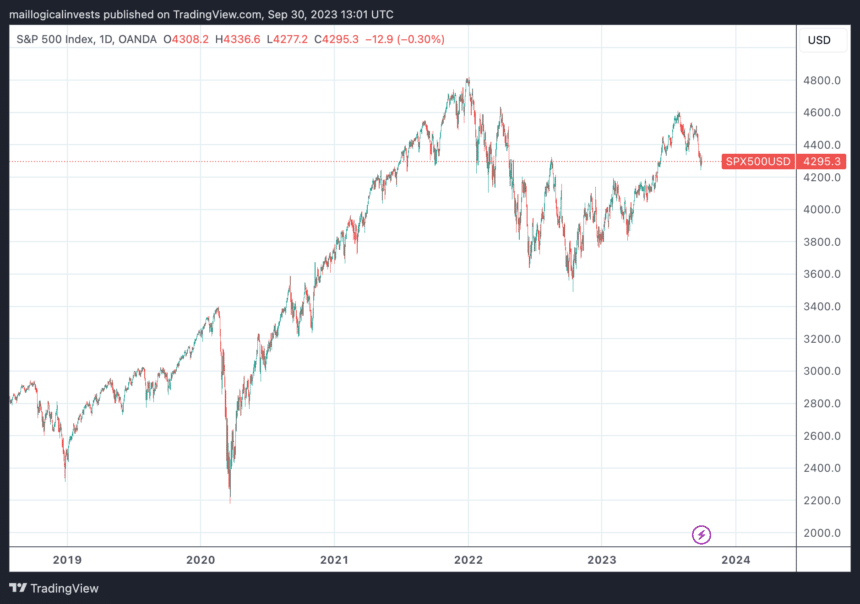
September has turned out not to be a great month for equities, with the S&P down 4.7%. However, this is not particularly worrisome, as the index is still only 10% off its all-time high and has a respectable 13% YTD performance.
Economic Stress
There are other factors worth mentioning, as we observe unusual activity in the markets. It’s best to consult some charts.
Just looking at the index below, it is unclear whether the S&P 500 is heading for new highs or whether it has entered a sideways channel that is fairly wide, ranging from the 2022 low of 3,600 to the January 2022 high of 4,800.
What warrants closer attention is the relationship between short-term and long-term interest rates. Think of the yield on different Treasury securities as the tail of a kite. In this analogy, the height of the chart represents the yield, while the x-axis represents duration. Short-term papers (1-, 2-, and 3-month) are on the left, while 20-year and longer durations are on the right. When the Fed wants to curb inflation, it quickly raises the “kite” (the left part of the curve).

The short term rates have remained elevated at around 5-5.5% for the past four months. The FED does not directly control the far out “tail” but the tail will follow the kite, alas with a delay.
The right tail of the curve, representing 7- to 30-year Treasury yields, has been gradually rising each month—from below 4% to nearly 5% this September. Though this latest shift may not appear significant at first glance, it has considerable impact, as higher long-term Treasury yields directly influence loans and mortgages, and thus the entire economy.
To gauge the impact on long-term rates, one can look at the price of TLT, which decreases when yields rise. Astonishingly, it has lost 8% in just one month.
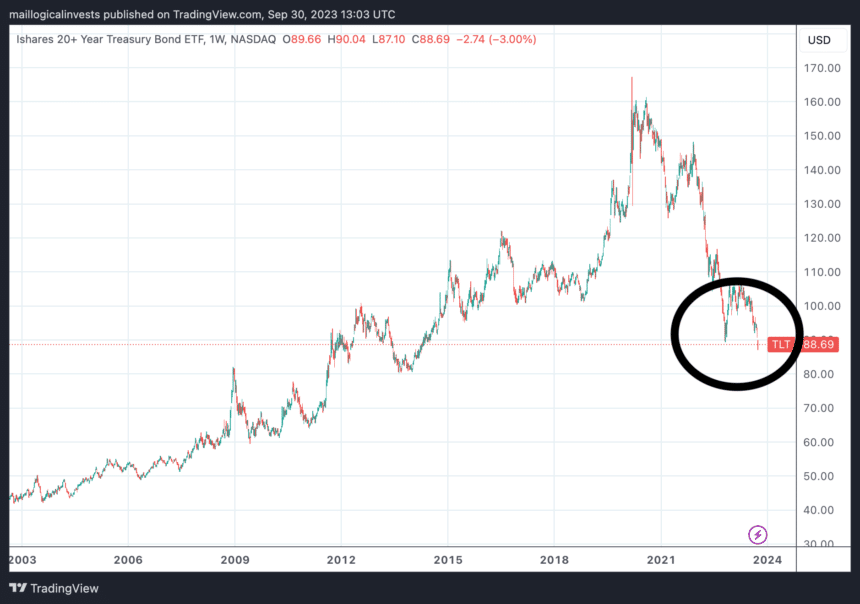
From the chart, it appears that support has already been broken, suggesting that TLT may continue to trend lower. In simpler terms, long-term yields are rising faster than before, which could significantly impact everything including bank portfolios and government deficits.
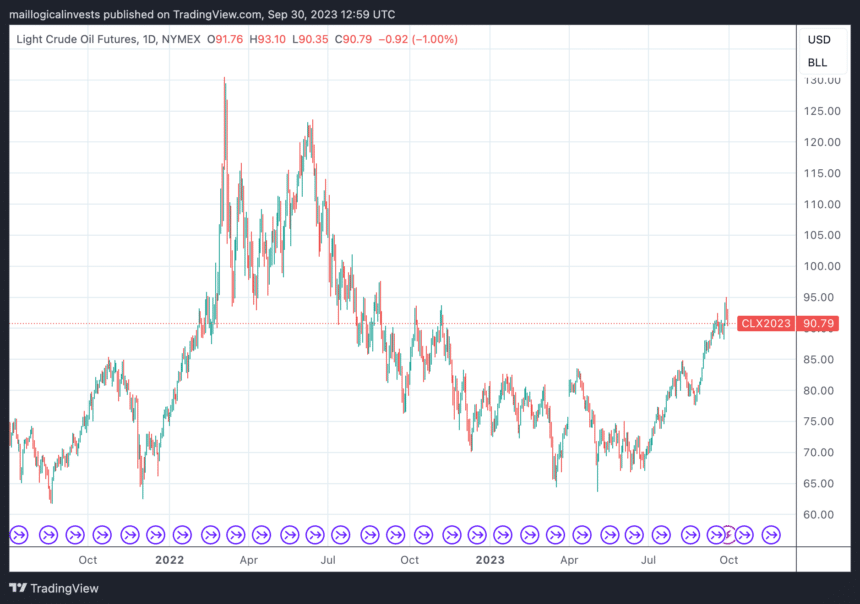
Simultaneously, we’re facing another economic stressor: rising oil prices. The USO index increased by 7.7% in September, and crude oil prices have climbed back up to nearly $90 per barrel, up from $70 in July.
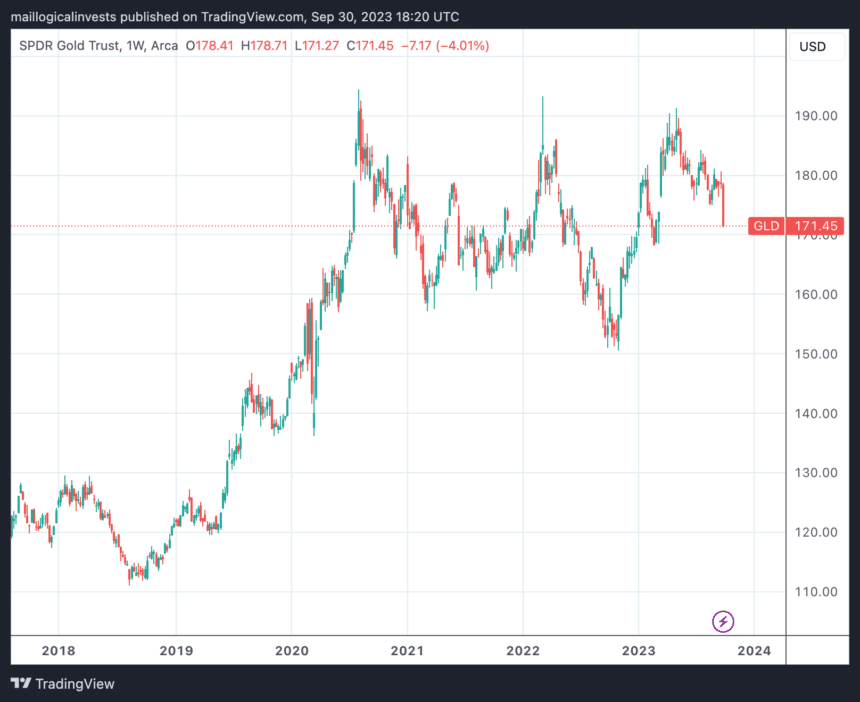
Finally gold is behaving strangely, losing 4.8% for the month.
Conclusion
Price action does provide a context for the market but it obviously cannot predict prices. October is another month that is seasonally weak for equities. However, the more favorable end-of-year months are just around the corner.
Until then, proceed with caution and consider maintaining a hedge.
Strategy September Performances

Let us know what you think in our forum.
The Logical-Invest team.