The Nasdaq 100 stock rotation strategy is a good fit for investors that want to intelligently invest in Nasdaq as well as for stock-pickers looking for a rules-based stock selection strategy. The Nasdaq strategy can also complement our existing strategies and can work well with our more conservative strategies like BRS (bond rotation), the BUG or with non-U.S. equity strategies like World Top 4.
Summary of the Nasdaq 100 stock rotation strategy
- Intelligent Algorithms run two prallel sub-strategies employing Nasdaq 100 stocks.
- Meta-layer chooses between the two sub-strategies based on current market conditions.
- Variable allocation to Treasuries provides protection from large drawdowns.
Key Principles of the Nasdaq strategy
Financial asset momentum is a well-documented and academically proven occurrence. It reveals itself in assets that have strong absolute performance and/or relative out performance vs peers. What is exciting is that momentum, when properly measured, tends to continue for the next time period. Hence, momentum assets have a nice “edge” in future performance vs other assets.
We have been exploiting asset class and sector momentum; however individual stock momentum tends to be an even stronger force, particularly in the top NASDAQ stocks. We have found a way to effectively capture and tame the tiger that are the hottest trading Nasdaq stocks.
During bull market phases, and especially “risk on” periods, the strongest NASDAQ stocks blow everything else away. However, they can “get ahead of themselves”, and their high volatility makes them vulnerable during phases when the overall market is in a “risk on” mode.
Can you invest in Nasdaq 100 stocks without risking big drawdowns? Yes!
To manage those challenges, we implemented several exciting methodology improvements.
- Mean Reversion: One of the things that scares a lot of investors is buying stocks after they have run up a lot. Momentum is based on this principle of buying high and selling higher, however stocks that rise in a short sudden burst may, in the short term, correct. We have found that we can improve results by adjusting for the most recent period movements. If a stock rises too much or too fast, we account for mean reversion by penalizing such short term behavior.
- Protection: We allow the model to allocate a part of the portfolio to Treasuries to balance out the supercharged Nasdaq momentum stocks. This effectively smooths out the equity and improves risk adjusted returns by moderating strategy drawdowns. It also allows the model to allocate more to Treasuries, if the Nasdaq index, as a whole, exhibits momentum weakness.
- Intelligent Ranking: Our improved MaxSharpe engine ensures we get the right blend of stocks that work well together and have an allocation to each individual stock that reflects their volatility and the optimal blend with other stocks.
Compact Meta Strategy for selecting the top stocks in Nasdaq
Nasdaq momentum goes through two very different regimes . . . pure risk on aggressive growth, and more constrained/flat/choppy periods. High volatility stocks work in the high growth periods while lower volatility momentum stocks work better in constrained periods
When you invest in Nasdaq stocks, no one model could optimally handle this switching, so we built two models – a high volatility and low volatility model. Rather than put the burden on subscribers to switch between these models, we created a Meta-Strategy to switch between the high vs low volatility models. These works really well, as the market regime tends to stay in the same state for a number of months at a time.
So each month the Nasdaq stock selection strategy chooses between the two alternative configurations – and it picks four stocks from that chosen model.
Stress Testing Results for the stock selection strategy
Early this year we built this strategy, and we wanted to give it time to feel comfortable that it would hold up in a variety of conditions. Well, the August/Sept nasty correction have given us confidence that his approach can withstand the market stress quite well. NASDAQ is our strongest potential growth strategy.
Over the last ten years, here is the backtest model performance vs benchmarks.

You can see how normally the high volatility is the strong stock selection, but it does not always work, hence the higher drawdown. The Meta layer helps by switching between them based on which has been working better.
How to read the table:
- NASDAQ Meta: This is the portfolio level meta-strategy – the net results of the model, as the model switches between the high vs low volatility sub-models. Note that subscribers would track against these results.
- NASDAQ 100 (hv): The high volatility momentum sub-strategy.
- NASDAQ 100 (lv): The low volatility momentum sub-strategy.
- SPY & TLT: Benchmarks performance for the S&P500 and long term US Treasury bonds.
Metrics are pretty standard
- CAGR: Compounded Annual Growth Rate
- Sharpe: https://en.wikipedia.org/wiki/Sharpe_ratio, using 0% risk free rate.
- Volatility: Degree of variation of a trading price series over time.
- Max Drawdown: Peak to trough maximum decline; note – this is less insightful than other measures, as it is a signal point.
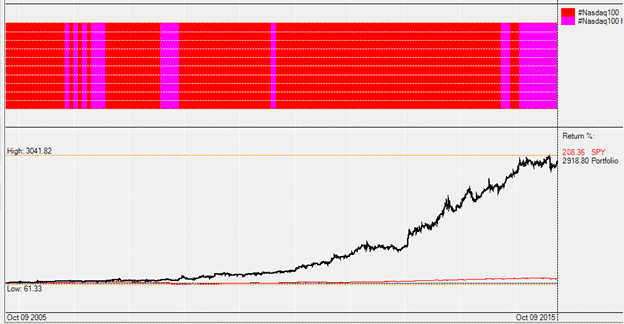
A graph of the backtested Meta-Strategy performance over the 10 years vs benchmarks. The top bars show the switching between the high vs low volatility stock selection systems.
Here is the NASDAQ high volatility stock selection strategy.

Here is the low volatility; it still outperforms the benchmarks, but not by as much. However it avoids a lot of damage during certain market conditions.

What stocks are in the Nasdaq 100 at each point in time?
Note that our testing was done using the current list of stocks. This introduces a certain amount of forward looking bias, often called “survivorship bias”. It means that during backtesting, the model can only choose stocks that have survived today. This can results in somewhat overstated backtest results. We want you to take this factor into account when considering this strategy. But even if one discounts backtested returns, we are confident that this approach will outperform, in risk adjusted terms, a buy and hold, evidenced by its strong results throughout 2015.
A three year view of performance tells a similar story, so we won’t go into a lot detail.

Here is the most important view, how it has done in the last year:

The Meta-Strategy has done incredibly well vs virtually every other asset class, even during the severe market correction of the last two months. For most the year the Meta layer stayed in low volatility, but it did grab the high volatility during the strongest market months of November 2014 to March 2015, as you can see in the graphs below:

NASDAQ 100 High Volatility stock selection strategy:

Notice how the low volatility held most of the gains while the S&P was going negative for the year.

How the stock rotation formula works
Before the open of each new month the strategy first chooses which sub-strategy to use – the high vs low volatility NASDAQ model. Then, the chosen sub-model picks the best four stocks out of the NASDAQ 100 that meet the criteria. For example, in September, the chosen sub-model was the low volatility, and it picked the following stocks as a % of the capital allocation
- EXPD, 30%
- HSIC, 10%
- LMCA, 10%
- ORLY, 30%
Additionally TMF was chosen with a 20% allocation.
Subscribers following this strategy would divide the capital following this strategy among the stocks and ETF as listed.
Subscription & Model Changes
- The strategy is available for subscription for just $30 per month.
- All-Strategies subscribers, new and current, will have access to the NASDAQ 100 stock selection strategy.
- We are discontinuing the GSR-aggressive strategy. The role of the GSR-aggressive was high growth with some risk. Our new NASDAQ stock rotation strategy is an improved, more evolved model and we believe that this strategy can serve that very purpose better. Existing subscribers will be provided the NASDAQ signals in addition to the GSR signals at no extra charge.
Role of Strategy within a Portfolio
This strategy is a good fit for investors who want to intelligently invest in the Nasdaq 100 as part of the U.S. equity market as well as for stock-pickers looking for a rules-based growth strategy.
The stock selection strategy can also complement our existing strategies and can work well with our more conservative strategies like BRS (bond rotation) , the BUG or with non-U.S. equity strategies like World Top 4.
Please stay tuned, we have other exciting future strategy developments coming your way in the next month.
By Frank Grossman & Vangelis Maderakis.
I assume the Nasdaq 100 signal will go live starting with the Nov. 2nd posting, correct?
Yes,That is correct.
The NASDAQ 100 strategy is a significant innovation in the LI service and very exciting. I’m eagerly awaiting the other new strategies you indicate are on the way. A question though…
The strategy write-up describes SPY and TLT as the relevant benchmarks. But this week’s performance report indicates the benchmark beat the NADAQ 100 strategy by about 50%. What is the benchmark reported in the weeks week’s results?
Thanks again for your research and innovation.
Dear Richard, Thank you for the support. The benchmark used is the SPY etf. The strategy can underperform the SPY for various reasons, one being that it hedges with TLT. Other reasons are stock selection and the relative performance of the NASDAQ index vs SPY.
I notice the full 10 year back test results are no longer visible on the performance charts. Just curious as to the rationale for this.
Thank you,
WK
Dear William,
Since this strategy tracks individual stocks, changes in the index composition affect the backtest universe of available stocks (what we discuss as “survivorship bias” in the paper). A 5 year history is more reflective of true conditions and should be more than sufficient to track a strategy going forward. For historical backtests longer than 5 years you can refer to the original paper or contact us for further details and custom research.
Hello,
I am still interested in seeing the NASDAQ 100 Meta included in the “Portfolio Builder” tool set.
Thank you.
RM
This is an excellent strategy – couple of questions
1) How does the Meta-layer decide between hi-vol and lo-vol markets? Does it look at the past performance of each strategy (hi and lo vol) or does it look for some market-aggregate signal such as SPY performance?
2) How is the allocation of hedge (TMF) determined? Is it using MaxSharpe (just like the other symbols selected) or is it based on some other market-signal?
3) Is the difference between hi-vol and low-vol strategies the volatility attenuator (e.g. 2 vs 1) used? Or are they completely different selection criteria?
1) it backtests the last 3 months with different volatility attenuators. It continues with the best setting for the past. We do not look at other indexes.
2) It is using MaxSharpe. The Nasdaq strategy is a momentum strategy, so we do not try to lower volatility with a big percentage of treasuries.
3) Yes, normally we run the strategy with a volatility attenuator of 0.5 (performance is more important than volatility in the Sharpe formula) and only during bear markets we switch to a volatility attenuator of 2.5 (low volatility is 2.5x more important than performance in the Sharpe formula)
I am a subscriber to this strategy. Can you tell me the annual turnover of the strategy? I know it probably varies but a range is fine.
During the last 5 years the Nasdaq 100 strategy did about 40% per year which is about twice the performance of the Nasdaq 100 index. Year to date we are at 14.5% which is also twice the YTD performance of the Nasdaq 100 index. This year the Nasdaq 100 is underperforming the S&P 500 and the Dow 30.
You can use a data set to test your strategy and avoid “survivorship bias”. We AmiBroker users have Norgate Data that has properly accounted for changes and de-listings in the Nasdaq and other indices. I would be happy to test your strategy on such a database if you’d like.
Also, how does your strategy fare on other stock indices? Have you tested it on the Russell 1000, Russell 2000 and the S&P 500 ?
Larrt
I have heard good things about the database service but never tried it. I use and like AB but the strategy currently runs on a different platform (QuantTrader). We will take a look and see if we can translate the code. Thank you for the offer.
Vangelis – was the NASDAQ100 strategy ever tested against the alternate dataset to account for the survivorship bias in the earlier returns?
Not really as we have enough real out-of-sample data to actually see non-biased results. Historical results are here: https://logical-invest.com/app/strategy/NAS100!
OK Vangelis, let me know if you need help coding the afl.
A second possibility is you purchase the data (reasonably priced) and I assume you can convert the text files into whatever format your “QuantTrader” uses. Then run the backtests.
Larry