Happy new year –and let´s start it set-up for success with some Markowitz Modern Portfolio Theory!
As previously announced, we´re updating our Portfolio Builder Optimization periodically, both in the Online and Offline Version.
Updated Portfolio Builder Optimization for 2017 employing Markowitz Modern Portfolio Theory
Why that? Recall the Portfolio Builder is using a Markowitz Modern Portfolio Theory approach, that is, we´re using past returns, volatilities and co-variances to determine an optimum fixed-weight allocation among our different strategies under certain rules: Either to Maximize the Sharpe Ratio (Risk/Return), target a volatility level one feels comfortable with, or to limit historical drawdown in the expectation this will also hold true for the future.
Using Markowitz Modern Portfolio Theory
While full-blood Markowitz aficionados will now probably feel the urgent need to stone us to death, yes, same to some other peers in the industry our approach is dynamic and we do not feel the past is set in .. hmm.. stone! As such, we need to update our Portfolio Builder Optimization periodically based on the most recent returns, volatilities and co-variances of and between our strategies.
As the overall optimization is based on data from the past 8 years and we´re only adding the last quarter of data the changes are relatively small as you can see in the following.
2016 results of our 10 Portfolios for everybody
But before going into the allocations for 2017, how was the performance of the 10 “pre-configured” Portfolio´s during 2016? Results using our Online Portfolio Builder are as follows:
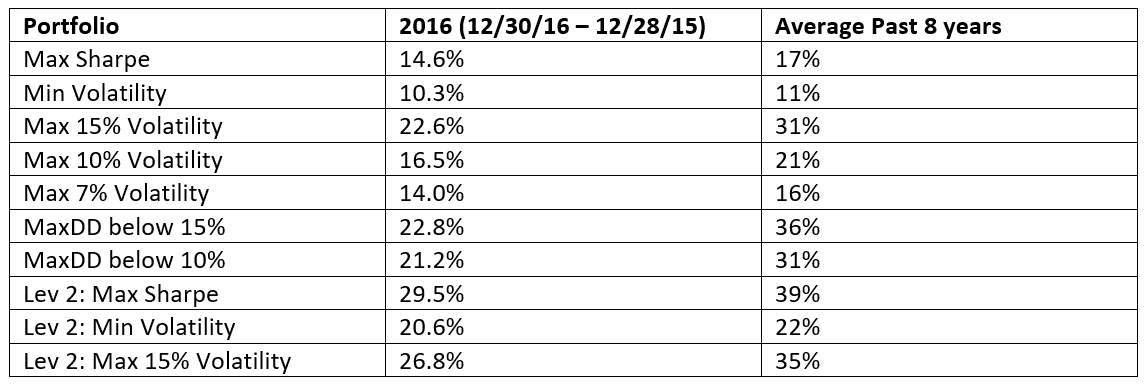
But overall with all Portfolios in the double-digit area, six of ten Portfolios topping 20% in returns and all but the minimum Volatility Portfolio exceeding the 12% return of the S&P 500, the conclusion of a partly bumpy year with many surprises is excellent. It pays out to be diversified over low correlated strategies!Looking for a pattern in the individual under or over performance to their historical average, especially strategies with a high bond allocation suffered in the last half due to the anticipated FED hike and the “Trump effect” for higher inflation expectations due to a significant public spending program. On the sweet side, strategies with high equity exposure had either a great run following the January/February 2016 recovery, or benefited from the strong exposure to NASDAQ in the last two months of the year.
Allocation update January 2017 with Markowitz Modern Portfolio Theory
Now, let´s rinse & repeat the same for 2017, a year which is once again full of “known unknowns” like a new administration in the US, elections in many European countries under a populist shift, risks from Chinese debt and equity bubbles, hot real-estate markets in most regions, a Russian president entering new friendships with western populist leaders and probably many “unknown unknowns” just to keep us young and fresh. Here a nice collection with 10 Outrageous Predictions for 2017 I liked a lot.
Here the allocations of the Portfolios in 2016 as of the last update:
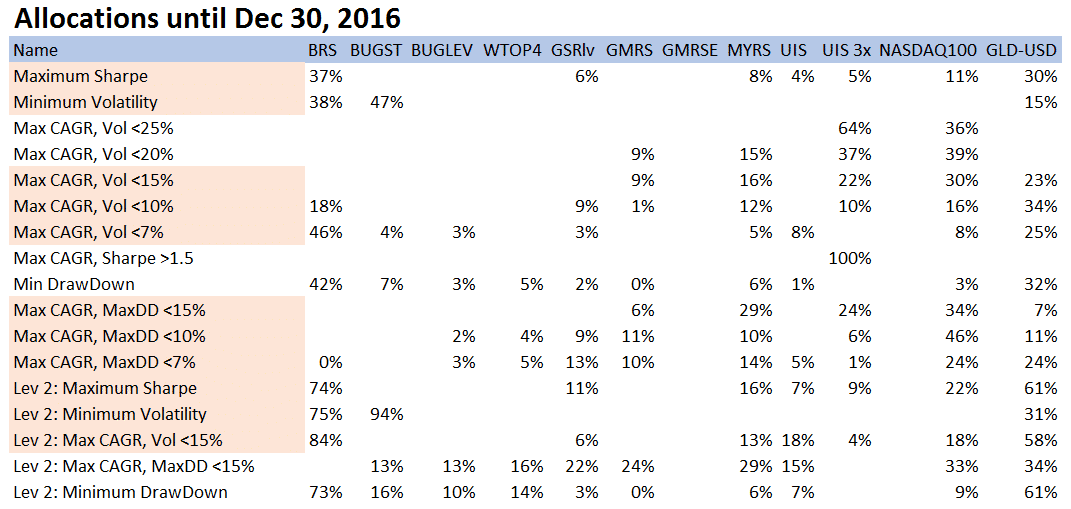
And here the new allocations as of January 2017:

You can see that only in 8 cases there have been changes of more than +/- 5% in the allocation to individual strategies. As result, there are also only insignificant changes in the historical performance statistics of the individual Portfolios. Our portfolios employing Markowitz Modern Portfolio Theory seem quite stable over time.
You can download the updated Excel Version here, or use the Online Portfolio Builder in the usual spot.
In anticipation of a vivid discussion as always,
All the best,
Alexander Horn
I cannot open the new PB in my Excel, message is “The file is broken”.
But from “As the overall optimization is based on data from the past 8 years and we´re only adding the last quarter of data the changes are relatively small as you can see in the following.” I understand that Portfolio Builder still uses outdated version of strategies. For example it uses “ancient” version of GMRS without any hedge or strategies with TMF as a hedge.
Is that true?
I still insist that Portfolio Builder should use current, updated versions of strategies. As you wrote: “we do not feel the past is set in .. hmm.. stone!”. If you change strategy, you should adjust also the backtest results.
Thanks for letting me know, have updated the link now to a zipped version.
Regarding the “ancient” version as we´ve also discussed over mail. Our policy is to “never change the past”, that is our performance curves always show the strategies as our followers have been invested – even if there are made enhancements over time. We will not change this – also to avoid confusion – but are working on a compilation of the most recent backtests so you can compare.
Thanks for the zip version, it opens now OK.
Just to clarify: I’m not asking for changing the performance of strategies displayed on a webpage: it should reflect as close as possible the real performance. But backtests are different thing and serve different purpose.
I’m very glad that you work on making the backtests public for people without access to QT. We’re not “buying” the old versions of strategies, we’re buying the current versions so we should have access to backtests of it.
It would be extremely helpful (I don’t know how much effort does it take) if one could use those backtests in Portfolio Builder as well. I think the Portfolio Builder users are sophisticated enough to understand the difference between past performance and backtests.
Yes, we are creating a separate Excel Builder with the backtested performance as of the last enhancements.
Thanks for the update-Is there a list of all of these ticker symbols? For example, what is BRS? Also, I’m assuming if the overall portfolio adds up much higher than 100%, the higher numbers are leveraged? And last but not least, what about the 3x UIS? Isn’t it a strategy on its own? Thanks
Sorry for the “Logical Invest Slang”, here the list of abbreviations for our strategies. The last five strategies marked with “LEV2” use a 200% leverage, e.g. 200% allocation. 3X UIS indeed is a strategy by itself, and is used in several of above portfolios, for example with a 21% in the “Max CAGR Vol <15%" Portfolio. See here for how these Portfolios are constructed: https://logical-invest.com/easy-investing-logical-invest-portfolio/
BRS Bond Rotation
BUG Permanent Portfolio
BUGLev Permanent Portfolio Lev
WTop4 World Top 4
GSRlv Global Sector
GMRS Global Market
MYRS Maximum Yield
UIS Universal Investment
UIS3x 3x lev Universal Investment
Nasdaq100 Nasdaq 100 Top 4
GLD-USD Gold Currency