For many years, most of our strategies used long term Treasuries (TLT, TMF) as a hedge against market corrections. These Treasuries have been a safe haven asset with negative correlation to the stock market and have been used successfully to reduce the risk/volatility of our strategies.
With rising rates and inflation, long term treasuries lose a part of their value as a safe haven asset. Their hedging value depends mainly on the speed interest rates go up. If rates go up slowly and inflation stays low, then ETFs like TLT will still be a good hedging choice. To be on the safe side we diversified our strategy hedge.
Universal Investment Strategy UIS
Our U.S. based Universal Investment Strategy UIS will have a hedge that can now choose between TLT and TIP. TIP is a very liquid inflation protected Treasury. TIP is less volatile than TLT and is a good alternative when TLT is heading lower.
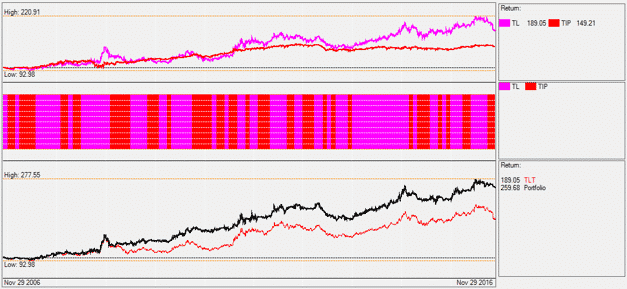
Here is a 10 year comparison between TLT (lower red chart) and the hedging algorithm which switches between TLT and TIP (lower black chart).
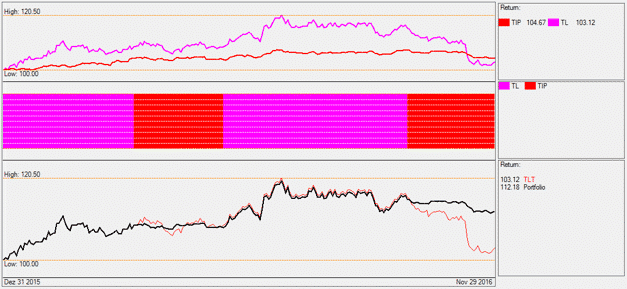
In the year to date chart you can see how the allocation switches between TLT and TIP. Since October the hedging strategy is invested in TIP.
The new UIS strategy allocates between SPY and the TLT/TIP hedging strategy.
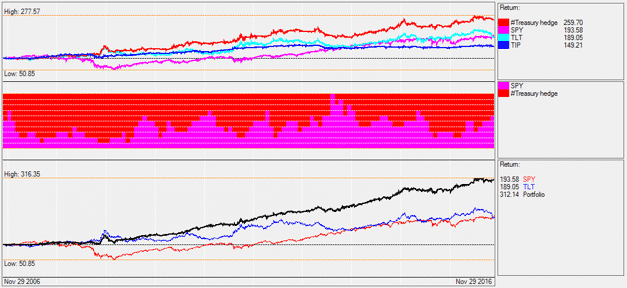
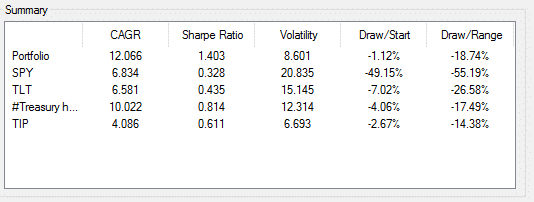
The annual return (CAGR) for the last 10 years has been 12.06% with a Sharpe ratio of 1.4. This compares with the performance of the original UIS strategy of CAGR 9.5% and Sharpe 1.1. So there is a clear improvement for the new strategy.
The Bond Rotation Strategy BRS
The Bond Rotation Strategy BRS will be improved by also adding TIP as a 5th ETF. BRS did very well this year with a year to date performance of 11.36% and this even without TIPs. Here TIP will not change much on the performance because even before, this strategy has been quite diversified. Now it invests in 5 Bond ETFs which are US Treasuries, US TIPs, Junk Bonds, Convertible bonds and Emerging Market Bonds.
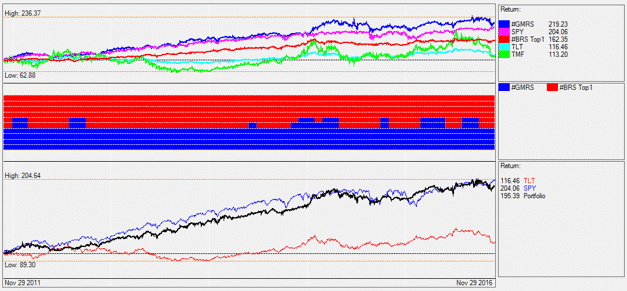
Global Market Rotation Strategy GMRS
The GMRS has suffered this year from the sideways market and from the bad TLT Treasury performance. As GMRS is an international strategy we replaced TLT with a Top1 BRS strategy. This means that we are not limited to TLT, but always use the best of the BRS bond ETFs as a hedge. This combination makes the strategy very flexible, because on the equity side and on the bond side there is a good choice of ETFs. The risk adjusted return for the past is basically the same. Sharpe 1.47 for the new strategy and 1.46 for the old strategy. The real difference is only visible during the last 2 months where the new strategy using the BRS hedge managed a 7% out-performance from the original one. So, here we expect to see improvement in the coming months. Using BRS as a hedge is certainly a good strategy because BRS is a proven strategy which did very well these last years.
Global Sector Rotation Strategy GSRS
For the GSRS we also replace the TLT hedge with a BRS hedge. Here the new strategy shows a good improvement with an average annual performance going from 9.6% to 12.4% and a Sharpe going up from 1.1 to 1.5 for the last 10 years.
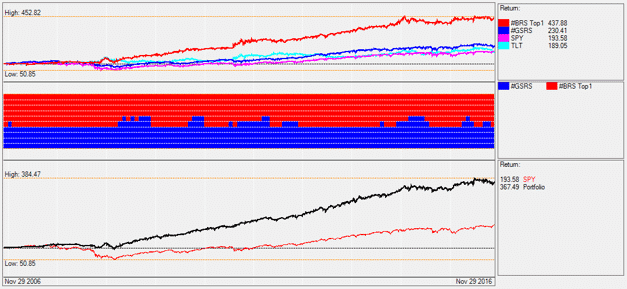
Here the improvement is bigger than for the GMRS because the Sector Rotation low-volatility algorithm favors larger allocations to the hedging component, TLT. This means that GSRS suffered more when TLT did not perform well. Now, going forward, the strategy should do better with the larger bond selection that the Bond Rotation Strategy provides.
I have a question regarding GMRS strategy. You wrote: ” As GMRS is an international strategy we replaced TLT with a Top1 BRS strategy.” But GMRS wasn’t using TLS. It was using TMF which is 3xTMF. So now it uses not leveraged ETF: does it mean that now it has to invest (roughly) 3 times more in bond ETF than before? My point is that if this is correct, it would be much different strategy right now, since the “growth part” (EEM/MDY/…) is now much less allocated.
For example in April the allocation was 70% MDY / 30% TMF so it was equivalent to 70% MDY / 90% TLT (or other not leveraged fund). Now if want to squeeze it into 100%, we’ll end up with something like 45% MDY / 55% TLT which is quite different from original.
Could you please post a detailed backtest of those two variants of GMRS (old one, using TMF and new one, using top 1 BRS fund)?
“But GMRS wasn’t using TLS” – *TLT
You are right. We had to go away from the 3x leveraged TMF. So the strategy with the new hedge is now “deleveraged”. However as the new hedge is more diversified, we can get the same results for the 10 year backtests. Main reason is, that also before, there have been periods where TMF/TLT did not perform well and even if TMF/TLT had only a small allocation, it was dragging down the strategy performance. The bond rotation however always had at least one bond which performed reasonably well, so this helps a lot and you do not need to 3x leverage the bond part of the new strategy.
I understand the reason behind this, but what concerns me is that replacing TMF with other bond fund greatly decreases allocation in “growth” part of the strategy. And while it’s similar in terms of Sharpe, it may be very different in terms of CARG, drawdown and so on. Could you please post some backtest stats?
Other question that comes to my mind is: there are others strategies using TMF as a hedge. Why only GMRS is switching to BRS fund?
And other question: what if, instead of using top 1 fund from BRS, one would use just BRS (2 funds). I understand it may be inconvenient to some, but if I’m investing in BRS anyway it may be wise to just us it.
Some of the strategies (MYRS and UIS3x) just need a 3x leveraged hedge. There are no 3x leveraged ETFs for all BRS ETFs. But as MYRS and UIS3x are not defensive strategies with a generally high Treasury allocation, these strategies can live with the current TMF correction and we all know that every correction will sooner or later come to an end.
You can always invest in the top two BRS ETFs instead of only one. I used only one ETF just to simplify the strategy. Using 2 ETFs is even better.
Thanks for all explanation. I would really appreciate if you could post “new GMRS” vs “old GMRS” backtest results, so I could see how it now would fit in my portfolio of strategies. I have a gut feeling that “new GMRS” would be much more “defensive” strategy with lower CARG, drawdown and volatility, but I’d love to see the actual backtest results.
Hi Frank
Hope you and family are well. What’s your thinking on using an inverse ETF like TBT (-2x 20 year treasury) as a hedge now??
Best wishes,
Jimmy V
I don’t think that this would be a hedge because inverse Treasuries are normally positively correlated to the stock market. Until Treasuries find a bottom, cash or a moderate inflation protected Treasury like TIP is the better choice.
World TOP 4 also has changed from what I see, and also in this case I suppose the strategy will be very different from now on.
Both World Top4 and GMRS strategies are composed of a equity strategy and a hedge strategy. From the two we build two meta strategies which is something like synthetic ETFs representing the strategies. The equity meta-strategies of both have not changed. Still the same ETFs would be selected. Only the hedge has changed. So, there is not a big difference. The equity contribution to the total performance remains basically the same. Just the hedge contribution has changed.
So I have to be missing something. How I understand this:
1. Both strategies have “equity” part and “hedge” part
2. Before changes, the “hedge” part was represented by TMF and, for most of the time, the allocation was oscillating between 70% “equity” / 30% “hedge” and 90% “equity” / 10% “hedge”.
3. But, as TMF is 3x leveraged fund, one can say the allocations were more like 70%/90% to 90%/30% (if we use margin and TLT instead of TMF)
4. After changes we’re switching from TLT to other bond ETF. But, since we used TMF, we now have to allocate 3x more in those bond ETF, to achieve the same hedge. This is very much visible from current allocations: GMRS and Top4 “hedge” parts are, respectively set at 60% / 70% of allocation.
5. This leads to much lower allocation in “equity” part. Even if meta strategy behind “equity” part hasn’t changed, its impact on whole strategy performance has to be lower!
The example:
Imagine two strategies:
One has allocation 80% “equity” / 20% leveraged “hedge” (so it’s like “old” strategies). So basically it’s 80% + 60% if not leveraged hedge is used.
Second is it’s equivalent, using not leveraged “hedge”. To achieve the same “equity”/”hedge” balance we have to allocate 57% in “equities” / 43% in “hedge”, if I did the simple math correctly.
Let’s assume that all the bonds, used as “hedge” were completely flat for a month, and the equity part, which is the same in terms of composition for both strategies, was up 10%.
The first strategy is up 8%. The second one is up 5.7%.
Let’s assume the opposite, flat equities and 10% rise in bonds.
The first one is up 3 x 0.2 x 10% = 6%, the second one is up 4.3%
Correct me if I’m wrong.
Your logic is correct. The adjusted WT4 backtest does have larger allocations to the hedging BRS strategy than the older strategy had to TMF (or 3x TLT). But do keep in mind that BRS also includes CWB, PCY and JNK which are often positively correlated to the equity market, thus boosting “equity type allocation” under favourable circumstances.
Thanks. I’m still looking forward to see backtest results, to compare with previous version.
When you make significant changes to the strategies do you create a new portfoliobuilderexcel that represents the historic results from the changed strategies or does the builder always represent the strategies that were current at the time?
In this article you discuss the improvements in the results based on 10 years worth of data, going back to 2006, that clearly includes the financial crisis of 2007/8. However the portfoliobuilderexcel-v.033 only has data going back to Oct 2009 which misses this key event. Why do you not include this extra historic data in the portfoliobuilderexcel?
Alexander created portfoliobuilderexcel-v.40 that included data going back to June 2008 which helped, but having a complete picture going back to 2006 that fully covered the financial crisis would give us all a lot more confidence about how our meta strategies would have performed during that bear market.
Since UIS and other strategies have 2 hedge instruments i.e. SPY, TLT, TIP, do you now allocate to both hedge instruments based on MaxSharpe (e.g. SPY,TLT, TIP in case of UIS) or do you replace TLT with TIP (i.e. allocate only between SPY, TIP based on MaxSharpe in case of UIS)?
UIS only uses 2 instruments: an equity (SPY) and a bond (either TLT or TIP). Whether TLT or TIP will be used, depends on their relative performance. Usually TIP is chosen when TLT significantly under-performs TIP.
Has the custom portfolio builder been updated with these bond changes??
I don’t think it has been updated, even the pages regarding each strategy hasn’t been updated.
This is bit unsettling. We’ve been offered signals, but we don’t have access to backtest, only brief information that performance is same or better. For the strategies which were using TMF, which was replaced by not leveraged bond ETF this is crucial, and I really can’t understand why the backtest results weren’t posted immediately.
We will be updating the strategy descriptions this week. The portfoliobuilderexcel uses the allocations of the unadjusted strategy up until now. This month it uses the new ‘adjusted’ allocations. The adjustments are not meant to affect the nature of the strategies but rather replace the hedging asset and are of conservative nature.
I’m not questioning the changes, but it would be better in my opinion if we’ll be able to review the impact of it before we get signals. And I would appreciate a reply for my comment written at December 2, 2016 at 9:42 am a lot. Thanks!
You are right, Marcin, it would be better to have published and reviewed the logic extensively before. The truth is we have been working extensively in enhancing the TLT hedge using all kind of complicated options strategies and that took us some time before we settled to this solution.
I have another question. After the election, it seems like there is quite a shakeup in the US$ based sectors, with financials and industrials getting traction. The prospect of deregulation can have a big effect.
Have you considered a US sector strategy?
Frank has been working on a U.S. sector rotation strategy for a while and has advanced it considerably. If there is demand we will publish the model.
From what I see the strategy pages had been updated to reflect the changes in hedge but only partially, the backtest charts are the same, am I right? And what about Portfolio Builder. I still would like to see the full backtest results for all updated strategies, thanks.
From the moment we go live with a strategy we will not change the past. So the past performance is frozen and will not be updated to changes in the strategy. We would be in serious trouble if the charts suddenly show better results as our subscribers realized.
I’m not asking for changing historical performance. I think it’s a misunderstanding. There are two very different equity lines: one is backtest of the current strategy and other is real performance of Logical Invest.
I am asking for backtests. New users will not use previous versions of strategies. They want to know, how the strategy in it’s CURRENT version worked in the past. I want to know, what was the CARG/maxDD/Sharpe and so on. I’d like to know how it behaved in 2011 during crisis and so on.
Please explain, what is the value of backtest eg. 2008-2014 of previous version of strategy? I wasn’t in real life use during that period. What’s more, it won’t be in use in the future.
Here you have a Pdf with all the strategy backtests made with the latest QuantTrader version and using the new hedge.
https://dl.dropboxusercontent.com/u/43364046/Logical-Invest%20QuantTrader%20versions/10%20Year%20Strategy%20backtests%20as%20of%20Jan%204.pdf
Thanks!
Thanks again for the data.
I’ve finally found some time to analyse it and found out that I was mostly right about GMRS strategy which now has significantly changed, comparing to version used for performance analysis (which, as it turned out, is mostly even older version of this strategy).
New GMRS vs old GMRS
CARG: 26% / 35%
Volatility: 18,1% / 23,9%
Sharpe: 1,45 / 1,49
MaxDD: -31,15% / -31,15%
So now we have much lower CARG and Volatility, giving very similar Sharpe (and same MaxDD which I think is some kind of error)
For WTOP4 the differences are more subtle.
I had to readjust my strategy to maintain it’s “aggresivenes”. I had 20% in GMRS / 20% in BRS, now I changed to 25% GMRS / 15% BRS but I’m using not top 1 bond ETF from BRS in GMRS as a hedge but “whole” BRS instead.
You can not compare the strategies like this. The strategies adapt to the market conditions of the last 1-2 years. So the backtest of the first GMRS versions was an optimization for the last 10 years, however going forward the market changed quite a lot. With the today used parameters, it makes not much sense to look back 10 years as they are optimized for the last 1-2 years only and during this period, the new adapted GMRS strategy would have done much better than the old one.
Btw, Sharpe is about the same, this is what is important. The old strategy had higher CAGR and Volatility because with TMF (=3xTLT) it was a slightly leveraged strategy. If you have a margin account, then you just have to invest about 1.35x the old investment and you will have the same as before.
A strategy is never a static one time development. It has constantly to be adapted to market conditions. It is however important that the main idea of the strategy is maintained. With GMRS the idea is that you invest in the best world markets and hedge with bonds with a preference to the negatively correlated Treasury bonds.
Regards Frank
I know that the change was good and I’m in no way against it.
But as you wrote the old strategy was more volatile and profitable, so it added more risk and volatility to the portfolio. Now I have bit more conservative strategy, so I changed it’s weight to maintain the same risk/profit expectation level.
Has the backtest using the new versions going back to 2006 been shared with anyone? I would like to see the information if it is available. Is there any other product that has been considered with the MYRS instead of the TMF as rising rates would greatly affect the performance.
Unfortunately there is not really a good replacement for TMF. However I am quite sure treasuries will find a bottom. They don’t need to perform well during normal times. I am already happy if they are more or less flat. The important thing is that they spike when markets and ZIV dives. This produces a profit which then can be used to buy ZIV at a low price.
Here you have a Pdf with all the strategy backtests made with the latest QuantTrader version and using the new hedge.
https://dl.dropboxusercontent.com/u/43364046/Logical-Invest%20QuantTrader%20versions/10%20Year%20Strategy%20backtests%20as%20of%20Jan%204.pdf
There’s an interesting article on TMF here: http://seekingalpha.com/article/4037686-tmf-will-tend-underperform-tlt-long-term
Could you please share your thoughts about it? I understand that the role of TMF is to be a hedge but on the other hand some of strategies have long term exposure on TMF (NASDAQ 100 helds 20% in TMF for most of the time), so perhaps we should be concerned about the long term performance of the TMF?
Maybe there are some better options like TLT on margin?
Yes, the author is right and this is a well known we´ve also addressed before. You can also see it visually in the “Hell on fire” blog here: https://logical-invest.com/hell-on-fire-part-i-the-3x-leveraged-universal-investment-strategy/ (see graph: https://i2.wp.com/logical-invest.com/wp-content/uploads/2015/04/SynTMF1.png)
TMF tracks quite nicely the 3x DAILY performance of TLT, but long term the complicated math/structure behind these leveraged ETF cause a tracking error, especially when volatility is high. But if you do not have access to a margin account and need to leverage to retain the hedging effect we´re looking for then TMF is the best way to go. If you have margin you can also use 300% TLT, but at the cost of the borrowing fee – which might be higher than the tracking error.
So it´s not really a concern, but rather a fact to be known in my eyes.
I understand that, but my point is slightly different…
I’ll put it that way: short term TMF is 3x TLT. Long term it’s more like 1x TLT (in terms of return) and 3x TLT (in terms of risk/drawdown) – those are results from the article.
NASDAQ100 strategy uses TMF in long term. It’s invested in 20% of TMF for most of the time. I wonder, what would happen if we use TLT instead (not 3x TLT, just TLT). Probably the Sharpe would be worse (but I don’t know if much worse), but it the author is right, the long term return should be very similar. Have you tested this scenario?
We use TMF because its negative correlation to the Nasdaq100 stocks is reducing the risk/volatility of the strategy. Sure you can do the same with only TLT, but then the strategy would allocate about 60% to TLT and only 40% to the Nasdaq100 stocks. The CAGR would be reduced a lot, but Sharpe would still be about the same. We just don’t do this, because our goal is to invest as much of our capital in Nasdaq100 stocks. We don’t want to be invested with most of the capital in Treasurys
Yes, I know. But I was thinking of “straight” replacement TLT for TMF. I wonder what would be the result in different time horizons. Short term volatility would be higher, that’s for sure. But long term the result may be very similar, since in the end performance of TLT is pretty much the same as TMF and in some (quite common) cases even better.
So, I’m just loud thinking: let’s assume there’re perfect -1 correlation between TLT and stocks, and all this is long term thinking (not days/weeks)
1. If stocks go down, TLT goes up and TMF goes (longterm) even more up (but not 3 times)
2. If stocks are flat, TLT is flat or slightly up and TMF is slightly down
3. If stocks go up, TLT goes down (but not much), and TMF goes even more down (but not 3 times).
The question I have in my mind is like: While I understand that the role of TMF is to “calm down” the strategy and reduce volatility, maybe it is reducing upward volatility more than reducing downward volatility (which is our goal to be honest)? In long term if there’s bear market on stocks (I’m assuming fixed % of allocation which may be not the case), TMF will do just slightly better than TLT and will not save us. But in bull market the TMF will eat much more profit then TLT…
The long term performance of our hedge is not really important. It would if we would have a fixed allocation, but here we rebalance monthly and the allocation changed between 0% and 30% the last 10 years. Important is to have a strong hedge which does its job when markets become volatile and dangerous. 30% of TMF is like 90% TLT. Sure TMF is not so good for long time investments, but for short periods it is even better than 3x the amount of TLT. In a market where TLT spikes up, TMF is doing more than 3x the performance of TLT. For the market correction period of July 25 to Sept 22 2011, TLT went up 30% and TMF 110% which is 20% more than 3xTLT. This is because TMF always does 3x the daily performance of TLT.
If you really want to avoid the rebalancing losses of TMF, then you can short TMV. This is basically the same as holding TMF and in sideways markets you earn about 10% of rebalancing gains per year.
Frank, I’m a neophyte with sector rotation strategies. I downloaded the US sector rotation strategy and had one concern— investing in the 3x ERY (short energy ETF) makes me nervous after reading the warnings about the risks in these leveraged ETFs, such as “appropriate for day trading only; Not meant to be held overnight”. Whatcha think? I tend to be a relatively conservative investor. Thanks. Gary
In our case we do not leverage by using this 3x leveraged ETF. If we go short the energy sector for example with 30% of our funds, then we can do this by shorting the normal XLE ETF or by buying 10% of the 3x leveraged ERY and keeping the resting 20% in cash.
In fact this is even safer than shorting XLE because so your maximum risk is to lose the 10% versus the 30% for a normal investment.