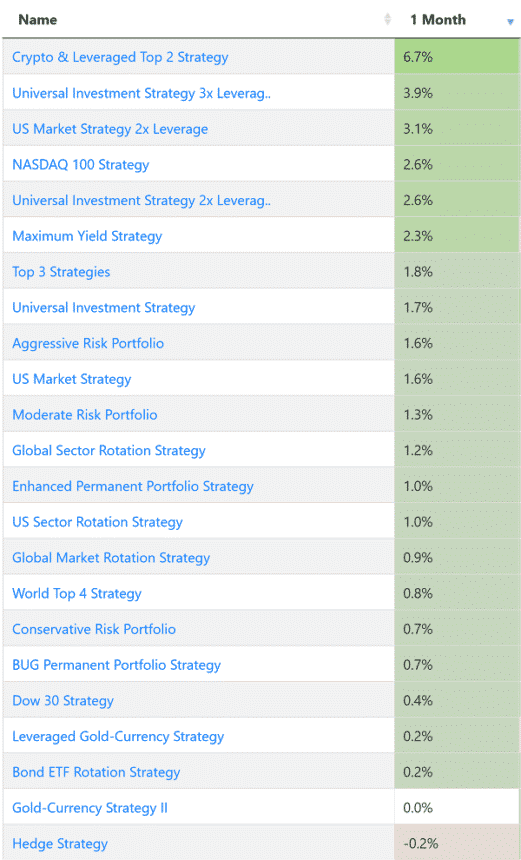
All strategies in the Green
For August all our strategies had positive with returns from +0.2% to +6.7%. Our recent crypto strategy was the top performer followed by the 3x UIS strategy with a 3.2% return.
Outlook
Here three different long term weekly charts of three different indices.
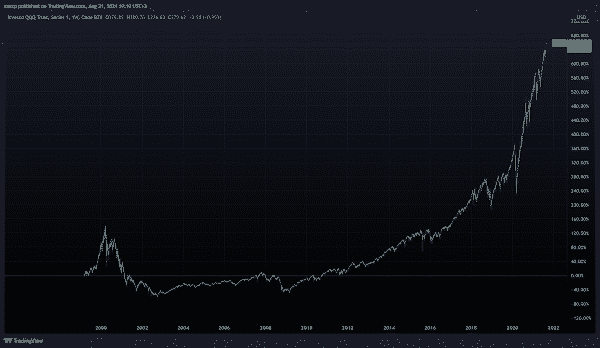
The above looks like a cryptocurrency chart but it is not. It is the QQQ ETF going back to 2000 and includes the 2001-2003 Nasdaq bear market. Looking back, those losses seem trivial but at the time they were anything but. We are currently sitting at a new high that seem to be part of a parabolic move.
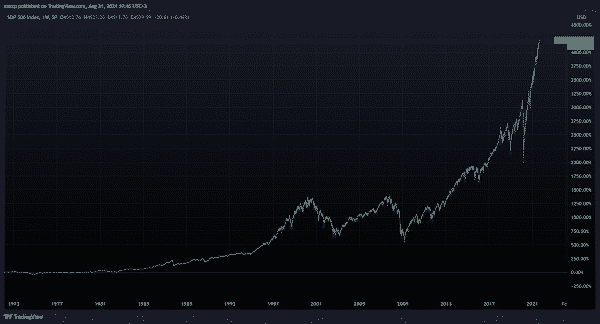
A similar chart for the SP500. The two large bull/bear markets of 1999/2001 and 2006/2009 seem like two medium sized moves creating a comfortable “M” compared to were we are today. Anyone that lived or traded through that second leg of the “M” (the 2008 housing crisis) understands the real-life impact of that move both in economic terms as well as on society. Looking at where we are today, it does beg the question on how far up stock prices can go.
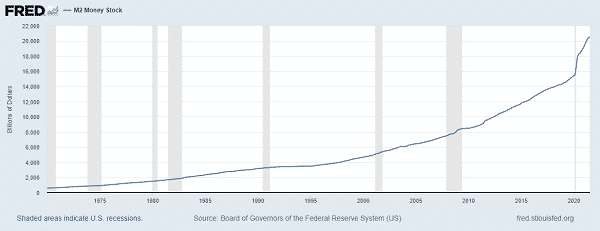
Both charts above can be explained, in part, by the following chart, which is M2 monetary supply. M2 has grown since the 1970’s but you will notice that just this past year it has increased exponentially in an effort to avoid a COVID induced recession.
What about Treasuries? Many think that their 40-year bull run has ended and that they will underperform going forward, mainly due to inflation. Below is the chart of the yield of a 30-year Treasury, starting in the ’80s.
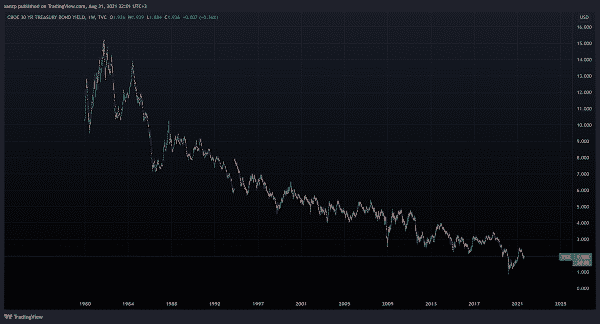
This chart is the inverse of the price of the corresponding ETF that we use to hedge our portfolios, namely TLT. In other words, if TLT had data going back to the 80’s it would have been on a constant bull market since then. Current yields are close to1% so for this multi-decade bull market to continue yields would have to continue downwards, which would be below zero. As we have learned recently, nothing is impossible and negative yields already exist in Europe.
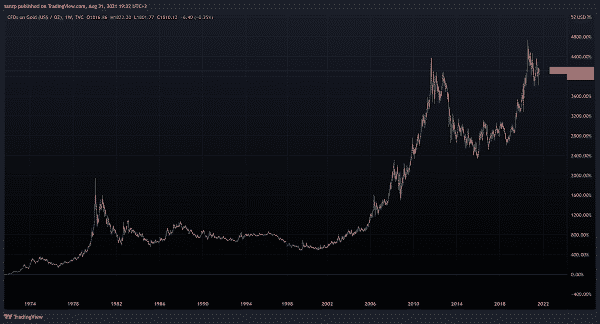
The fourth chart represents the historical price of gold. It’s anyone’s guess how this chart will continue on (i.e., create a second correction down or break out into new highs?) but a viable question is whether it tracks inflation and what is the relation to the large increase in M2 money supply?
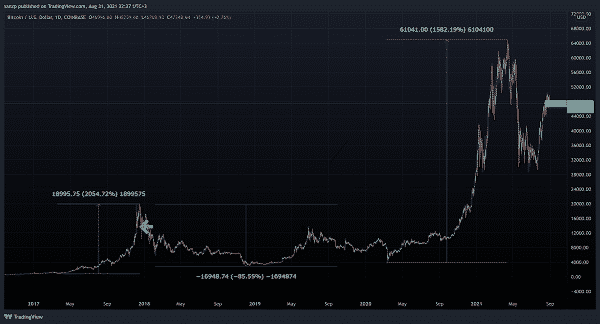
Last but not least is the chart of Bitcoin which is the largest crypto-currency, i.e. the “new money”.
The obvious question is why am I showing these charts/ What’s my point?
My point is that we are in uncharted territory. The S&P 500 is yet again at new all time highs and no-one can tell if a multi-year correction is coming or if this move will continue on for years to come. Gold seems to have stooped working as an inflation hedge and has it lost it’s place to crypto which seems to benefit from any fiat debasement (i.e. printing more money).
Despite the sense that equity prices are very high and will correct, there is an argument for a continued bull market even at these high prices.
Is the fight against climate change the new ‘World War’?
Wars kill and devastate people. They are however beneficial to markets as new money is printed to finance it, to build infrastructure and create whole new industries. They also create inflation which, in the begging at least, is beneficial to equity markets.
Are we at war against climate change?
It seems that we have finally consensus amongst the powers-to-be that global warming needs to be addressed and financed. The new report by the The Intergovernmental Panel on Climate Change (IPCC, a United Nations body) has been welcomed and quoted by mainstream media as well as major financial centres. It rings the bell of doom for our children and grandchildren unless action is taken soon to reverse carbon emissions.
The UN Secretary-General António Guterres said the Working Group’s report was nothing less than “a code red for humanity. The alarm bells are deafening, and the evidence is irrefutable”.
Today in Europe for each old index ETF there is a new “Green” or “Socially Responsible” or “Zero Target Emission” fund that will slowly replace it. New money will only come towards these funds and they will outperform their old versions. Financial Management companies are pushing these hard as the net-zero-asset-managers initiative is backed by the likes of HSBC, Fidelity, Blackrock, etc. This shift will force companies to comply with sustainability guidelines or face the risk of being excluded by the new major environment-friendly indexes.
The shift towards a sustainable future will need to be financed by investors as well as governments. That is how a continued bull market in equities could be sustained.
Conclusion
As usual, the conclusion is that we just don’t know. Historically being in the market has been far better than being in cash. But you need a plan, a way to protect yourself from large losses in case a prolonged bear market is around the corner.
One way is to follow a strategy, a set of rules. You may sacrifice some of the performance in a bull market but you gain some protection from the 40%+ drawdowns that even a well-diversified index like the SP500 can suffer.
Please join the forum and discuss the recent changes in the markets, our portfolios and LI strategies.
The Logical-Invest team.
The first two charts do not show the real picture. Long term charts should be view as logarithmic charts to see the actual severity of the drawdown during the dotcom bust.
It will also be great if you can post the pictures with links to hi-res pictures.
Here you go: https://www.tradingview.com/x/vyZNOkWB/
Thanks fro the feedback Nick. Very true. Log scale is better.
Links to hi res:
https://logical-invest.com/wp-content/uploads/2021/09/QQQ_2021-08-31_19-19-35.png
https://logical-invest.com/wp-content/uploads/2021/09/TYX_2021-08-31_22-01-51.png
https://logical-invest.com/wp-content/uploads/2021/09/GOLD_2021-08-31_19-22-51.png
https://logical-invest.com/wp-content/uploads/2021/09/QQQ_2021-08-31_19-19-35.png