First priority – Keep yourself and your family safe
We would like to express our sympathy and support to all the families affected by the coronavirus. We wish everyone good health as it is our most valuable asset.
Second priority – Keep your portfolios safe
a. The Strategies
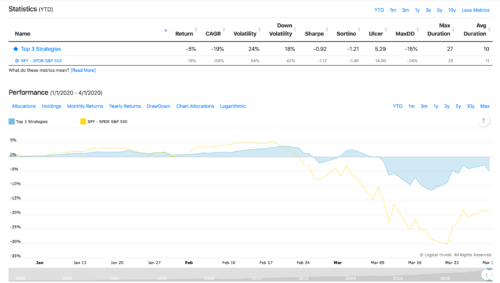
Below are the performances of our strategies and benchmark ETFs since the start of the year. March felt like a never ending roller coaster ride, both in and out of the markets.

The table above does not do justice to the mid-month liquidity crisis as equities, gold and bonds took a severe beating. By the end of the month, all strategies outperformed the SP 500 while most managed to keep loses below 12% YTD.
A notable exception was the Bond rotation Strategy which a had a larger than normal impact. It is discussed later in this article.
b. The Portfolios
Although our whole philosophy is based on multi-strategy Portfolios, we usually do not discuss the portfolios themselves as each subscriber can create their own. We will review some popular pre-made choices that we ourselves and our subscribers use:
The top 3 Strategy and Portfolio: -5% vs -18% (SP500) Year-to-date
The strategy (MST3) picks the best risk-adjusted performers and allocates 1/3 of capital to each. It is a dynamic portfolio that runs on our proprietary QuantTrader software and has the capability of picking different strategies each month based on our custom risk/return criteria.
As you can see below, the portfolio managed to protect capital with -5% YTD, including a -2.9% loss for March.
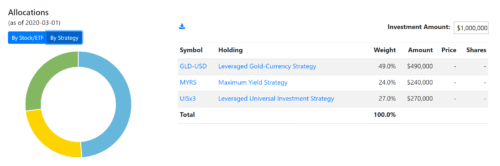
Below are the MST3 March allocations by strategy.
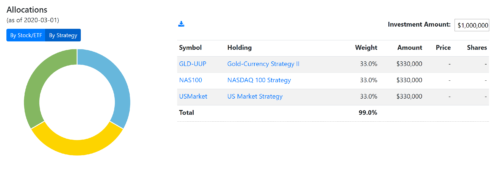
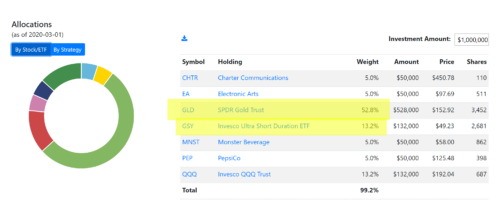
The MST3 March allocations by ETF/stock. You can see the fairly large allocation to gold (52% GLD) and a 13.2% allocation to GSY which behaves almost like cash. That’s a 65% allocation to safe haven assets.
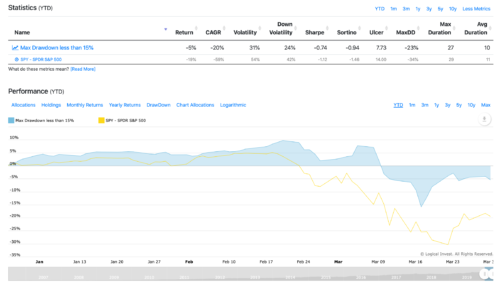
2. The DD15 Portfolio: -5% vs -18% (SP500) Year-to-date
The “Max Drawdown less than 15%” portfolio has been optimized for achieving the highest possible return given a maximum historical Drawdown. This does not mean it will achieve that maximum drawdown going forward. It just instructs the algorithm to find portfolio solutions that have limited risk.*
*You can create your own portfolio of LI strategies by putting your own parameters using our portfolio builder tool.
The portfolio suffered a higher loss for March at -7.2%. Because it did well during January (+4.3%), it brings the year to date performance at -5%.
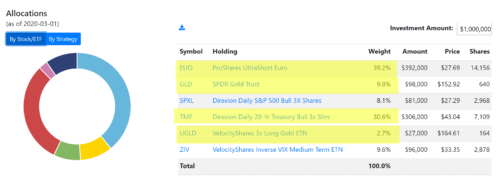
DD15 March allocations by strategy.
DD15 March allocations by ETF/stock. A interesting (to say the least) mix using 30% Leveraged Treasuries (TMF), 39% Short Euro, 10% gold + 2.7% leveraged gold and almost 10% ZIV.
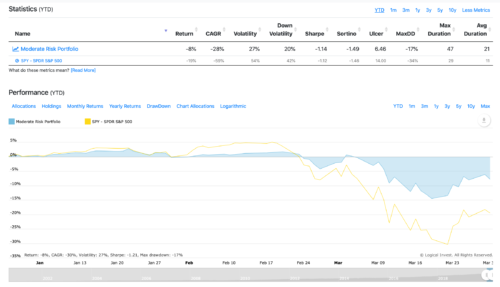
3. The Moderate Core Portfolio: -8% vs -18% (SP500) Year-to-date
Our moderate Core portfolio is an ‘all-around’ choice. It managed a -8% loss.
Moderate CORE allocations to strategies for March.
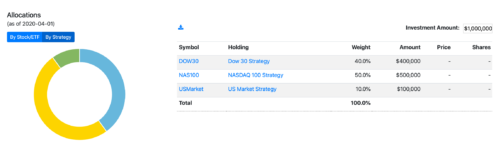
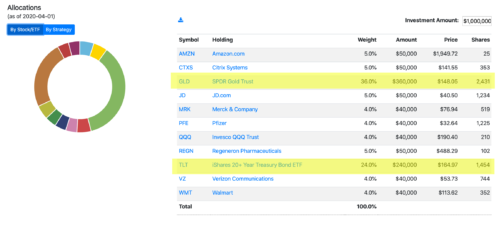
Moderate CORE allocations to ETFs and stocks with large allocations to gold (36% GLD) and Treasuries (24% TLT).
The above were March allocations. Please sign In to you Logical-Invest account or QuantTrader software get the latest allocations for April.
The markets
These are unprecedented times. What used to be the domain of 70’s sci-fi movies is suddenly a reality.
In parts of Europe, major cities seem deserted. Shops, cafes, restaurants are locked. Tourists are extinct. Metro stations are empty. Whole countries are putting their social and economic lives into a self-induced comma.
If no such social measures were taken, the market reaction to the epidemic would be categorized under ‘natural disaster’, alas, exacerbated by lack of liquidity. History shows that markets quickly recover from these type of shocks, sometimes stronger than before.
But in this case, whole economies are forced to a standstill. As Ben Bernanke put it in a recent interview, the 2008 crisis originated from the financial system and spread out to the real economy. Now it is the other way around. It is the virus that is forcing business to go in hiatus and it is the real economy that is affecting the banks and the financial system.
Looking over to the U.S., we see rising numbers of COVID-19 infected cases. That makes us worry that we may not have seen the worst of it yet.
Two trillion and counting
On the positive side, the Fed as well as many central banks and governments around the world are stepping up with massive liquidity for the financial system and support for businesses. The move has already helped Treasury and corporate bond markets recover as well as create a corrective rally in equities.
From an economic point of view the current situation seems more like going to war than reacting to a natural disaster. Business as usual is interrupted, industries will have to reorganise themselves around new structural changes (remote employment, new green energy principals), unemployment could reach 30% percent and the government is monetising debt to the tune of trillions of dollars.
It’s the Bonds
A 20% even 30% correction in the equity markets is something we have seen before. It is to be expected and one can dampen the fall by hedging their portfolios with bonds, gold, options or just plain cash.
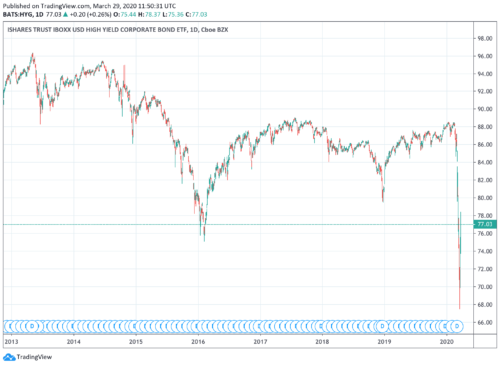
During this crash the difference was the panic (initiated by margin calls) that resulted in large bond selloffs. Here are some charts of major bond ETFs:
We will start with TLT, the 30-Year Treasury ETF:

TLT had a massive run up during the beginning of the crash but then sold off creating a 22% drawdown, which is massive considering Treasuries are held by the trillions around the world as safe assets.
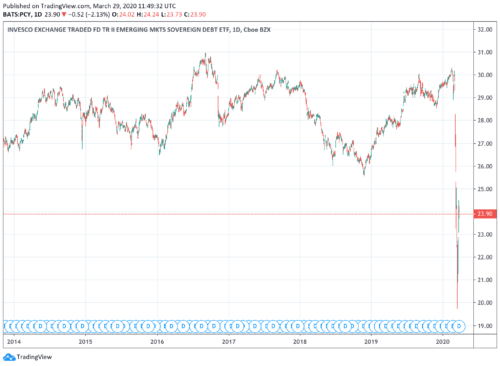
PCY (below) is an ETF that tracks liquid emerging markets, dollar-denominated government bonds. Look at the magnitude of the move compared to daily movements since 2014. It almost looks like a mistake in the data.
A closer look:
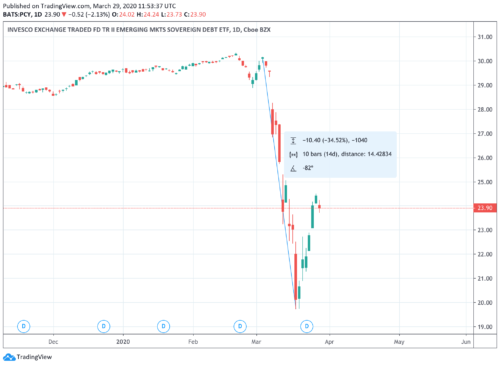
That is a 34% drawdown in diversified E.M. Government bonds in the course of a few days.
We saw similar movements in AGG, CWB (convertible bonds) , IBDN (Int’s Corporate) and last but not least in GLD.
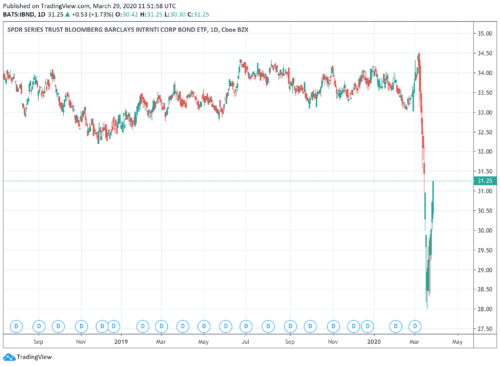
Gold also went on sale.
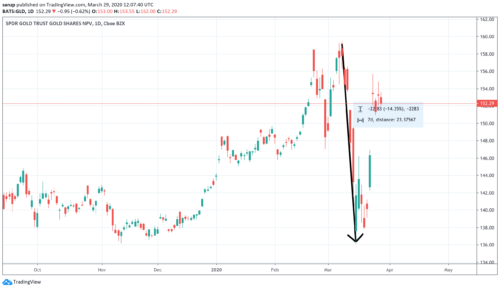
These exaggerated selloffs have been in part corrected. At their peak, they managed to create large dents in traditionally conservative bond portfolios.
Our Bond Rotation Strategy had such a large drawdown due to being invested in convertible bonds (CWB) and Emerging market goverment Bonds (PCY). BRS is one of our oldest strategies and was never adapted to include our HEDGE sub-strategy since BRS only picks bonds to begin with. We assume that if markets return to a normal state, miss-pricing, especially in PCY, may be corrected. Nevertheless we are reviewing the logic of BRS and how it may need to be adapted for a new type of environment.
For now, we recommend using our Enhanced Permanent Portfolio strategy instead.
No disuption to our service: Logical Invest always worked via remote collaboration
As you many of you know, Logical Invest is run by four partners collaborating from different parts of the world. We are all investors who are actively trading and managing our own assets. We have been working remotely since 2014 and found solace in partnering up and discussing our investment outlook while sharing and developing strategies.
As we all spend more time at home, we encourage you to join the forum and discuss the recent changes both in the markets and in our own social lives.