Double digit returns
2024 proved to be another successful year for LI investors. Join us.

Top Performer: The Universal Investment Strategy 3x Leverage was the top performer, reaching an solid 38.6% return. This leveraged version of the core Universal Investment Strategy is an intelligent equity/bond/gold portfolio that adapts to market conditions.
Consistent Volatility Harvesting: The Maximum Yield Strategy, renowned for its consistent performance in the volatility market, secured a 25.6% return. This on top of last year’s 43% return.
Thriving in a Shifting Market: The Leveraged Gold-Currency Strategy, capitalizing on the inverse correlation between gold and the U.S. dollar, delivered a remarkable 27.3% return. This strategy dynamically switches between leveraged positions in gold and other currencies.
Risk-Adjusted Success: The popular NASDAQ 100 Strategy achieved an 15.9% return with a low drawdown of -9.9%. This strategy allows investors to participate in the growth of the Nasdaq 100 Index while implementing protective measures against market downturns.
Reliable and Steady: The Top 3 Strategies, a diversified approach allocating equally to the three best-performing core strategies, yielded a solid 15.1% return. This strategy aims to provide consistent returns by diversifying across various asset classes and investment approaches.
Average Performance: Across all strategies, the average year-to-date return stood at an impressive 15.2%.
These results highlight the efficacy of LI’s systematic, rules-based strategies, which prioritize risk management and consistent profitability.
Investing in 2025
- As we enter 2025, several key questions arise:
- Will the stock market correct after two years of 20%+ returns? Could we be buying at the top?
- Will gold’s extraordinary rise continue? Or has it peaked, setting the stage for a sideways or multi-year decline?
- Can U.S. equities maintain their dominance? Or will emerging markets finally begin to close the gap?
- What’s next for the dollar? The U.S. dollar is at a critical juncture against major currencies like the Euro, Australian dollar, and Yen. How strong can it get before impacting exports and global trade?
- Will short-term rate cuts and rising long-term rates signal a return to normalcy? With the yield curve trending back to normal, are we truly out of recession danger?
- Bitcoin at $100,000—what’s next? Will we see another brutal -50% correction, or could Bitcoin soar toward $400,000?
Here is a chart of yearly returns for the SPY since 1993
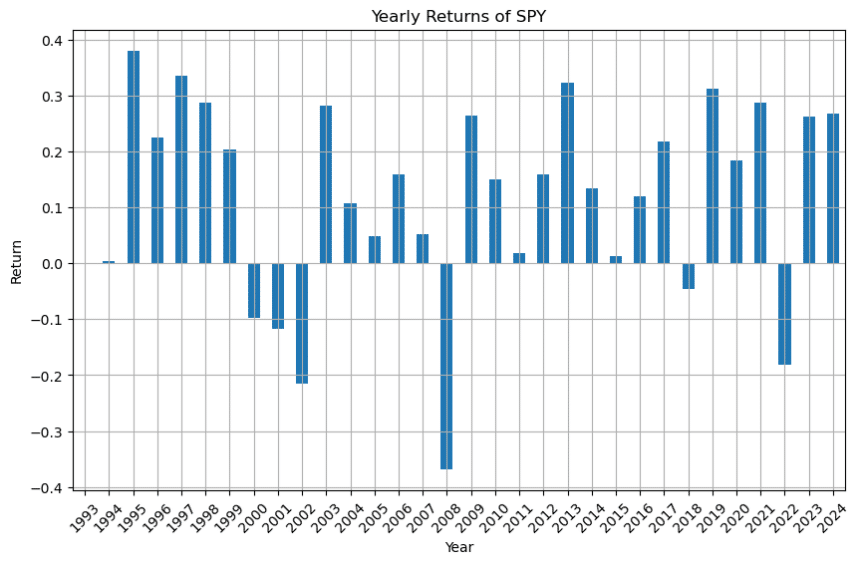
Looking at yearly returns for the SPY since 1993, we observe that having more than two consecutive winning years isn’t uncommon. The chart clearly shows that market participation is beneficial, as most years are positive. However, it’s crucial to note that a significant negative year may require multiple positive years to recover losses. Remember: after a 50% loss, you need a 100% gain to break even. This underscores the importance of maintaining market exposure while employing hedging strategies to limit losses.
Seasonal Patterns
Examining seasonal patterns by decade since 1993 provides interesting insights, though the dataset is limited in statistical significance. The chart shows average returns for years ending in each digit (0-9).
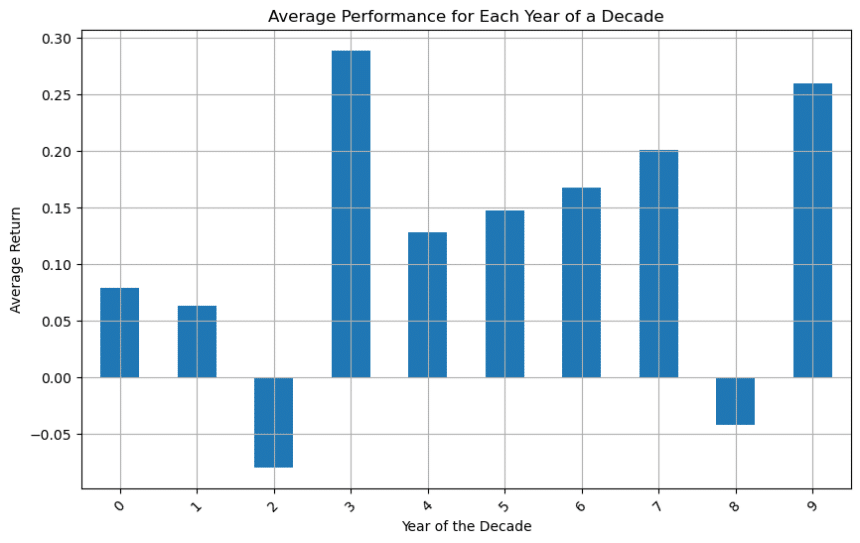
As we enter 2025, historical patterns suggest the possibility of one or even two more positive years before a correction.
However, we must consider two important factors that could influence market performance:
First, 2025 marks the beginning of the traditionally weaker phase in the Presidential Election Cycle. This theory suggests that the first two years of a presidential term typically show lower returns compared to the final two years.
Second, the European Central Bank (ECB) has issued a significant warning about AI-related market concentration:
“This concentration among a few large firms raises concerns over the possibility of an AI-related asset price bubble,” the ECB said. “Also, in a context of deeply integrated global equity markets, it points to the risk of adverse global spillovers, should earnings expectations for these firms be disappointed.”
Gold Markets
Gold is currently experiencing a minor correction from recent all-time highs. Its long-term bullish trend may depend on its effectiveness as an inflation hedge.
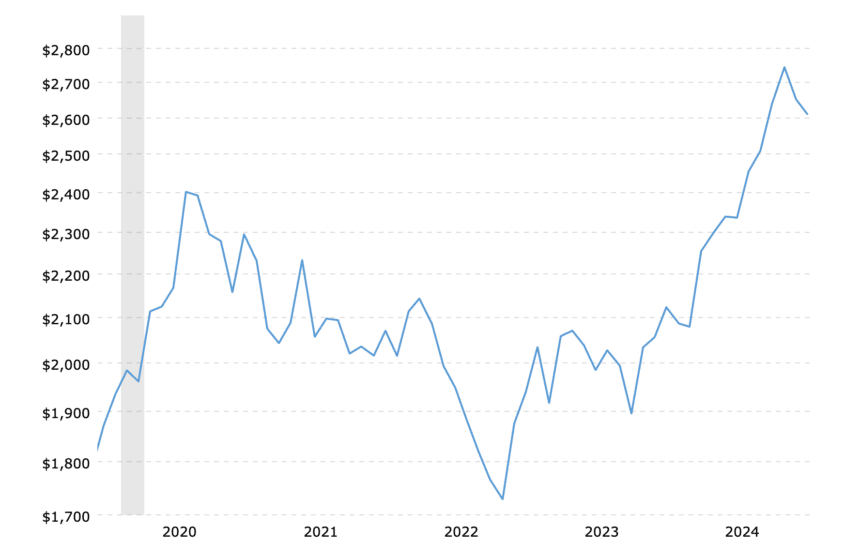
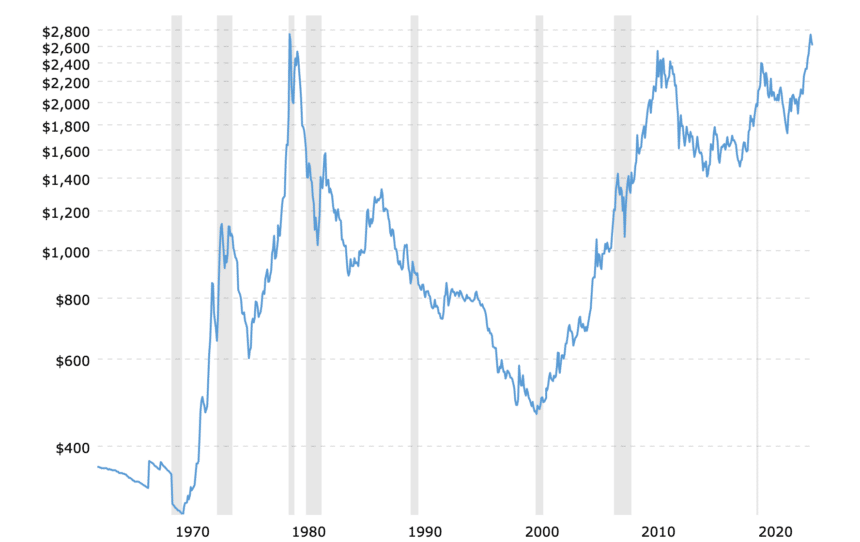
If inflation remains elevated and gold maintains its inflation-hedging properties the outlook remains positive.
Regardless of direction, gold will remain a crucial asset class given global geopolitical changes, inflation concerns, and potential currency crises.
U.S. vs. Emerging Markets
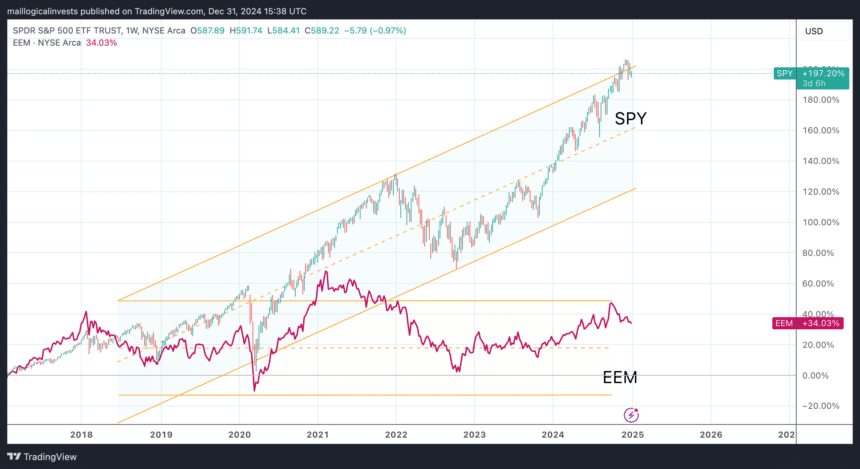
Since 2020 the SP 500 has performed better than almost all other country indexes and especially the Emerging market index (ETF: EEM). This is not a given. In the pre-crisis bull market of 2003-2007, the growth came mostly from emerging equity markets as they had more room to develop compared to already ‘mature’ economies. It seems that at this stage of growth, U.S. companies have outperformed even less developed, growth oriented economies like Latin America, Asia, India, Korea, etc. The reason is probably the technology edge of the U.S. when it comes to the high tech and AI related investments (Nvidia, Google, Tesla, etc).
The question remains whether these companies (and the U.S. equity markets they influence) will maintain their significant advantage or if non-U.S. entities will be able—and permitted—to compete in the AI-related arms race.
Dollar Strength
Which brings us to the question of the dollar. One of the reasons that the U.S. equity markets have done so well is that the U.S. dollar has outperformed other major currencies like the Euro, the JPY and the Australian dollar.
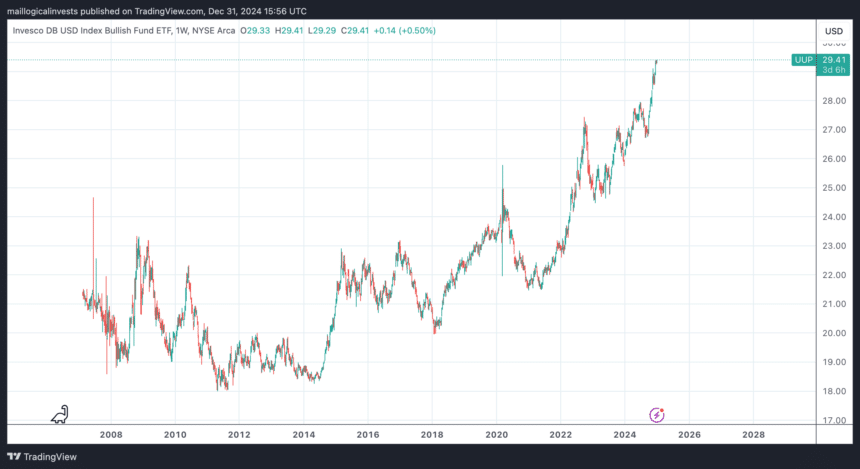
The UUP ETF above, tracks the performance of the U.S. dollar relative to a basket of major world currencies. It sits at multi-year highs. A more familiar chart may be the Euro/USD.
A strong dollar typically reduces U.S. exports and is generally considered a negative factor for the domestic economy. However, as the world’s current reserve currency, dollar strength—driven in this case by higher interest rates compared to the euro and other major currencies—signals increased confidence in Treasury markets. This is a positive for the U.S., especially amid a potential Russia/China-led BRICS movement challenging the dollar’s dominance. The dollar’s trajectory will be interesting to observe in the coming years under the new Trump administration. Recent uncertainty surrounding the dollar’s status has benefited not other currencies, but rather assets like gold and Bitcoin.
Rates
A lot of times we look at the Treasury yield curve to infer about a possible coming recession. In reality we are looking at the relationship between short term rates and long term rates. So when short term rates are higher, something feels wrong. In a ‘normal’ environment someone should get a higher rate for locking up their savings for 30 years than locking them up for just 1 month. So an ‘inverted curve’ may point to a coming recession.
Let’s examine another graph below: the difference between 10-year and 2-year Treasury rates. Typically, 10-year rates are higher than 2-year rates. However, this relationship can reverse, causing the graph to fall below zero. If we observe the graph closely, we notice that recessions (represented by the grey vertical areas in the chart) occur after the graph (10Y-2Y) falls below zero and subsequently rises back significantly above zero.
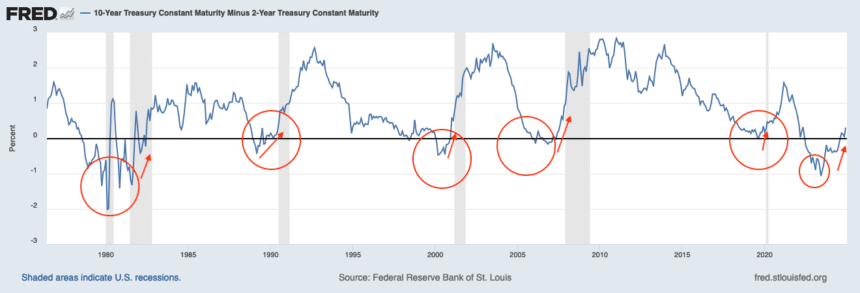
Surprisingly we are currently in such a scenario. The line has been below zero for some time and it is now crossing up. Are heading into a recession? Something to consider…
Bitcoin
Last but not least: Bitcoin. It finally broke $100,000.
Back in 2017, when we began tracking Bitcoin as an asset class, a $100,000 target seemed outlandish to many and was dismissed as unrealistic. As Bitcoin surged from $3,000 to $19,000, that milestone started to feel within reach.
However, just as hope was building, the price plummeted to $4,000 and lingered there for over three years. When Bitcoin eventually climbed to $60,000, $100,000 once again appeared achievable—only for the price to crash back down to $14,000, requiring another three years to recover. Now, having finally reached the $100,000 mark, the question is: what comes next?
Stay in the Market – Follow a strategy
We do not provide answers on what to do. We have created strategies and portfolios for that reason. These tools enable you to participate in the markets while maintaining protection and minimizing emotional decision-making. Start with a free trial.
We’d love to hear your thoughts in our forum!
The Logical-Invest team.