Starting January 1 2020, we are implementing several modifications to our strategies to make them less volatile and more stable.
The biggest modification concerns the Hedge strategy. As this sub-strategy is a major part of all of our ‘hedged’ strategies, any change in this sub-strategy automatically affects the strategies themselves.
We are also implementing a new limit for allocations between hedge and equity. The equity/hedge allocations will now range from 40%-60%, which makes sure our strategies are always hedged. This is due to lessons learned in the January 2018 crash, where market conditions deteriorated within two days from an extremely positive and low volatility market to the complete opposite. Most strategies carried maximum equity exposure at that moment and there was just not enough time for them to adapt to a more hedged allocation.
These two changes combined with some minor strategy adjustments will make the strategies safer and more stable going forward into the next year. We feel that such precautions are important, as most investors made good profits over the last 10 years and should now strive to protect most of these profits during the next bigger market correction. At the moment, markets are still near top levels and many investors are 100% invested in equity. Looking at historical charts, one can see how dangerous this is: Just one year ago the S&P dropped 19% within only two months.
The hedging strategy modifications
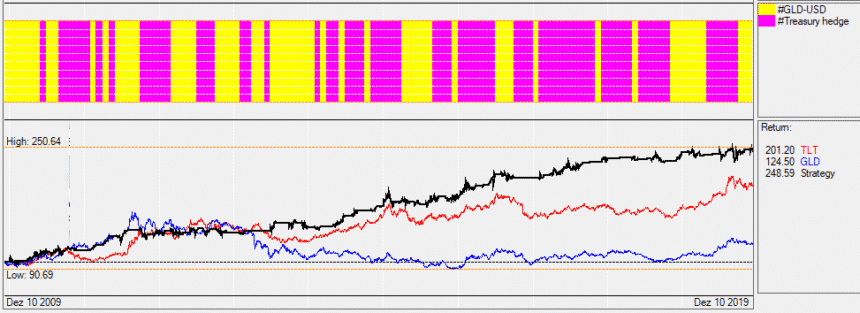
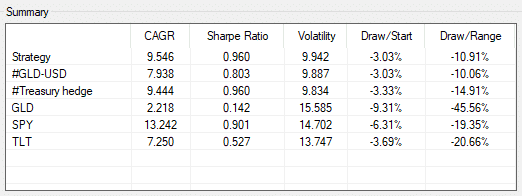
The hedging strategy invests in “safe haven assets” which are Gold (GLD), long duration Treasuries (TLT), inflation protected Treasuries (TIP) and short duration Treasury notes (GSY) which behave similar to a cash position. The strategy switches between these four assets. So far, the hedging strategy did what it was supposed to do as well as outperformed any of these four single components. In the charts below you see the strategy switching between the two Treasury (pink) and Gold (yellow) sub-strategies.
Old hedging strategy performance and allocations
The new hedging strategy
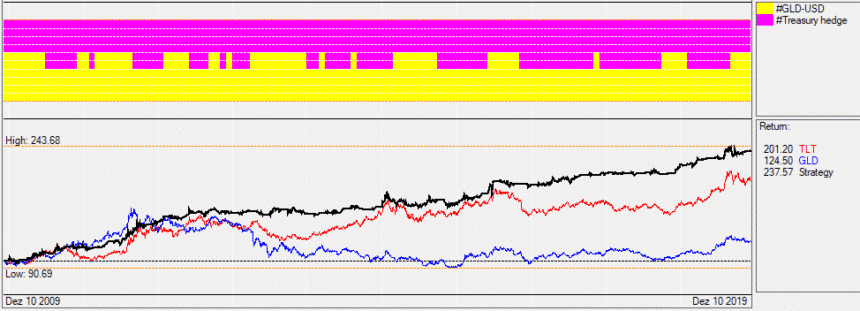
For the new strategy we do not switch 100% between Gold and Treasuries anymore, but we rather allocate 60%-40% between Treasuries and Gold. Only the short duration Treasury (GSY) can reach a 100% allocation.
In the chart below you see that this reduces the number of ‘on/off’ switches between Gold and Treasuries which reduces trading costs as well as the volatility of the strategy.
As the hedge can represent a big part (40%-60%) of your portfolio, it is important that this hedge also has low volatility and thus lower risk.
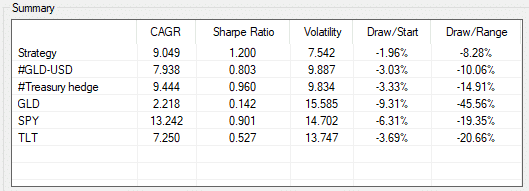
With the new hedge, you will end up being invested in two safe haven ETFs instead of only one ETF for the old strategy. The backtested 10-year performance is about the same as for the old strategy but due to the lower volatility the strategy has a higher Sharpe ratio.
New hedging strategy performance and allocations 10-year performance chart backtest
In fact, cautious investors can also use the Hedging strategy as a strategy in it’s own right to invest their money. This way they are protected against market corrections and can re-enter the stock market if and when a bigger market correction occurs, at a much lower price rather than now at the highest price ever.
Single strategy changes:
The Bond Rotation Strategy:
We did not make any changes to the BRS strategy. This strategy has worked well for a few years now. Sure, it did not return as much (9.8%) as a pure S&P 500 investment (13.6%), however, if you check the 5-year chart below, then you see that it did much better during all of the previous market corrections.
The Bond rotation 5-year performance chart backtest

Performance
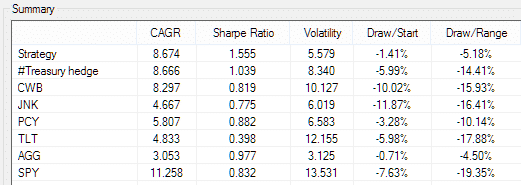
The BUG strategy:
We increased the volatility attenuator from 3.5 to 10 for this strategy. This means that it now becomes a minimum variance strategy where the allocation that results in the lowest portfolio volatility is chosen. This also means, that much like the bond strategy (BRS) this is a very safe strategy but with the advantage that it can invest in the stock market (S&P 500).
The Bug 10-year performance chart backtest

New performance

Old performance
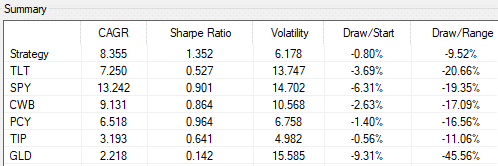
The Nasdaq 100 strategy
The old Nasdaq 100 strategy had an incredible performance until about 18 months ago. The last 18 months the strategy did not do as well because the markets became volatile experiencing large intermediate market corrections. The new strategy reduces volatility/risk from 24 to 15.
Due to the Hedge and the possibility to switch to lower volatility Nasdaq stocks, the strategy has about a 40% lower risk. The old strategy did return more during the best Nasdaq 100 years because it could invest up to 80% in the Nasdaq equity strategy. The new strategy however is more cautious with a maximum of 60% invested in Nasdaq equity. Over 5 years the return of the new strategy is lower than the old one, but it performed much better during the last 2-3 years.
We also updated the Nasdaq 100 companies to the latest official composition. Here we only did a 3 year backtest as Nasdaq components keep changing.
The Nasdaq 100 top 4 strategy 3 year performance backtest

New performance

Old performance

The DOW 30 strategy top 4 company strategy
Probably the biggest changes have been made to the DOW 30 strategy. The goal was to make this strategy considerably safer. One way to do this was the new 60%-40% allocation limits between equity and hedge. The other modification was to have two Dow 30 sub-strategies. One normal strategy like before and one low volatility strategy. The DOW balanced sub-strategy can switch between these two strategies depending on market volatility. These changes should result in a more stable and safe strategy.
Here is a backtested 5-year performance chart of the strategy

New performance

Old performance

Even if the chart looks stable, we have to point out that a strategy which selects 4 companies out of 30 still has the risk that something unforeseeable can happen to one of the companies. This happened this year when the strategy was invested in Boeing and an airplane crash, caused by software problems, made the stock dive 20% within days.
The Global Market Rotation Strategy
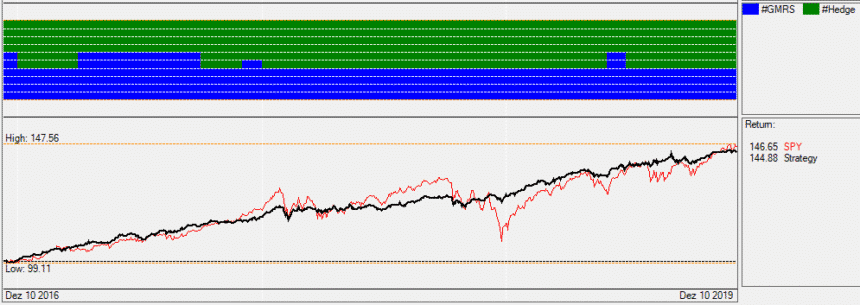
The GMR strategy is the oldest Logical-Invest and probably my favorite strategy as it invests only in large global and liquid index ETF. Here the change from 70%-30% to now 60%-40% allocations between equity and hedge lowers volatility but still generates a very steady and stable performance.
If we compare the 10-year performance then we do not see much of a difference between the old and the new strategy. However, in volatile markets, the new strategy is slightly more stable because it is always at least 40% hedged.
Here is a 3-year chart showing how effectively the strategy irons out market corrections.
New performance

Old performance

The return is about the same as the return of a 100% S&P 500 strategy, but risk is less than half.
The Global Sector Rotation Strategy
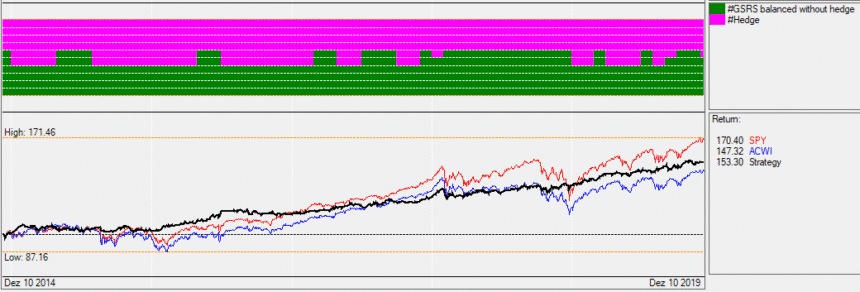
Here the change from 70%-30% to the new 60%-40% allocations lowers volatility but still generates a very steady and stable performance. We also made both equity sub-strategies more stable. This way the strategy did manage much better the drawdowns of the last two years. All together this strategy should be able to fight against any sort of market trouble as it can invest in very safe and stable industry sectors and on top of this has a good hedge.
Here is a 5-year chart showing how the strategy behaves during market corrections.
New performance

Old performance

The Permanent Portfolio Strategy
We did not change anything to the Permanent Portfolio Strategy. The strategy does what it is supposed to do. It delivers quite good returns at less than half the risk of a pure S&P 500 equity investment. This strategy can be well executed also using Futures ES for SPY, ZB for TLT and GC for GOLD. Alternatively, you can also execute this strategy by writing Options on these Futures. Make sure you go far out (about 6 months) and you limit the risk using bull-spreads for ES options.
Here is a backtested 5-year performance chart of the strategy

New performance

Old performance

The 3x leveraged Universal Investment Strategy
This strategy is the performance champion of 2019. At the time I write this document we are about 88% up. Similar to the changes in our hedging strategy we now allow this strategy to be hedged by Gold and Treasuries at the same time. This way we don’t have these abrupt switches between Gold and Treasuries which lowers volatility and trading cost. In fact, this strategy is evolving to a 3x leveraged Permanent Portfolio Strategy. The performance of this strategy is more or less the same as for the old strategy, but with smaller drawdowns and lower volatility.
Here is the new backtested 5-year performance chart of the strategy

And this was the old 5-year performance chart of the strategy

New performance

Old performance

Cautious investors can invest 1/3rd of their money in such a 3x leveraged instead of investing all their money in a “safer” unleveraged strategy. In a “Black Swan” worst case scenario the maximum loss is capped to 1/3 of their money. This makes such an investment in fact very safe.
The Universal Investment Strategy
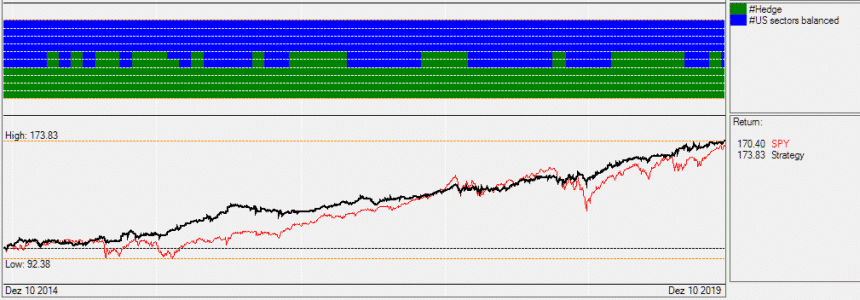
Here the 10-year performance of the new strategy is slightly lower (11.4% versus 12%) but the change from 70%-30% to the 60%-40% allocations between equity and hedge and the new hedging strategy considerably lowers volatility (to 6.4% from 8%). Sharpe ratio increases to 1.75 from 1.5.
Here is the new backtested 5-year performance chart of the strategy
New performance

Old performance

The US Market Strategy
This strategy is very similar to the UIS strategy however instead of just investing in the S&P500 this strategy can invest in a selection of US market indexes which allows the strategy to adapt to the market. Personally I prefer this strategy to the UIS strategy, mainly because one of the US index ETFs is the S&P low volatility index ETF (SPLV) which normally outperforms the other three equity indexes (S&P500, DOW 30, Nasdaq 100) during volatile market periods.
For this strategy we also change from 70%-30% to the 60%-40% allocations and using the new hedging strategy, the Sharpe ratio increases to 2.2 from 1.6.
Here is the new backtested 5-year performance chart of the strategy

New performance

Old performance

The US Sectors Multi Momentum Strategy
This strategy is very similar to the UIS strategy however instead of just investing in the S&P500 this strategy can invest in a selection of US market sectors which allows the strategy to adapt to the market.
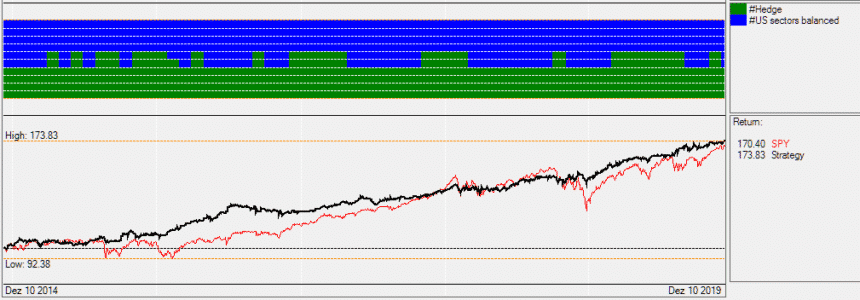
Here we added a new low volatility market sector sub-strategy and together with the change from 70%-30% to now 60%-40% allocations between equity and hedge and the new hedging strategy the Sharpe ratio increases to 1.8 from 1.6.
Here is the new backtested 5-year performance chart of the strategy
New performance

Old performance

The World Country Top 4 Strategy
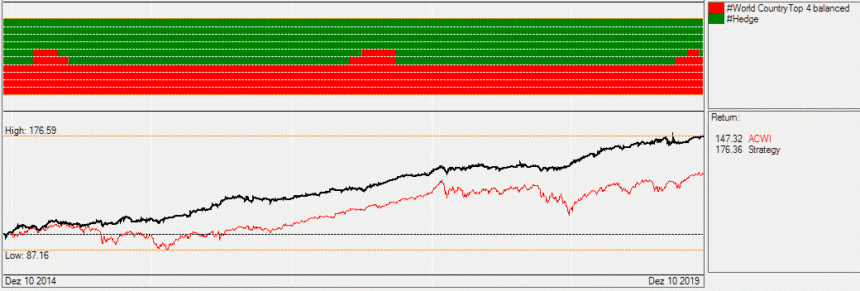
This strategy invests in the top 4 world country index ETFs. New is that we put the 4 equity sub strategies in a separate “World Country Top 4” sub strategy and then we balance this pure equity strategy against our new hedge strategy.
For this strategy we also change from 70%-30% to the 60%-40% allocations and again, using the new hedging strategy, the Sharpe ratio increases to 2.2 from 1.7.
Here is the new backtested 5-year performance chart of the strategy
New performance

Old performance

The Maximum Yield Volatility strategy
This strategy is unchanged. It invests in volatility premium decay and is an interesting alternative for more aggressive investors. The year to date performance is actually at 44%!
Here is the backtested 5-year performance chart of the strategy

Performance

The Gold Strategies
Both currency hedged Gold strategies are unchanged. One strategy uses the US Dollar index ETF UUP as a hedge and the other uses 3x leveraged Euo, Yen and Australian Dollar ETFs as hedge.
Here is the backtested 5-year performance chart of the GLD-UUP strategy

Here is the backtested 5-year performance chart of the GLD- (EUO CROC YCS) strategy

The Strategy of Strategies
This strategy always invests in the top 3 Logical-Invest strategies. One change for this strategy is that the Hedge strategy is now added as an additional strategy. The advantage using this strategy is, that you do not have to select the strategies yourself.
The strategy is one of the best ways to invest your money in a prudent and logic way. In any situation you are well protected against market corrections.
Here is the new backtested 5-year performance chart of the strategy

New performance

We will update the strategies on our web app as of January 1st 2020, that is, the first rebalance day of 2020. This means, until December 31st you will not see any of the mentioned changes in the app. Together with the strategy updates we will also perform the periodic Markowitz optimization to our portfolios, that is, update the allocations of the portfolios to the individual strategies to achieve their stated objectives while satifying the constraints.
Logical-Invest, Dec. 15, 2019
Frank Grossmann
Dear Logical-Invest Team,
Awesome adjustments!
Hope we will have next year another great performance.
Willem
With the high valuation in equities these are very welcome and timely adjustments.
Merry Christmas and a Happy New Year to all.
Brad
Thanks for the update. I was hoping we’d be able to get the rebalance signal just in time to rebalance on the last trading day of the month vs the first day.
There was a huge difference in price the last trading day of November 2019 and the first trading day of December 2019. I watched my entire monthly November profit vanish before I could rebalance this month.
You can download the latest QuantTrader version to see the signals before.
I like the changes thank you,
Also thank you for a great year all my strategies are positive.
As a suggestion would it be possible to post the .ini files for the strategies not listed in QT 520. I spent a couple of hours trying to recreate the Strategies of Strategies model and cannot get the same results. Good results but no where near what you have.
Thank you,
MV
All ini files are in the zip folder of the latest QuantTrader download.
Hi team,
Thanks for the updates.
They do have great historic smoothing of the equity curve and hopefully they will work well in the future. My only concern is that the back testing is somewhat short term, and while they do cover the minor corrections we have had in the past 5 or 10 years none of them cover the Great Recession, which does leave me with some doubt about how successful they will be when the next big one comes. So why do you not also look at how the strategies would have performed during the 2007 to early 2009 period?
As crazy as it sounds I am desperate for another BR to see how the LI strategies perform during that period.
One other minor point on the blog is that the charts and data for the UIS is showing the US Sectors Multi Momentum strategy data and the return tables for the Strategy of strategies has been truncated.
Merry Christmas and here’s to another successful year ahead.
You can be sure that we always look at the 2008 market correction. You can see these charts up to 20 years if you download QuantTrader. I have chosen the 5-10 year timeframe just for the this post
Very good changes, but if I want to apply Max Sharpe Portfolio and get the signal before the first of next month, how can I do?
You can use QuantTrader to get a preview before next month. Just use these allocations to the strategies in the “Consolidated Signals”:
NASDAQ 100 Strategy 30.00%
Leveraged Gold-Currency Strategy 30.00%
Dow 30 Strategy 40.00%
We sent out a detailed instruction by email yesterday.
Hello team,
Thank you for taking the initiative to upgrade the strategies. The changes are for the best. However, I’d like to point out a discrepancy in your post for the Strategy of Strategies. It has a header that reads “Here is the new backtested 5-year performance chart of the strategy”. That header is followed by a chart and performance table of the strategy for a 3-YEAR period rather than 5-YEAR. I spend quite a while trying to figure out why I couldn’t reproduce your results until I noticed that the results I was getting for a 3-year period with QT 520S matched rather closely your “5-year” data. I then noticed that the time scale on the chart of the strategy in your post is for 3 years.
This being said, I am concerned by another discrepancy. I have noticed significant differences when I backtested the Strategy of Strategies with QT 518S and QT 520S using closing data for Dec. 27:
With QT 518S:
With QT 520S:
The strategy has a lower volatility overall in QT 520S, but at the cost of a significantly LOWER return over the 5- and 10-year periods compared to QT 518S, to the point that the Sharpe Ratio is lower over the 10-year period compared to QT 518S. This is quite a price to pay for a reduction in volatility. It is in real contrast with what happens over the 3-year period, for which QT 520S calculates a HIGHER return and lower volatility than QT 518S. The data shown for the strategy in your post reflects only the favorable 3-year period, which is not representative of the behavior of the strategy over the longer time periods with QT 520S.
I noticed that some of the strategy parameters have changed in the new QT (Lookback period 166 days instead of 126, Volatility Attenuator 0.000 instead of 0.500) but these changes do not account for the difference in results between the two QT versions.
I have found the Strategy of Strategies quite rewarding over the last few years but I am quite concerned by its change in character with the new QT 520S. Could you comment? Maybe you could see if you get similar results as I do for the two QT versions at your end? Thank you.
with a bit of table editing by LI :-)
It is very dangerous to optimize a strategy for a 10year period which begins almost at the lowest point after the 2008 crisis. If you would optimize like this then the best would have been to be invested 100% in the stock market. It is better to just look at the last 2 years. Here we had for example the Jan. 2018 draw down which came without any prewarning. To be able to manage such events we reduced the maximum equity exposure to 60% and with a minimum of 40% hedge we are much better prepared for such situations. I don’t think that the next 10 years will give us a similar performance as the last 10 years as now we don’t start after a 50% correction but after a 450% bull market. I think it is far more important that the strategies have been able to keep volatility low in the backtests during the draw-downs of the last two years.
MYRS was removed from the Strategy of Strategies in version 520. That and the changes to the hedge probably account for the longer term differences.
Happy holidays all and thanks for all the work updating the strategy. Question about the performance of UIS and 3xUIS. In theory, the performance of 3xUIS should track roughly close to 3x of the performance of UIS, but the discrepancy will come slippage of the leveraged ETFs – from the daily compounding of the results and interest cost for using the leverage, etc.
If I look at the historical result page (https://logical-invest.com/app/strategy/UIS!, https://logical-invest.com/app/strategy/UISx3!), the results from 2013-2018 make sense and follow the reasoning above: Leverage UIS 3x tracks roughly the 3xUIS strategy performance. However, this relationship broke down in 2019. UIS 2019 YTD performance is 9.5% where 3xUIS YTD performance is 80.1%.
How should we think about this difference? If say one has the risk appetite for the performance profile of 3xUIS, but could only use leverage in her brokeage account instead of investing in leveraged ETFs, in the current environment where the funding cost is rather low, one could theoretically consider leveraging the UIS strategy 3x instead if it yields the desired return profile. That seems to work historically until the end of 2018. I ran the performance comparison between leveraging UIS 3x and 3xUIS in QuantTrader and the backtest results support the arguments above. The performance of the two tracks closely.
Thoughts?
Regards,
Howard
The 3x leveraged ETF can in fact have even a higher leverage than 3 because they multiply the daily performance by 3. So, when Gold went 20% up last year, UGLD was up 75% which is 15% more than 3x.
The unleveraged UIS strategy also uses a more conservative hedge which helps when Treasuries and Gold underperform. It can invest in lower duration treasuries or even go to cash. 2019 with all three asset classes going up a lot, the 3x leveraged strategy had a clear advantage, but such years are rather an exception.
In fact it is less risky to invest only 1/3rd in a 3x leveraged strategy than 100% in an unleveraged strategy because in case of a “black swan” event you can only lose 1/3rd of your money.
Hello,
I’m having hard time recreating the strategy of Strategies. Are these the correct strategies? If not what are the correct ones?
What are the correct strategy parameters for strategy of strategies? I’m using:
Lookback = 68
SA = SRE
ETF= 3
Max Allocation = 100
VA = 2.0
• #BUG
• #DOW 30 hedged
• #GLD-USD
• #GMRS hedged
• #Hedge
• #Nasdaq100 hedged
• #Treasury hedge
• #US Market Strategy hedged
• #US sectors multi momentum strategy
• #World CountryTop 4 balanced
Cheers,
MV
Why do you want to recreate the Strategy of Strategies? If you download the latest QuantTrader version you will have the strategy of strategies included. If you want to see the used substrategies, then you can open the strategy manager and select this strategy.
I have downloaded the latest version of QT 520s. When I go to the drop down menu for Strategy there is nothing called Strategy of Strategy and nothing I can find that resembles it. What am I doing wrong?
Cheers,
MV
Open the menu “setup tools”, then the sub-menu “strategy manager”. Now a new window opens. In the top left corner you can choose the strategy. The first should be “0 LI Strategy of Strategies”. Here you see a equity box which shows you which strategies are used in the “Strategy of Strategies”. You can now add or delete strategies.
Regards Frank
Thanks Frank,
I have 30 strategies of my own they all start with 0 and I never saw the 0 LI Strategy of Strategies.
Thanks,
MV
(a) I thought UISx3 was going to allocate (as of 1 Jan 2020) to both UGLD and TMF (in addition to SPXL? But when I look at the allocations for this month, I see 50% UGLD and 50% SPXL.
(b) When I click the link at the bottom of the strategy page (i.e. the link for “Historical allocations and performance of Leveraged Universal Investment Strategy are available here”, I see 40% SPXL and 60% UGLD. And yesterday or the day before I saw 40% SPXL, 50% UGLD and 10% TMF. Does this matter? Should I worry about the allocations on the historical page?
Thanks,
Ron
No, please use the allocations on the normal strategy page as these are from the latest QuantTrader version with the newest strategy versions. The historical page gets the results from the previous QuantTrader version. The displayed last allocation should not change. I will check this.
I am interested in your statement concerning futures (ES, GC, ZB) as replacements for the ETFs in the Permanent Portfolio. However, after further analysis it appears to be a bit too leveraged for me to use, unless I have got something wrong in my assumptions.
For example in Oct 2018, the ES fell about 215 pts, which equates to a loss of $10,787. However the split between the 3 ETFs was 40%GLD, 50%SPY and 10%TLT, which unless I am missing something would translate into 4 contracts for GC, 5 contracts for ES and one contract for ZB. The net effect of this in Oct 2018 was an overall loss of $48,256!!
I know there are now the micro futures available. So we could replace ES with the Micro E-mini, MES. What would we replace GC with? Mini Gold (YG) or micro gold (MGC)? Unfortunately there does not appear to be a mini or micro equivalent of ZB. Unless you know otherwise?
Have you done any work on using options on the three ETFs (as oppose to options on the futures)? I assume you would pick the same delta value for the three options contracts. But what delta would you recommend, ATM or ITM (d70 or higher)? In terms of number of contracts I assume you would divide your investment amount, say $5K (don’t want this to be too high because some months all three options could expire worthless and you would lose the lot), among the three ETFs, say 40/50/10 split and then divide the option price into these to determine the number of option contracts for each ETF. How many days out would you go (1 month plus monthly expiration date (around 50 days) or 2 months or more)?
I would welcome your comments on this.
I never used these Mini- or Micro Futures, but I am sure they work the same as the GC Future. For Gold you can also buy the London Gold XAUUSD (IB Name).
I like to sell put options (FOPs on ES, ZB and GC) which are at least 6 Months away. You can sell ATM d50 options which minimizes your risk. I personally like to sell d30 options which have a higher premium decay. For ZB FOP normally you have a maximum of 3 months so I sell half of those and buy the other half ZB Futures. If you have high market volatilities, then selling ES put options makes much sense as your premium decay is quite big. You can even sell some more put options and reduce your portfolio $ by selling ES Futures. This way you profit from falling volatility.
If you keep the delta $ under control, then this works similar to long positions. For me it does not work well with shorter durations as delta changes too fast and you need to rebalance nearly daily your allocations.
Very helpful comment indeed. Thank you for that.
If you are using futures instead of ETFs, how you deal with rolling?
You could
1) buy futures contracts 2-3 months ahead to avoid/decrease number of rolling events
2) buy the nearest contract with highest liquidity/lowest spread and do the rolling on particular day
3) try to shift all the portfolio rebalancing to the rolling day – don’t know how would be the impact on the strategy itself.
And a question to the options. If you are writting naked d30 OTM PUT options, you are collecting the decay premium, but if the market recovers inbetween, doesn’t the classical strategy implementation (long ETF) have better returns than collecting the premiums on option writting? Especially when the strategy is in deep drawdown (usually high volatility environment) I am affraid to miss the strategy recover streak.
1) I would buy/sell futures which expire 2-3 months away so that I do not have to roll. However if you have to roll this is quite simple and cheap.
2) Sure the futures have to be liquid. GC and ES futures have small spread even if they are further out. For UB or ZB it could be that only the front future has a tight spread.
3) No, rolling should not interfere with the strategy
4) This is why you should write far out options with a high premium. These Options do not change the delta so much even for bigger moves. In a high volatility environnement this strategy is even better as most of the premium is due to volatility and you can cash in very good profits if premium goes down. You might check your total portfolio delta$ for each position from time to time and correct it by buying /selling Futures if delta changes too much.