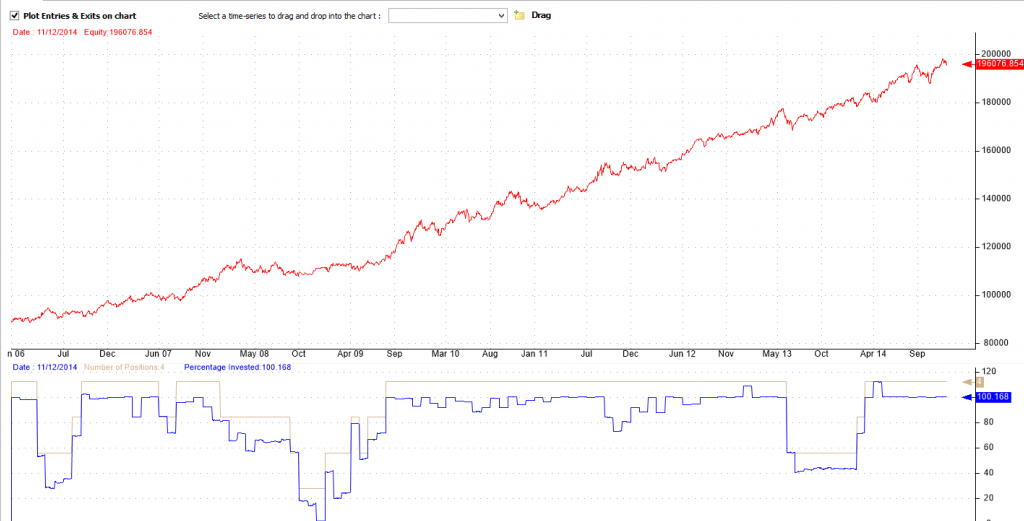
In a previous post we introduced our new investment strategy, the BUG, an adoption of the permanent portfolio following “Fail-Safe Investing: Lifelong Financial Security in 30 Minutes” by Harry Brown. There has been a lot of interest but also some concerns when it comes to using leverage.
Adoption of the permanent portfolio following “Fail-Safe Investing: Lifelong Financial Security in 30 Minutes”
We are introducing a version of the BUG for non-leveraged accounts. Here are the statistics for the backtest for the last 5 years. See here the recent performance.
| Strategy | Return | MaxDD | Sharpe Ratio | CarMaxDD |
| BUG straight | 9.63% | 5.41% | 0.98 | 1.78 |
In this version of Fail-Safe Investing we allocate amongst 6 ETFs: SPY, TLT, GLS, CWB, TIP and PCY. Again as in the original strategy we use these heuristics: Timing (using a simple average rule), Volatility Targeting (we reduce exposure to more volatile ETFs), Momentum (we reduce the size of the worst performer and add to the rest). We don’t employ short term mean reversion and we only trade up to 4 assets.
Trading the Strategy following Fail-Safe Investing
The strategy trades near the beginning of the month. You will receive your signals the day before. You may place the trade for the opening or the closing of the session or you may place a limit order throughout the day. Exact timing makes little difference to the strategy in the long run.
Turnover
The strategy does not usually buy and sell whole positions but rather re-balances positions. We could start with a 25% allocation to SPY and the next month the allocation is reduced to 15%. Most of the time only a part of the position is bought and sold.
Which one should you trade to stick to Fail-Safe Investing?
Most people should trade the non leveraged BUG.
The leveraged BUG could be traded if you have an account with Interactive Brokers or similar type of discount broker that provides cheap leverage and rock bottom commissions.

Dear Ed,
You can see a table of historical allocations here. The re-balancing fees are acceptable (assuming $9 per trade) and can be further reduced if one uses some of the ‘free’ commission ETFs that many providers offer. The weightings start by assuming an equal weight allocation (25%). A percentage of weight is subtracted from the worst performer (from the top 4) and that weight is distributed to the other funds. That we way we favor winners and underweight losers. Keep in mind that if volatility is high on an asset (usually SPY or GLD) the algorithm will underweight that asset. This may result in lower returns but protects the account from being too overweight on volatile winners.
Vangelis,
I appreciate your work and the comments from both you and Frank clarifying the strategy construct and rationale for updating HBPP. I am unclear if the stats for Bug 7 include using 2X leverage and if so is that 2X leverage comes by doubling the allocation to each position listed in the performance table? No leveraged ETFs used I assume. Thank you.
The leveraged version of the BUG uses a slightly different logic and does not double the allocations of the unleveraged version. What is really happening behind the scenes is that the leveraged version can spread funds to up to 7 ETFs (rather than 4) including SHY. Because it spreads out funds more and because it limits or rejects some of these 7 slots the result is a often underinvested portfolio with very low risk but also low return. In other words the BUG7 is more conservative, has a better risk adjusted characteristics and can accept leverage while keeping risk below a threshold. This is standard practice: Often one develops a strategy without looking at returns. He cuts down on risk first, usually by diversifying, then leverages up so as to reach a desirable return. Of course all this assumes the investor who implements the strategy has an account with very low borrowing rates and commissions, which is most often not the case.
Thank you for the reply. Do you have monthly trade data similar to the data for the straight BUG?
Michael,
After responding to your comment with my long-winded explanation of BUG7 I realised you just wanted the return table for the BUG7 and were checking wether to double up the values. I will post a performance table as soon as I am back and will let you know.
Dear Ed,
Very nice work. The results are in line with what we have observed. Favoring assets by momentum does provide better returns.
One can use proxies for a longer historical simulation.
Equities- VFINX (yahoo)
Treasuries- VUSTX (yahoo)
Gold- LBMA (London Bullion prices from Quandl ( https://www.quandl.com/OFDP/GOLD_2-LBMA-Gold-Price-London-Fixings-P-M)
Cash- VFISX (yahoo)
Frank, Vangelis,
I know you are using the adaptive allocation for this strategy, but I am curious if you ran backtests on the Bug strategy using the momentum and volatility rankings (63 days) and using only the top 2 or top 1 ranked ETF for the month instead of holding 4, and using the 200 day filter.
We have run that variation as well as many others. Frank came up with some excellent variations, too. But the philosophy of the BUG is to be defensive and to not correlate with GMR or MY so it can complement those strategies as to decrease overall risk in larger accounts. For better returns one should use our other strategies.