In our recent post we´ve shared some powerful options to design a well-balanced portfolio of several Logical Invest strategies to achieve a preset portfolio objective using Modern portfolio theory (MPT) techniques developed by Nobel Prize laureate Harry Markowitz. Here, we review the steps to achieving an optimized portfolio with our tools and summarize some portfolio options to illustrate use of our updated tool set:
These options might serve as a starting point to design your own portfolio according to your return and risk preferences, fundamental beliefs or asset class preferences.
How do I start easily designing my portfolio?
You can design a portfolio to meet your objectives in three simple steps that will not take you more than 30 minutes initially, and about 15 minutes monthly for rebalancing:
[fusion_builder_container hundred_percent=”yes” overflow=”visible”][fusion_builder_column type=”1_1″ background_position=”left top” background_color=”” border_size=”” border_color=”” border_style=”solid” spacing=”yes” background_image=”” background_repeat=”no-repeat” padding=”” margin_top=”0px” margin_bottom=”0px” class=”” id=”” animation_type=”” animation_speed=”0.3″ animation_direction=”left” hide_on_mobile=”no” center_content=”no” min_height=”none”]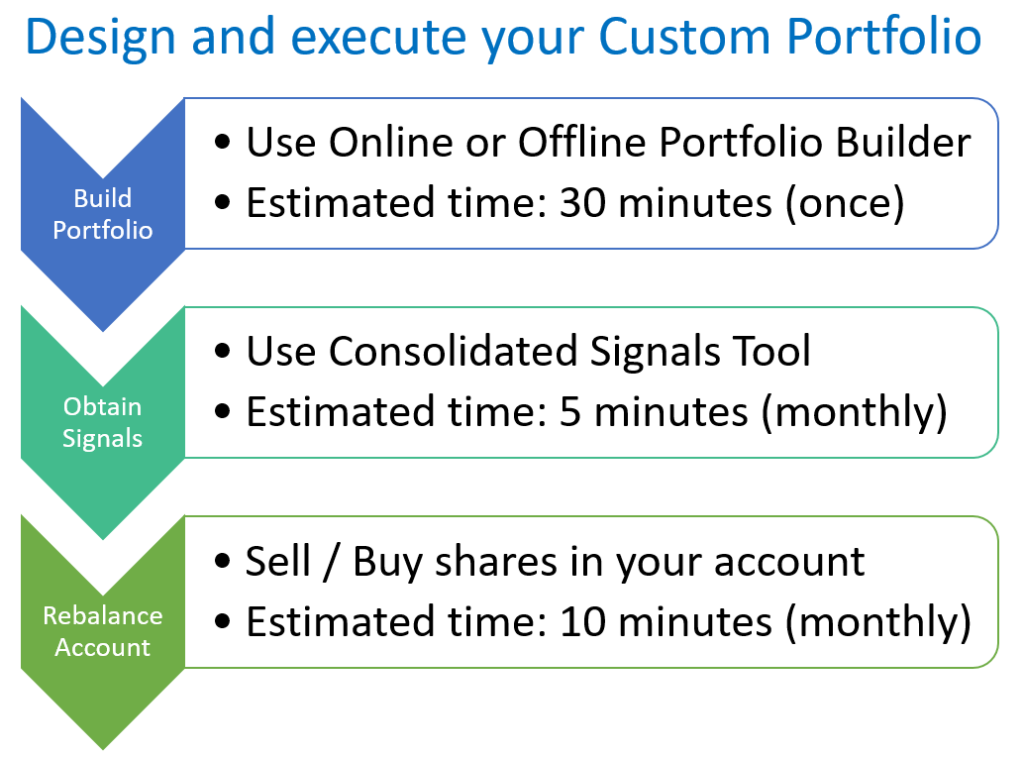
Starting with our Online Custom Portfolio Builder, you can simply select a preset portfolio objective. The tool will report back the allocation across our strategies that achieves that objective based on our quantitative models, and on portfolio optimization procedures that analyze the last 2105 trading days. Additionally, the user can select the “Custom Portfolio” tab, enter any strategy allocation weights he wishes and similarly calculate the performance of his custom allocation. Combined with our “Consolidated Signals” tool which we will introduce in a minute, the results from Portfolio Builder will point the user to the allocation across ETFs and/or stocks that have the best prospect to meet his objective.
A Practical Example:
Here is a practical example: Let´s assume I think a historical portfolio volatility of around 15% in the period 2008-2016 is acceptable to me I would simply choose the “Max15% Volatility” (and Max CAGR) portfolio from the preconfigured portfolio list. Strategy allocation weights are immediately shown in the performance table and the portfolio risk/return performance is graphed in comparison to that of the ensemble of our strategies. The Preconfigured Portfolio performance summary is shown below:
[/fusion_builder_column][fusion_builder_column type=”1_1″ background_position=”left top” background_color=”” border_size=”” border_color=”” border_style=”solid” spacing=”yes” background_image=”” background_repeat=”no-repeat” padding=”” margin_top=”0px” margin_bottom=”0px” class=”” id=”” animation_type=”” animation_speed=”0.3″ animation_direction=”left” hide_on_mobile=”no” center_content=”no” min_height=”none”]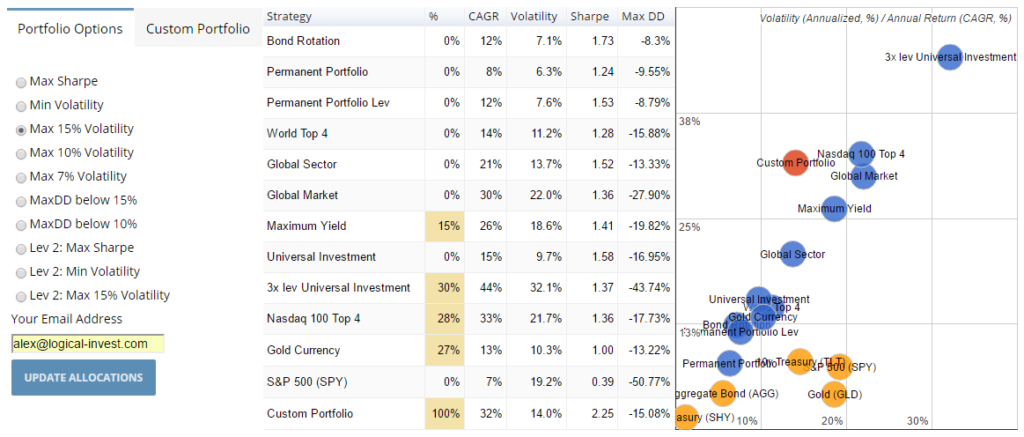
However, on a second look I do not feel comfortable allocating 30% of my portfolio to our 3x leveraged Universal Investment Strategy (aka “Hell on Fire”, as some members of the AAII Silicon Valley have called it). Therefore, I will instead allocate the 30% into our non-leveraged Universal Investment Strategy. Using the “Custom Portfolio” tab easily allows me to input the preferred allocations, and looking at the performance statistics I now feel much more comfortable. It shows a solid 22% compounded return, volatility less than 10%, a Sharpe Ratio close to 2.4, and a drawdown of only 6%, even going through the 2008/2009 financial crisis:
[/fusion_builder_column][fusion_builder_column type=”1_1″ background_position=”left top” background_color=”” border_size=”” border_color=”” border_style=”solid” spacing=”yes” background_image=”” background_repeat=”no-repeat” padding=”” margin_top=”0px” margin_bottom=”0px” class=”” id=”” animation_type=”” animation_speed=”0.3″ animation_direction=”left” hide_on_mobile=”no” center_content=”no” min_height=”none”]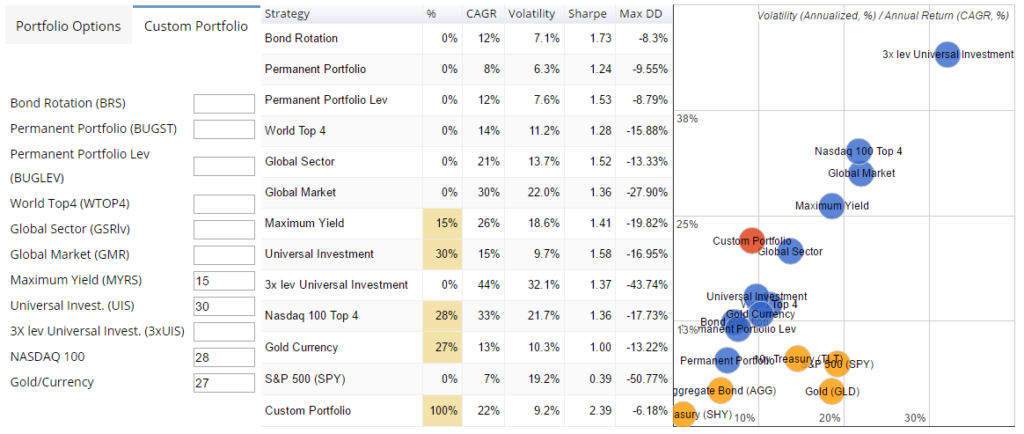
A look at the performance of the Custom Portfolio and each of its constituent strategies over time shows me how our Gold-Currency strategy served as diversifier, balancing portfolio performance during the August 2015 and January 2016 corrections, as well as during Brexit:
[/fusion_builder_column][fusion_builder_column type=”1_1″ background_position=”left top” background_color=”” border_size=”” border_color=”” border_style=”solid” spacing=”yes” background_image=”” background_repeat=”no-repeat” padding=”” margin_top=”0px” margin_bottom=”0px” class=”” id=”” animation_type=”” animation_speed=”0.3″ animation_direction=”left” hide_on_mobile=”no” center_content=”no” min_height=”none”]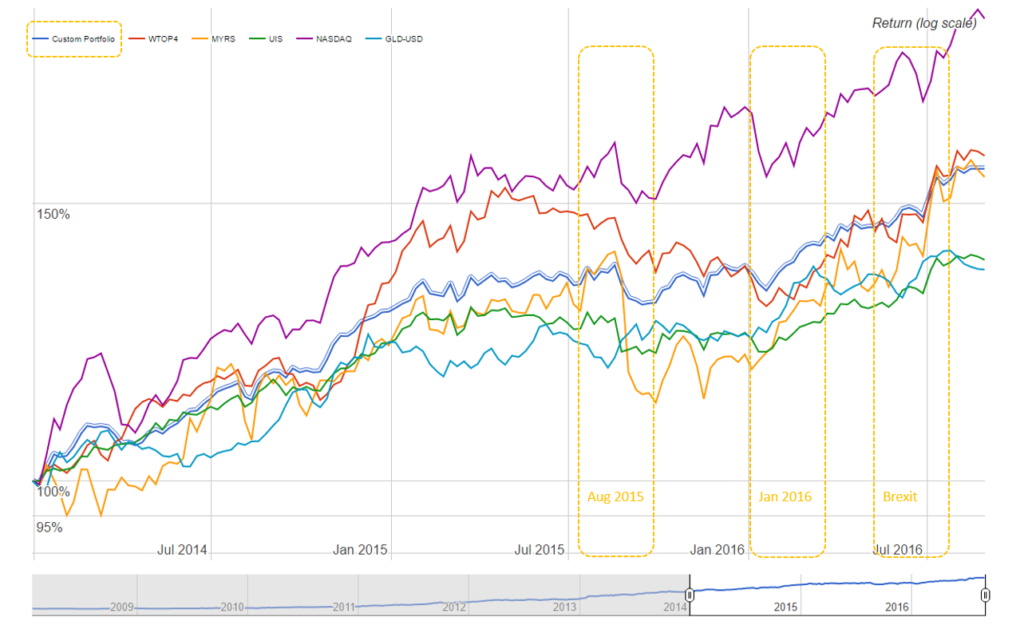
Further, as can be seen below, the low correlation of the overall Portfolio of 0.3 with the S&P 500, and of all employed strategies in a range of -0.02 (negatively correlated Gold-Currency strategy) to only 0.34 (the SPY employed in the Universal Investment strategy is diversified with the bond component) improves my confidence and increases my level of comfort with strategy I’ve developed.
[/fusion_builder_column][fusion_builder_column type=”1_1″ background_position=”left top” background_color=”” border_size=”” border_color=”” border_style=”solid” spacing=”yes” background_image=”” background_repeat=”no-repeat” padding=”” margin_top=”0px” margin_bottom=”0px” class=”” id=”” animation_type=”” animation_speed=”0.3″ animation_direction=”left” hide_on_mobile=”no” center_content=”no” min_height=”none”]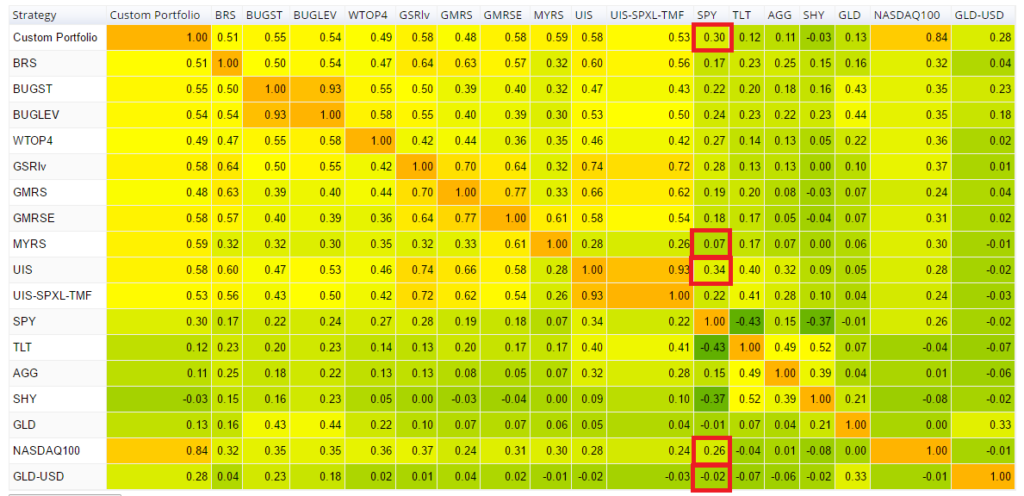
So, within minutes I have set up my preferred Portfolio by starting with an initial risk level, assessing the results, and then adjusting the allocations to reduce the initial risk level to increase my comfort level. The resulting portfolio combines allocations of 30% Universal Investment Strategy, 28% NASDAQ 100 strategy, 15% Maximum Yield Rotation and 27% Gold Currency Strategy, which, we have seen, serves as an additional diversifier.
In summary to this point, our Online Custom Portfolio Builder is an optimization tool for achieving a preset portfolio objective, and to adjust weightings to personal preference while reporting adjusted performance results. It is meant to help our subscribers take advantage of powerful asset allocation scenarios that increase return while lowering risk by building a diverse portfolio, in the manner of Markowitz. When measurably diverse assets are combined in a portfolio, portfolio risks are reduced while maintaining robust returns. As has been shown, investing objectives that range from maximizing annual return for a given level of volatility, to minimizing volatility overall and much in between are reflected in our pre-configured portfolios, which can be further customized to meet specific user interests.
Now that I have the portfolio of strategies that meet my objectives, how do I do the monthly rebalancing? That is, how do I combine the total allocation by strategy and the underlying ETF/stocks with the amount to be invested to come up with the specific allocation to shares to rebalance in my account? Sounds complicated? Not anymore!
How to handle the monthly rebalancing of a Portfolio of Strategies?
Once I´m settled on my portfolio objectives – return vs risk as shown in Portfolio Builder, the question I, as well as of our All Strategy subscribers have, is simply “What ETFs can I hold to maximize the likelihood of achieving these goals over time?”.
In a simple process for the user, our new Consolidated Signals tool leverages our sophisticated quantitative strategy models and optimization processing that underlie the strategy allocations in Portfolio Builder. This Consolidated Signals tool provides actionable guidance by identifying the underlying ETFs and respective weighting allocation to achieve the user’s portfolio objectives.
Going back to my chosen portfolio, I want to combine the four mentioned strategies and allocate an assumed 100,000 USD in my account to the proper collection of ETFs/stocks that achieve my strategy objective. The Consolidated Signals tool allows me to simply input the allocation values by strategy from the Portfolio Builder, visually confirm allocations into Strategies and view, in turn, the underlying allocations to the collection of ETFs that implement the strategy. The figure below shows the Portfolio Builder strategy allocation on the left and and the ETFs/stocks that underlie that portfolio on the right.
[/fusion_builder_column][fusion_builder_column type=”1_1″ background_position=”left top” background_color=”” border_size=”” border_color=”” border_style=”solid” spacing=”yes” background_image=”” background_repeat=”no-repeat” padding=”” margin_top=”0px” margin_bottom=”0px” class=”” id=”” animation_type=”” animation_speed=”0.3″ animation_direction=”left” hide_on_mobile=”no” center_content=”no” min_height=”none”]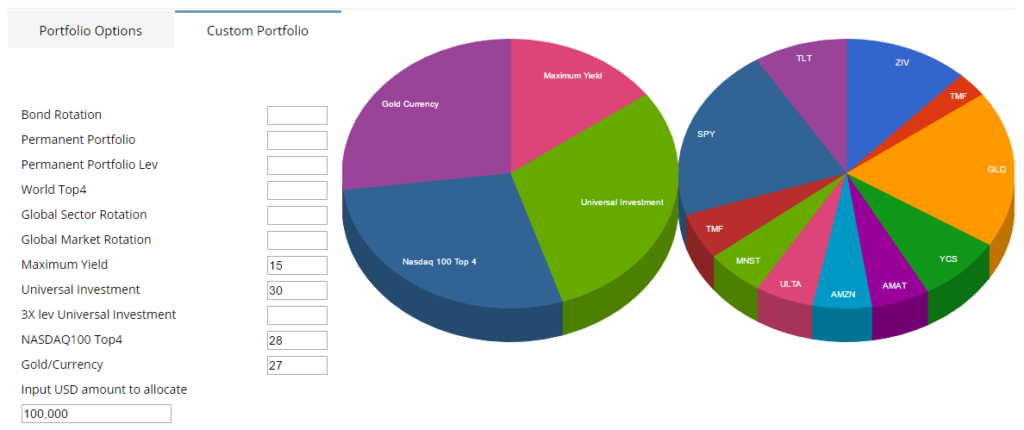
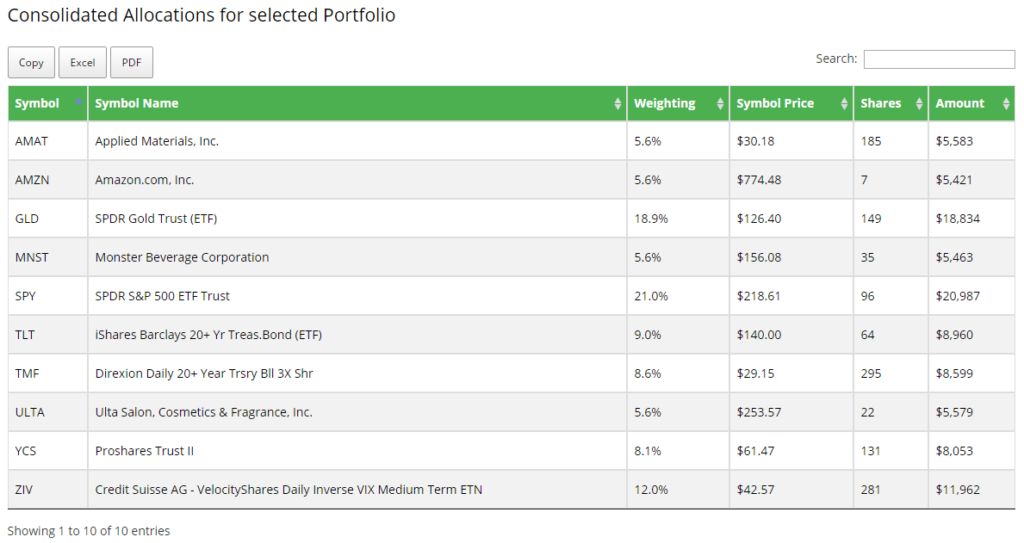
The tool provides me the ETF allocation signals consolidated across strategy, the last available trade prices, amount and shares to invest or to rebalance, see below:
These consolidated signals data can now be easily exported into Excel for further customization. For example, converting the 9% allocation of TLT (iShares Barclays 20+ Yr Treasury Bond) shown above to an additional 3% allocation to its three times leveraged sibling TMF (Direxion Daily 20+ Year Trsry Bll 3X Shr) (3% + 8.6% = 11.6%), reducing the needed ticker count (and commissions), and then calculating shares to sell or buy for rebalancing, like below.
[/fusion_builder_column][fusion_builder_column type=”1_1″ background_position=”left top” background_color=”” border_size=”” border_color=”” border_style=”solid” spacing=”yes” background_image=”” background_repeat=”no-repeat” padding=”” margin_top=”0px” margin_bottom=”0px” class=”” id=”” animation_type=”” animation_speed=”0.3″ animation_direction=”left” hide_on_mobile=”no” center_content=”no” min_height=”none”]
In summary, our Portfolio Builder and Consolidated Signals tool set make the connection from the abstract goal of a portfolio objective to a practical, actionable collection of ETFs/stocks holdings that have the best prospects of achieving that goal.
Investing objectives that range from maximizing CAGR at a given level of volatility or drawdown to minimizing volatility overall, and much in between are reflected in our pre-configured portfolios available in our Online Custom Portfolio Builder. In the background we update each of our 11 strategies and the preconfigured portfolio options frequently with the latest performance information, and in turn update monthly the ETFs each strategy should hold to meet its objectives based on our models. For the monthly rebalancing, our Consolidated Signals Tool allows you to obtain the needed rebalancing of shares within minutes, and reflect them in your account within another 10-15 minutes. Portfolio objectives to account holdings – simple as it gets.
For both tools we´ve opened a discussion forum at the bottom. Please support us with your constructive critique and comments.
In anticipation of a vivid discussion,
All the best,
Alexander Horn
[/fusion_builder_column][/fusion_builder_row][/fusion_builder_container]
Alexander,
I like the new tools. I normally like to keep 5-15% cash in my total account. I use the custom model and have to normalize the weights to make the model work. Would it be possible to add SHY as a cash equivalent to the model?
Thanks for the feedback. In an effort to keep the tools simple, we currently do not support any custom assets in the Online Portfolio Builder, the Excel version contains SPY, GLD, SHY, AGG. I put this functionality on my ToDo list though, agree this is very usefull.
For simulating cash or any other holding in the consolidated signals, please reduce both the allocated amount and percentage allocation. For example, simulating a 10% SHY in a $100k account, simply use 90k amount and allocate 90% to the strategies.