Correlation and Diversification
This quick tool allows you to select different symbols and visualize the correlation among them. By identifying assets with low correlation to each other you can protect your portfolio from drawdowns. Read more in our articles about diversification and using correlation in portfolio management.
This tool is not intended to be perfect, it is a base for further work on your own. Also read below article on the background:
How can you use low or negative correlation in risk management?
Remember your last beach holiday abroad. Probably there were also beach sellers. Did you notice that these beach sellers often have sunglasses and umbrellas on offer, although it is clear that they will sell only one of the products, depending on the weather? They do what you as investors should do: they diversify to reduce their risk.
The aim of diversification is to reduce the risk or to increase the rate of return even if the risk expectation remains the same. In financial markets, the risk is also referred to as volatility and measured mathematically with the standard deviation. One standard deviation includes about 68% of all measured values. Thus, a stock with an expected return of 6% and a risk of 10% will yield a return between minus 4% and plus 16% in slightly more than two thirds of all cases.
The founders of the modern portfolio theory and later Nobel laureates Harry Max Markowitz, Merton H. Miller and William Sharpe analyzed the relationship between yield, risk and the effect of diversification at the beginning of the 1950s. We will show you in simplified form how the diversification of investments works using an example with two shares. It is the cornerstone of modern portfolio theory and should be known to any advanced investor and asset manager .
Risk and return with two shares
Let us assume that you have only two stocks to choose from, which have the following historical values:
A share: 15% return, 17.5% risk
B share: 17% return, 7.8% risk
If you could only buy a single stock, then you would have to choose between the B share suitable for conservative investors and the A share that is suitable for risky investors:
Correlation and portfolio with two shares
Based on the historical price developments, the correlation between the two shares can be calculated by means of yield, risk and covariance. The correlation can be between +1 (perfectly positive) and -1 (perfectly negative). The lower the correlation, the less two shares move in the same direction. As investors, securities with low or even negative correlation are optimal. The closer the correlation is to -1, the greater the effect on the diversification. Unfortunately, the correlation is often positive. Thus, the stock markets of the large industrialized markets show a correlation coefficient between +0.4 and +0.9. As long as the correlation is not +1, one can, however, diversify its investments.
For our example with the two stocks, assume that the correlation between the two stocks is -0.5. By means of this formula, it is possible to calculate the return and risk for different weights of the two shares.
Because the correlation is not 1.0, there is no straight line between the points “100% A share” and “100% B share” for different allocations of the portfolio to the two individual stocks. What does this mean?
Risk-effective combinations
For a better understanding, consider below figure, on which we have illustrated the possible combinations, just with 4 shares:
If you invest 100% of your money in the B share, you have an expected return of 17% at a risk of 7.5%. Now consider the case of investing 100% in the A share. Your expected return is 15% at a risk of 18%. You will see that if you split the two shares in half, you will achieve significantly higher returns while being exposed to a lower risk of price fluctuations. If you have understood this, you have understood the modern portfolio theory and now know that it is worth investing your money in more than one single share.
Risk-efficient line
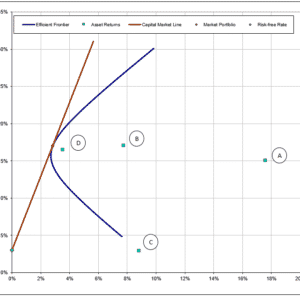
A portfolio is considered to be efficient if no other portfolio has a higher yield at the same or lower risk or no other portfolio has a lower risk with the same or higher yield. These portfolios are on the risk-efficient line.
Below illustration shows you the example with 4 different shares. You can see that the risk-efficient frontier (blue line) allows you obtain better returns (vertical scale) with lower risk (horizontal scale), compared to investing 100% in any of the individual shares.

Putting modern portfolio theory in practice:
The following tool allows you to select some ETF of your choice and see their correlation over time. You can make a copy of it into your own Google Drive to adjust it to your needs.