Home › Forums › Logical Invest Forum › “Maximum Sharpe” Portfolio Optimization
- This topic has 0 replies, 1 voice, and was last updated 5 years, 4 months ago by
Alex @ Logical Invest.
- AuthorPosts
- 02/15/2020 at 2:42 pm #77660
Alex @ Logical Invest
KeymasterJust had an email exchange with a community member on how our portfolio optimization works, and think this is worth sharing:
We follow a classical modern portfolio theory approach. I just made a fresh run using our portfolio optimizer, which has some restrictions and results deviate slightly from the last “official” annual run which we did on Jan 1st, but you can reconcile easier by your own, so here with some screenshots from our Portfolio Optimizer
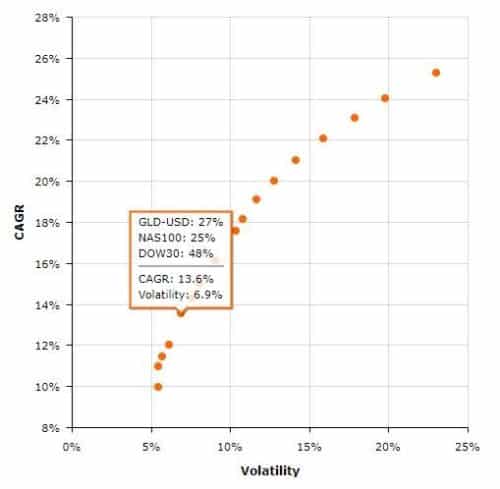
So here is our “efficient frontier” of our strategies for 2007 to date, the marked dot is the “max sharpe” portfolio:
Here how it our optimization engine works in detail, this is our “configuration” for the max sharpe portfolio with some comments in red. You can’t see this stuff in the frontend directly, but I guess it helps you to understand with a bit of Markowitz theory in mind….
 "period": "14 years",
 (which results in "fromDate": "2007-02-16","toDate": "2020-02-14",)
 "metric": "Volatility",
 (target function, get lowest volatility for each return range)
 "filters": [{"metric": "Sharpe","op": "max"}],
 ( filter the results by the best sharpe ratio, so we only get one)
 "maxAssets": 3,
 (additional constraint we put in to keep it manageable, you can relax that in your own optimizations)
 "weights": {
 "BRS": {"min": 0,"max": 100},
 "BUG": {"min": 0,"max": 100},
 "WTOP4": {"min": 0,"max": 100},
 "GSRS": {"min": 0,"max": 100},
 "GMRS": {"min": 0,"max": 100},
 "MYRS": {"min": 0,"max": 100},
 "NAS100": {"min": 0,"max": 100},
 "GLD-USD": {"min": 0,"max": 100},
 "USSECT": {"min": 0,"max": 100},
 "UISx3": {"min": 0,"max": 100},
 "USMarket": {"min": 0,"max": 100},
 "DOW30": {"min": 0,"max": 100},
 "UIS": {"min": 0,"max": 100}
 (strategies to be considered and their weight constraints, if any. Here we use all and have no weight constraints)
You can do a similar optimization by your own with our Portfolio Optimizer using these inputs: Note you cannot input all 13 strategies at the same time, that’s a limit we put in to keep our server out of trouble. But we have them all in in our own optimizations.
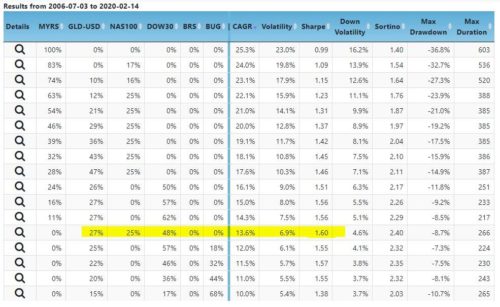
Hit optimize and your get something like below. These are the best combinations for each “CAGR bucket”, which you can see is roughly a one percentage point change in CAGR. And in yellow I’ve marked the portfolio with the highest sharpe ratio, which is what we’re looking for:
And the graphical representation is our efficient frontier from the top:
So yes, under the set conditions:
- Time frame 2007 – now
- Max 3 assets
- (… plus non-negative weights, e.g. no shorting and total weight 100%, e.g. no leverage)
this is THE portfolio which would have resulted in the highest Sharpe ratio…. There is no other with a higher sharpe ratio..
But you can also see the limitation of such an approach, for example the rows above and below the yellow marked “max sharpe” do not allocate to Nas100, but more on Dow30 or the BUG. So which is “better”?
As we highlight in the description of the portfolios, this is only a mathematical optimization, so you should set your own conditions on which strategies to use, how many assets to include, and which risk/volatility level to pick at the end. If you click on the “lens” icon left to each row in the list you can see the details and further fine-tune and save as your portfolio.
- AuthorPosts
- You must be logged in to reply to this topic.


