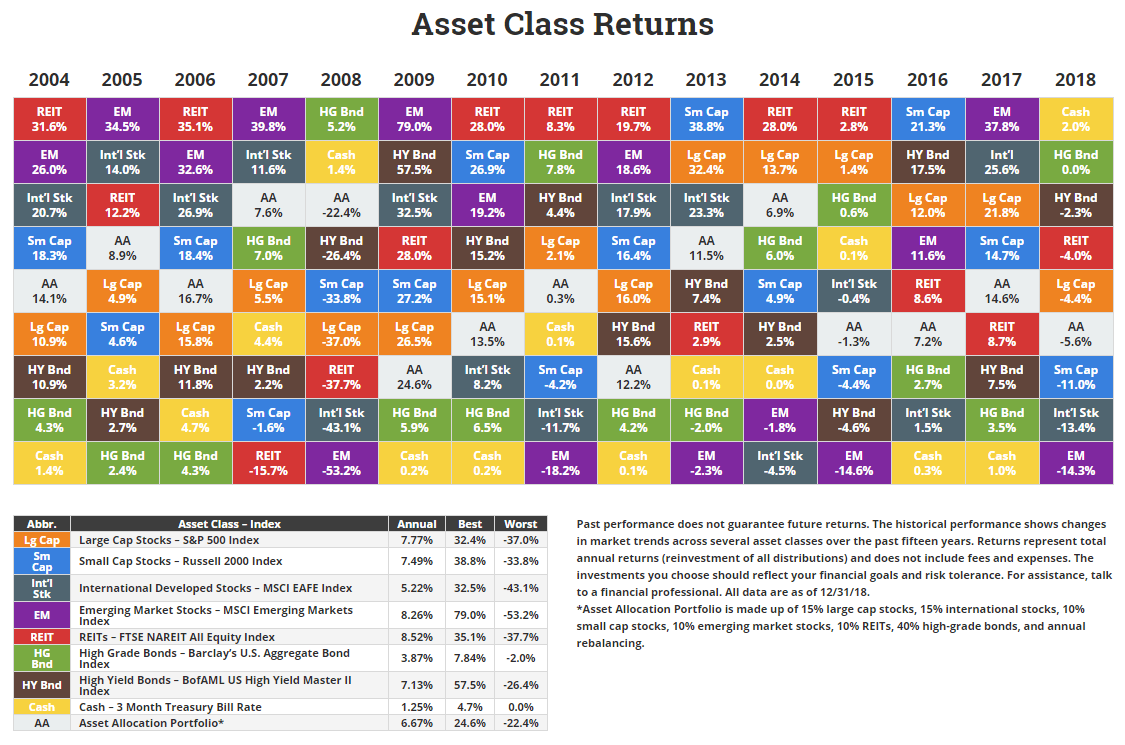
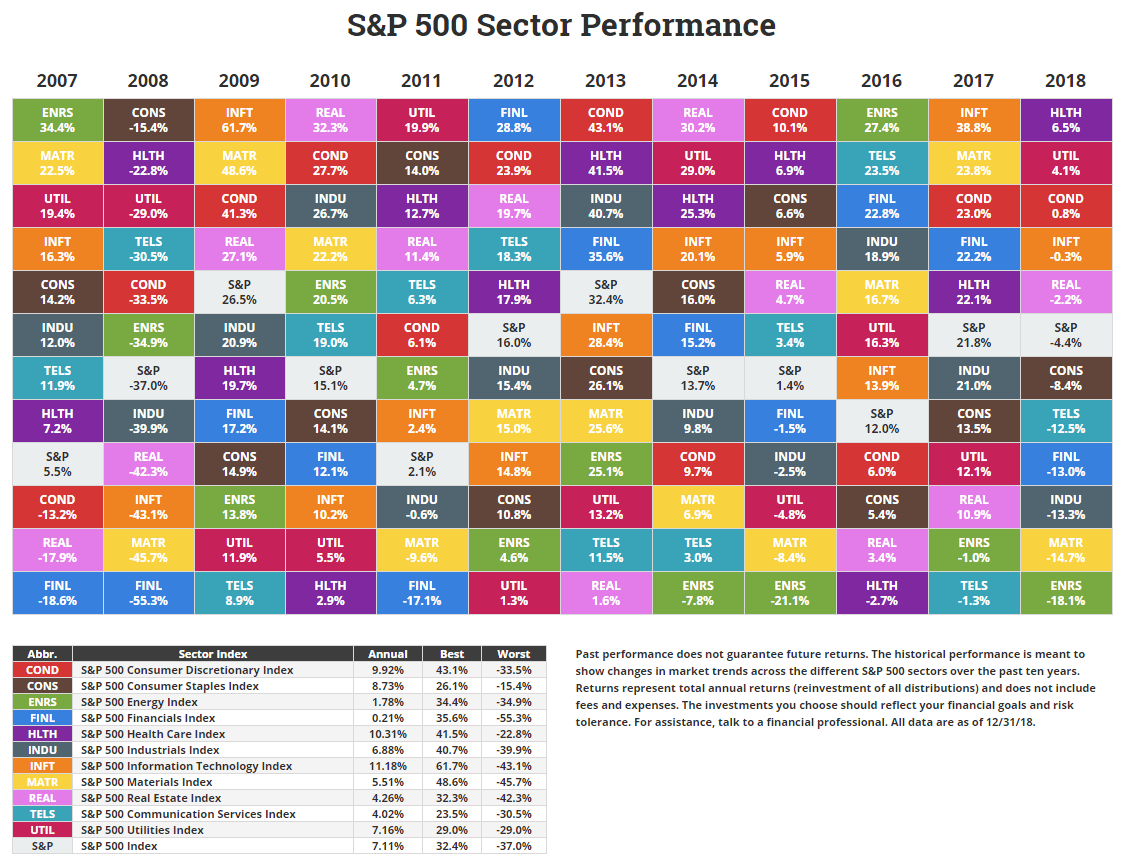
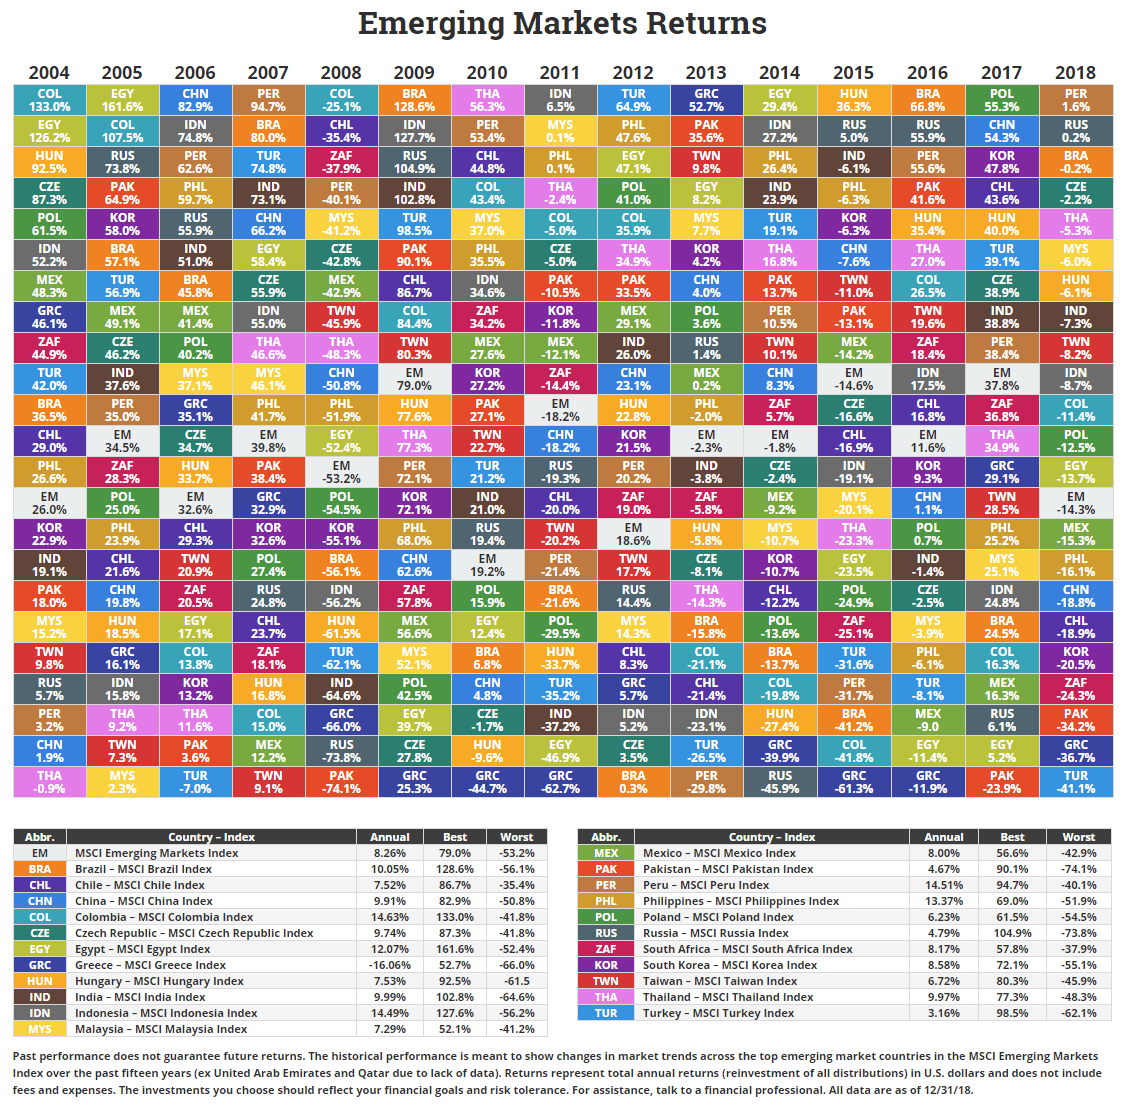
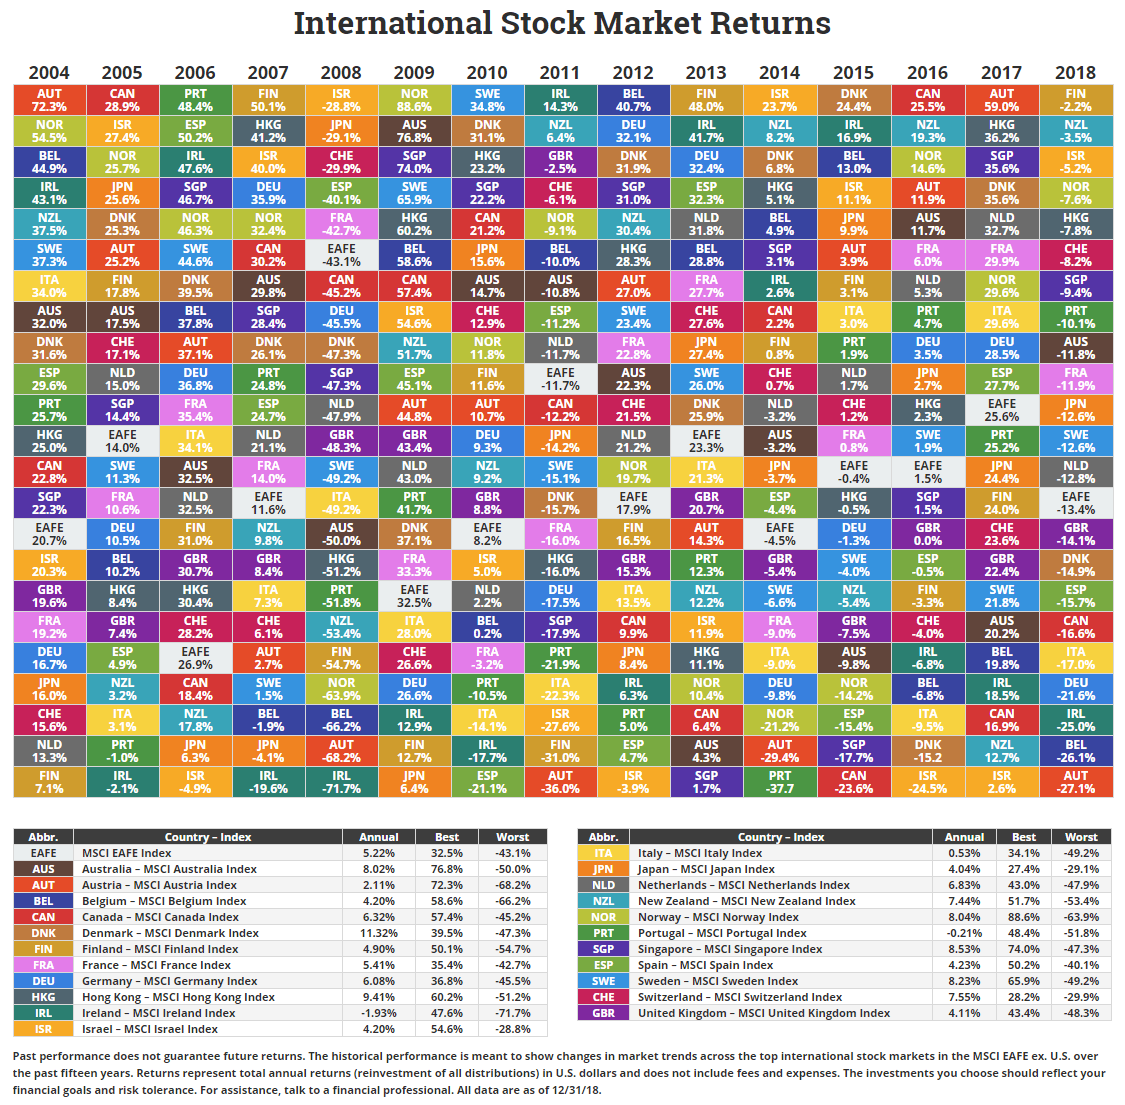
The charts below show the historical returns by asset class, sectors, and stock markets. They might serve to visualize one of the most common problems investors struggle with when deciding their asset allocation. It’s difficult to pick the best performing investment year after year, yet for many investors it’s an annual event. They look for an encore, picking the best asset class last year with the hope of a repeat performance. Yet, betting on last year’s winner rarely works out. Assets at the top of the chart one year could be at the bottom the next, and vice versa.
By using our smart Momentum based Rotation Strategies you benefit from investing in the strongest assets, thus in average outperforming the underlying indices. You overcome the whipsaw effects a typical asset allocation which simply invests in the Top X based on historical returns by asset class.
Which one would you have bet on during the last years?
All return tables courtesy of Novel Investor
Now, compare this to our momentum based strategies, which allow you to always bet on the fastest horses. Detecting lasting trends our strategies shuffle their holdings so you are always set up for success:
| Name | Return 5y ▼ |
|---|---|
| Crypto & Leveraged Top 2 Strategy | 991.7% |
| NASDAQ 100 Strategy | 336.7% |
| US Market Strategy 2x Leverage | 172.7% |
| Universal Investment Strategy 3x Leverage | 159.2% |
| Top 3 Strategies | 157.4% |
| Volatility less than 15% | 136.6% |
| Aggressive Risk Portfolio | 130.1% |
| World Top 4 Strategy | 101.9% |
| Leveraged Gold-Currency Strategy | 98.3% |
| Global Sector Rotation Strategy | 93.6% |


