Here is a short description on how the OOS (Out Of Sample) optimization works.
Here is our standard SPY-TLT strategy optimized manually over 20 years
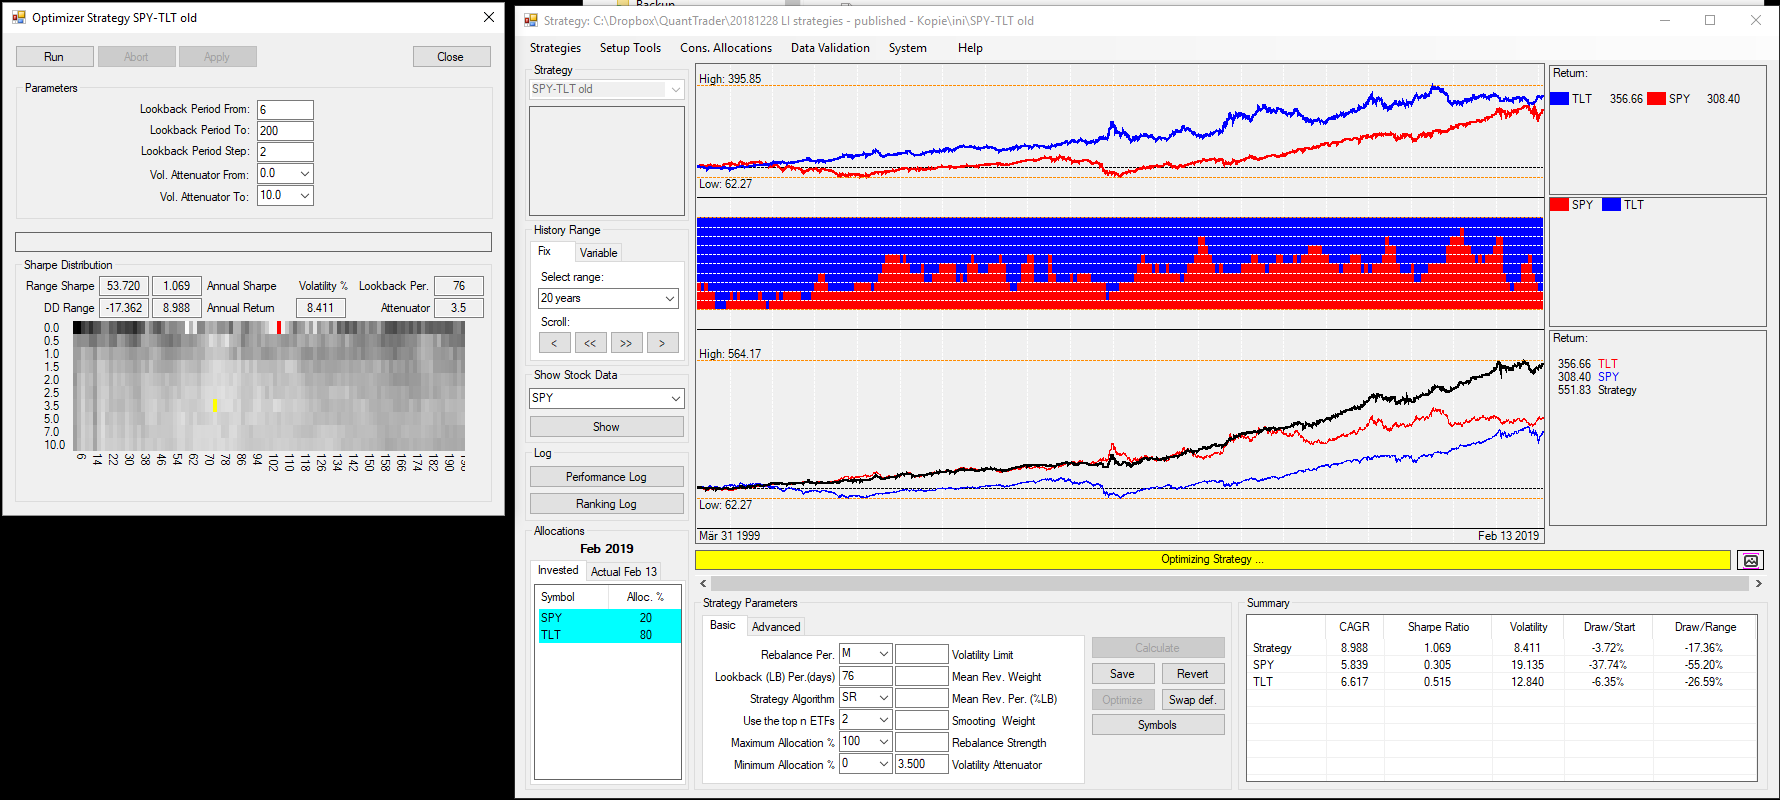
The optimizer result shows a maximum Sharpe for a setting of a 102 day lookback period and 0 as volatility attenuator. This means it looks only at the 102 day performance. This means also a setting which always switches 100% between the assets.
I choose however the yellow working parameters which are 76 days lookback and 3.5 volatility attenuator. This way we reduce volatility because we are always invested in both assets.
Now I run the same strategy with the OOS optimizer
The parameters are
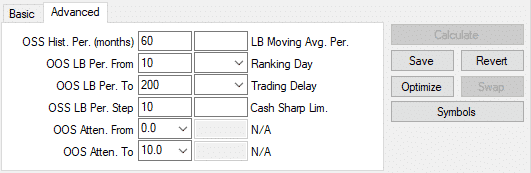
So I optimize over 60 months in the past for a lookback period between 10-200 days with steps of 10 days. The volatility factor steps from 0 to 10
Here is the result.
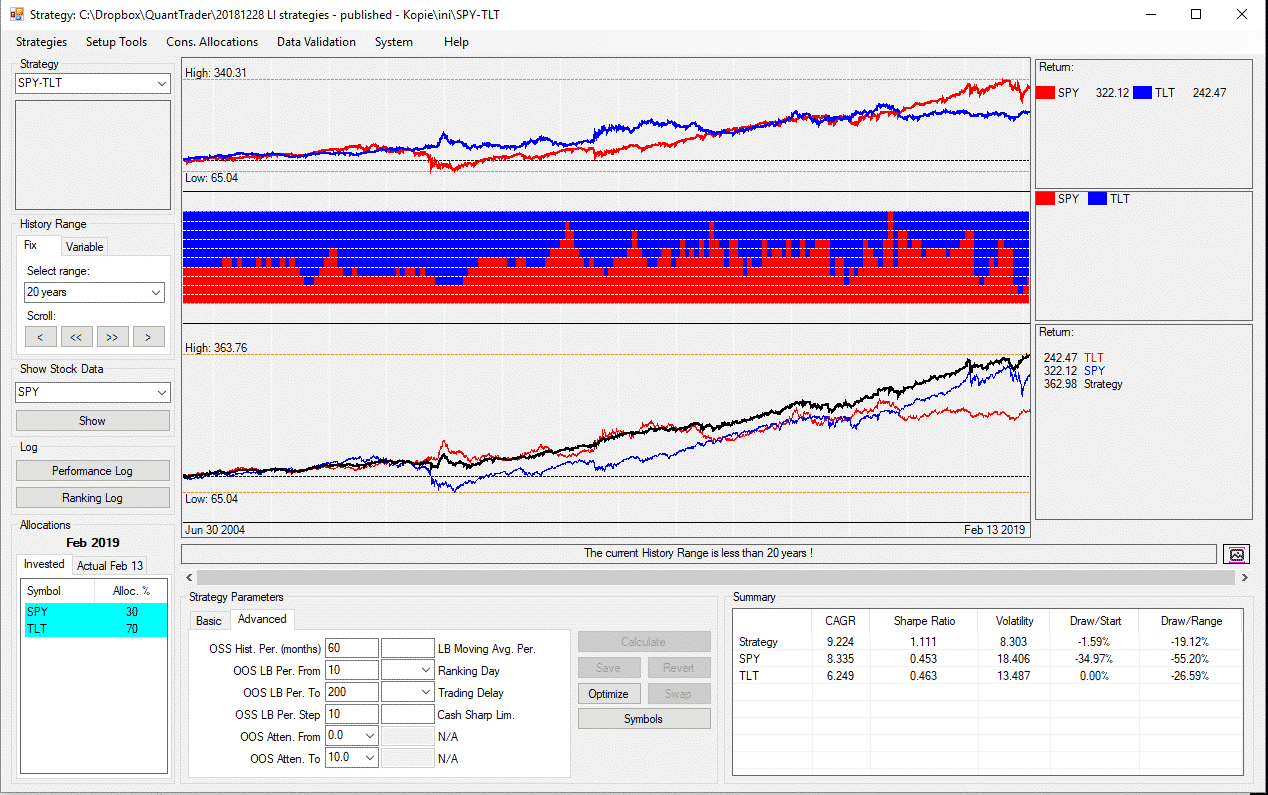
You see that the chart now starts in 2004 instead of 1999 because we used the first 5 years (60 months) to calculate the parameters we want to use for our strategy. Using these parameters we now calculate the allocation for the following month.
If you look at the performance log you will see that it uses a lookback period of 150 days and a volatility factor of 5 for the first months

going forward QT will optimize every month the last 60 months and use the resulting parameters for the next month. This calculations are quite time consuming because QT makes a full optimization for every month. You will have to wait a little bit for the result.
The end result is about the same as for the manual optimization over the whole 20 year period. The result is far better than any static 50-50 or similar allocation and we only used historical available data at any moment.
Using the performance log results, I have calculated an average lookback period of 71 days and an average volatility attenuator of 5 which is more or less the same I get when I optimized over the whole 20 years.
What you see here is that OOS in fact does not deliver much different results as manual optimization. If you optimize manually it is very important that your results are based on enough rebalancings and that you don’t pick parameters which are isolated in the 2D statistics chart.
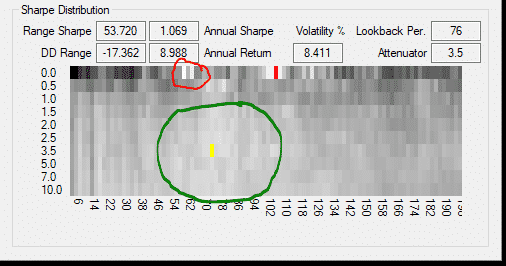
In the chart above we see two white settings (red circle) which seem not really stable. The same is true for the setting with the highest Sharpe ratio (red dot). However the yellow setting we have manually chosen (inside green circle) shows very stable results even if the lookback period or the volatility factor change quite a lot. For these values we have a good chance that they will work also in the future.
The OOS module is far from finished. I would probably need some sort of averaging of these parameters to avoid too big jumps. Also it is not easy to use this OOS calculation for other strategies. Most of the strategies just do not have enough history to be able to use this.
At the moment, I think a manual optimization probably gives us the best results, as we can visually inspect the 2D optimization chart. Also most of the time these values are quite similar. Nearly always a lookback period of about 3 months is a good choice. This is probably the case because many investors use a 3 months moving average to rebalance their investments. Other good lookback periods are 100 or 200 days probably because of the same reasons.
The volatility factor is mostly above 1 but below 5 which means that we use something between a minimum volatility allocation and a simple return based asset switching. Also this makes perfectly sense.
So I am still testing on how to make this OOS more stable and reliable but at least already these test prove that we are not just totally overfitting, but that these allocation make sense.