An analysis of Harry Browne´s Permanent Portfolio and further enhancements towards: A Permanent Portfolio ETF Rotation Strategy employing Momentum, Mean Reversion, and Volatility Targeting.

It’s not just cars. It’s investment strategies like the permanent portfolio, too.
Vintage “all-weather” investment strategies are often simple, easy to execute and give amble ‘out-of-sample’ data. In other words one can see how they performed in life years after they have been proposed. And like the VW bug, they are “safe” choices. Tried and true. Can you imagine a 1965 VW running in the Autobahn?
Although the essence counts for a lot, for the car to survive at today’s highway speeds the tech needs to be up to date. So let’s take my favourite oldie and bring it up to speed: Harry Browne’s Permanent Portfolio.
The Permanent Portfolio by Harry Browne
From Investopedia:
… Browne believed that the four asset classes would thrive in one of the four possible macroeconomic scenarios that exist.
- Stocks would thrive during periods of economic prosperity.
- Bonds would do well in deflation and acceptably well during periods of prosperity.
- Gold during periods of high inflation would rapidly increase in value as the only true defence against a deteriorating currency.
- Cash would act as a buffer against losses during a routine recession or tight-money episode, and would act well in deflationary times.
So let’s see how the original permanent portfolio Harry Browne first published has performed.
The original rules of the All Weather Portfolio:
- 25% in a stock market Index ( S&P 500)
- 25% in Treasuries
- 25% in Gold.
- 25% in Cash or similar
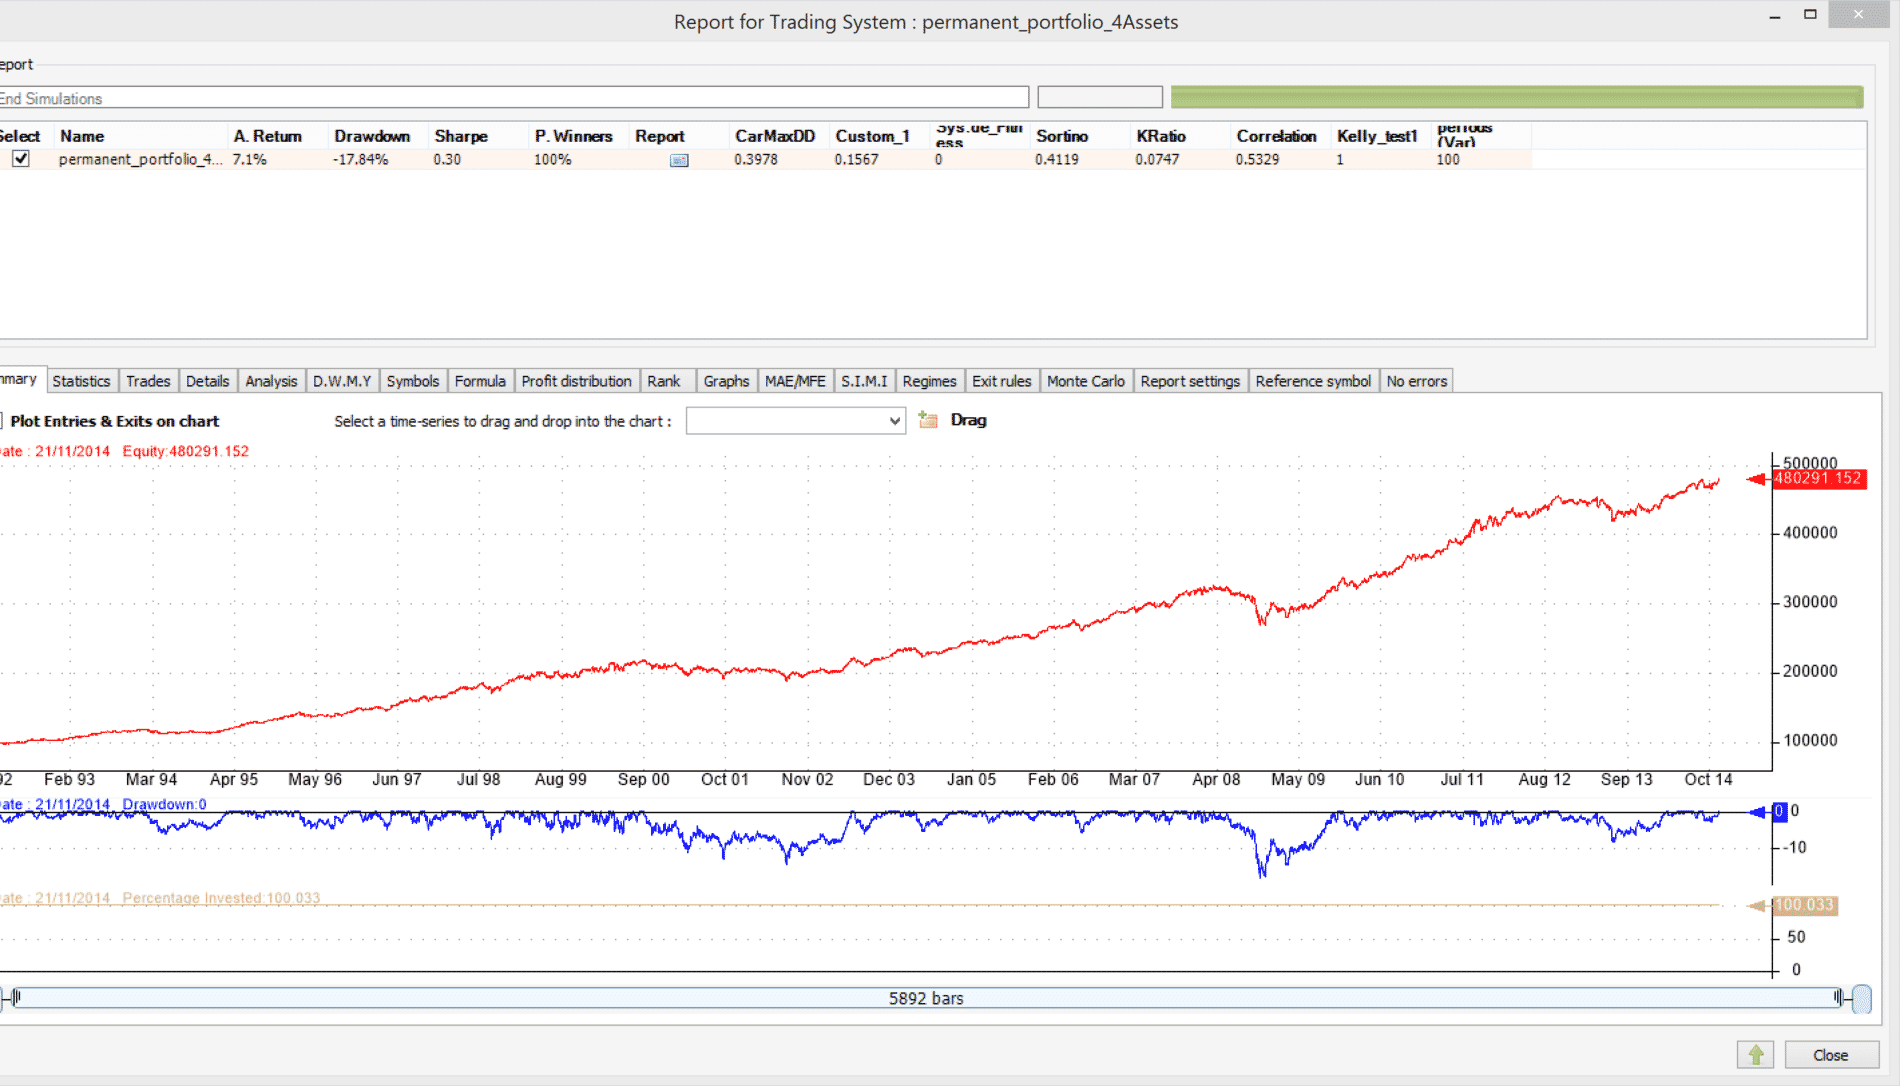
Not bad. Annual return is 7.1% and maximum draw-down comes in at 17.84% since 1992.
For a far more detailed analysis of the so-called fail-save investment or permanent portfolio or “PP” you can see Gestaltu’s excellent “PP Shakedown” series as well as Scott’s Investments analysis. There are many other articles and analysis that serve as inspiration to this article.
Building a new variation of Browne’s permanent portfolio.
So let’s update Browne’s Permanent Portfolio Strategy by using some recent tactics. All further rules assume monthly rebalance.
1. Volatility Targeting per Asset to enhance the stability of the permanent portfolio
If an asset exhibits historical volatility above a threshold, we cut it down in size as to reduce risk to the overall portfolio.
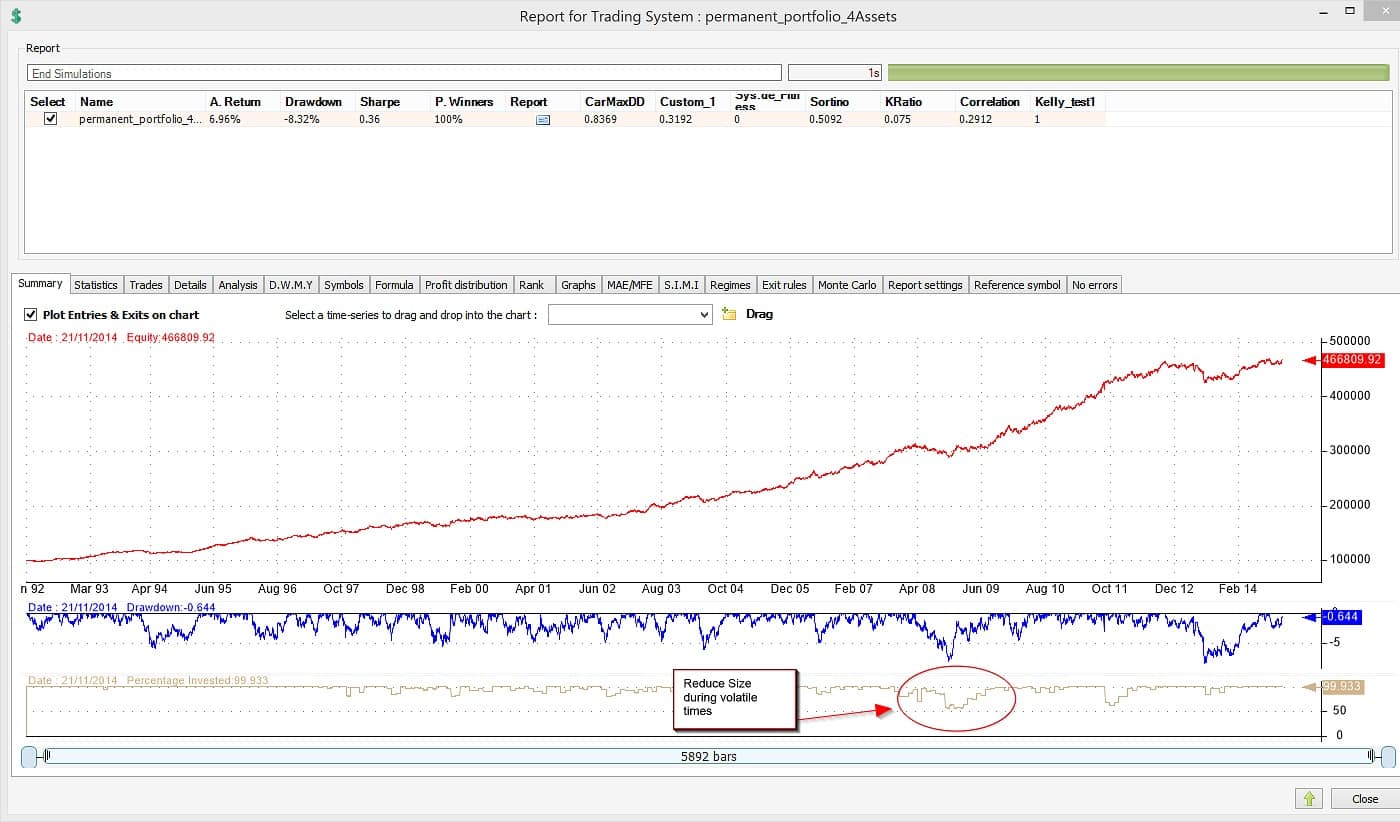
This decreases annual returns but also limits drawdown to under 9%. Overall, risk adjusted returns benefit. CarMDD is at 0.8.
2. Momentum as a new twist to the permanent portfolio
There’s been a fair amount of talk about momentum. Let’s try it. We will not limit our assets to just the few best. We are only trading four assets. Instead we will find the worst performer. We will decrease funds invested in that asset and distribute those funds to the rest. So if gold underperforms all other assets, we will sell some gold, divide the proceeds in three and buy equal amounts of the S&P 500 index, Treasuries and Cash.
Let’s try by pulling 15% of equity from the worst asset.

This seems to help. Annual return is up to 8.3% while draw-down comes in at a low and very respectable 7%.
3. Mean Reversion
What about mean reversion. Can we maybe try to sell shares of the best short-term performer and distribute the money to the others?

This marginally improves risk adjusted returns by further limiting draw-down to 6.78% while keeping annual returns almost the same.
4. Timing of the instruments in the permanent portfolio
Let’s use the good old simple average rule. If an asset’s price is below its own 200-day simple moving average then we sell it. If it crosses up then we buy it. Trade only on the beginning of the month.
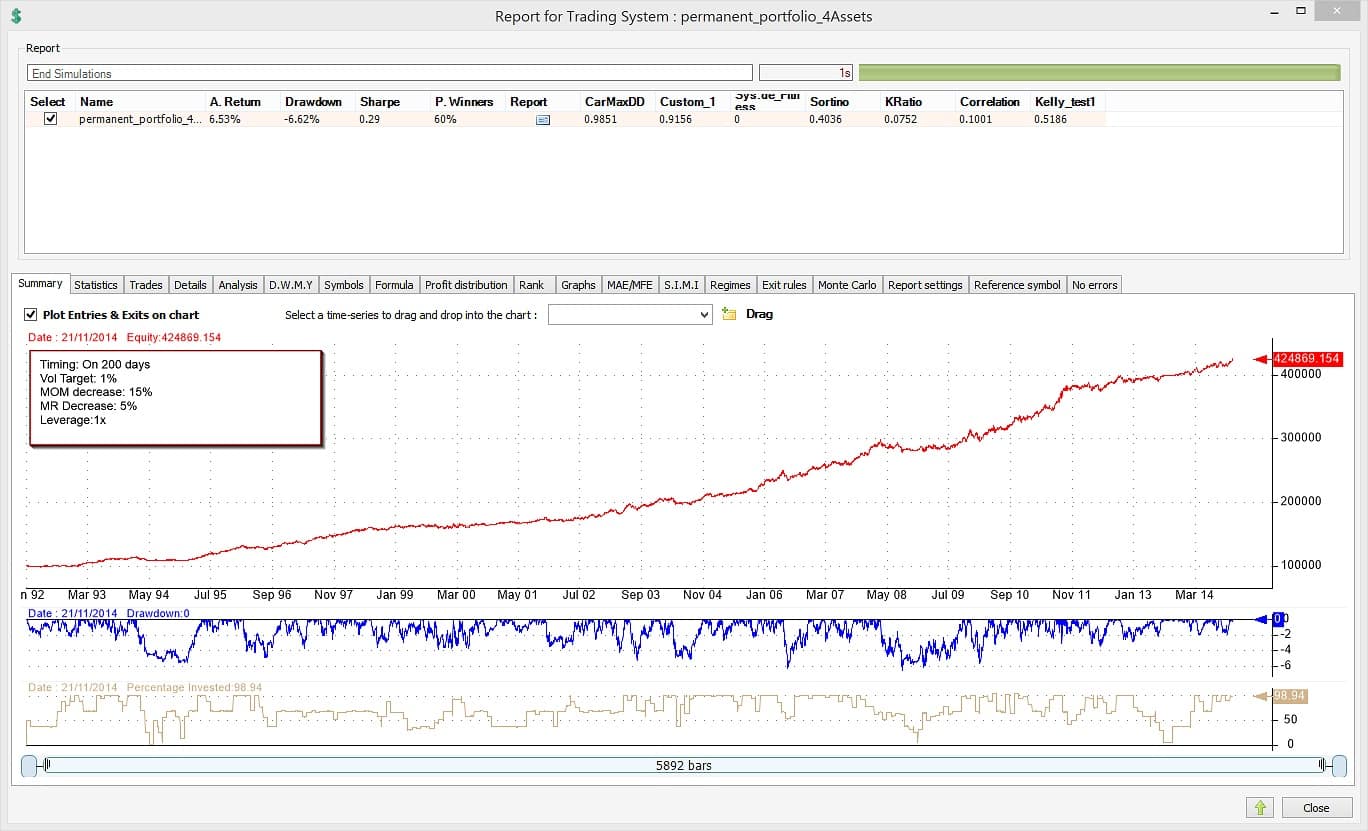
And to get things more interesting, let’s use leverage up to 2x. That the portfolio can be invested from 0% all the way to 200%.
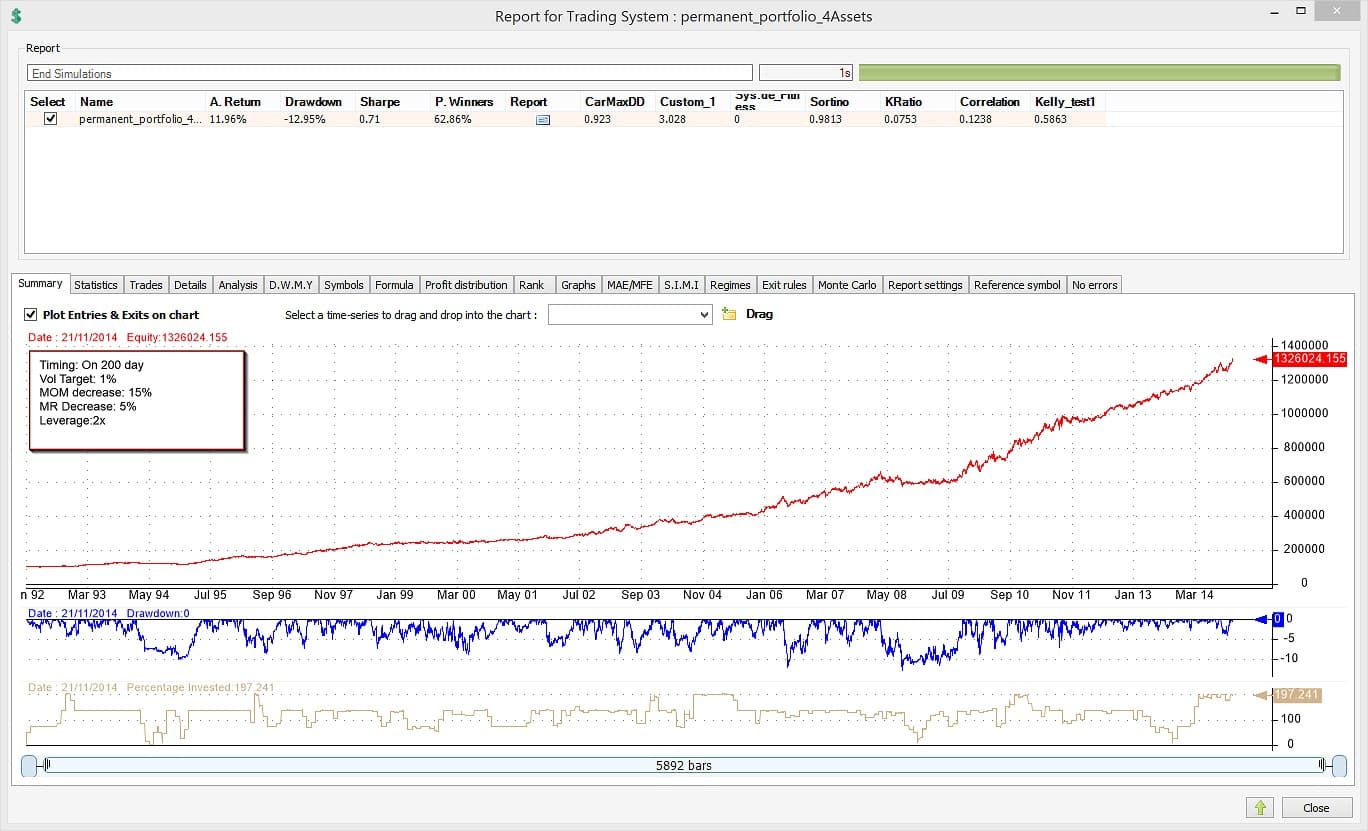
So now we are up to almost 12% annual returns with a drawdown of less than 13%.
What about over-fitting parameters. Let’s run a permutation of all parameters (10,401). We will assume no leverage (1x).
The mean for the CarMaxDD is 0.772381 with a standard deviation of 0.216059.
Modifying the Asset base of the permanent portfolio and using ETFs.
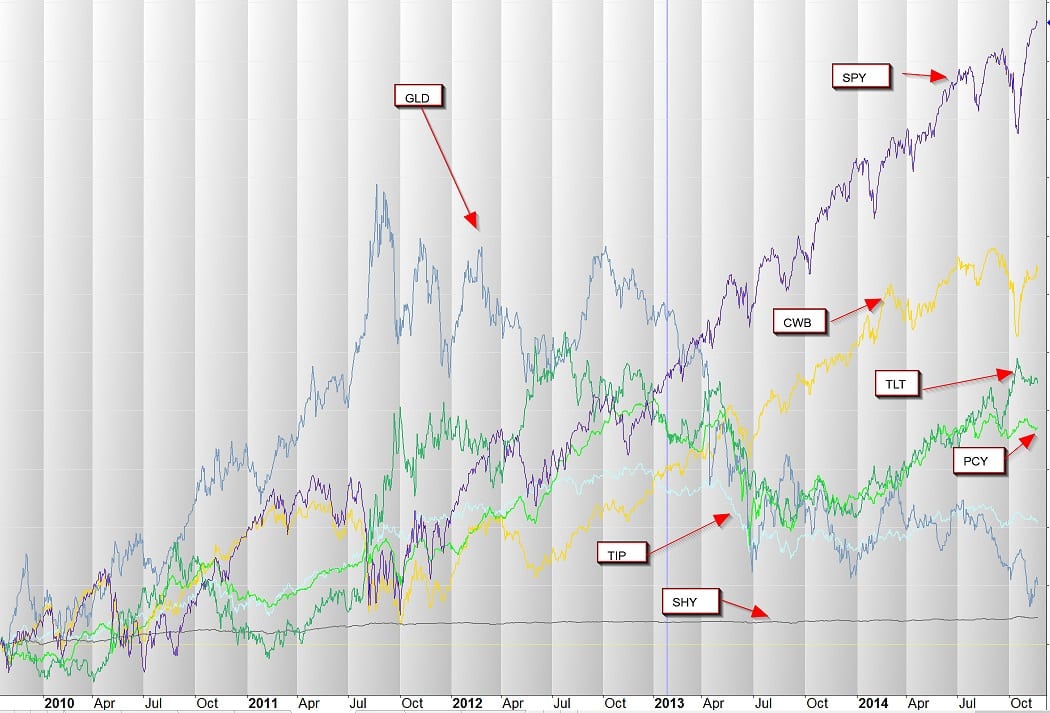
There is no single well-performing All weather portfolio ETF or Permanent Portfolio ETF, but nowaday there are plenty of ETF fund choices to build one. So finally in addition to the long term bonds let’s include some ‘newer’ asset class funds that were not easily accessible during the 80’s.
- Convertible bonds (CWB ETF)
- Foreign bonds (PCY ETF)
- Inflation protected Treasuries (TIP ETF)
First of all, you may notice that all three assets are less volatile assets, at least compared to the equity/commodities class.
Convertible Bonds lie somewhere between Bonds and Equities. They do carry a lower interest rate risk than straight bonds but also carry some equity-like risk.
Foreign Bonds is a diversifier out of U.S. debt. Inflation protection Treasuries also carry some inflation (albeit, limited) protection from interest rate hikes.
So let’s go ahead and backtest using these 7 ETFs. We will use all layers mentioned before, as well as 2x leverage.

Since there is a good chance of over-optimizing parameters we will go through a number of parameters to get a sense of robustness:
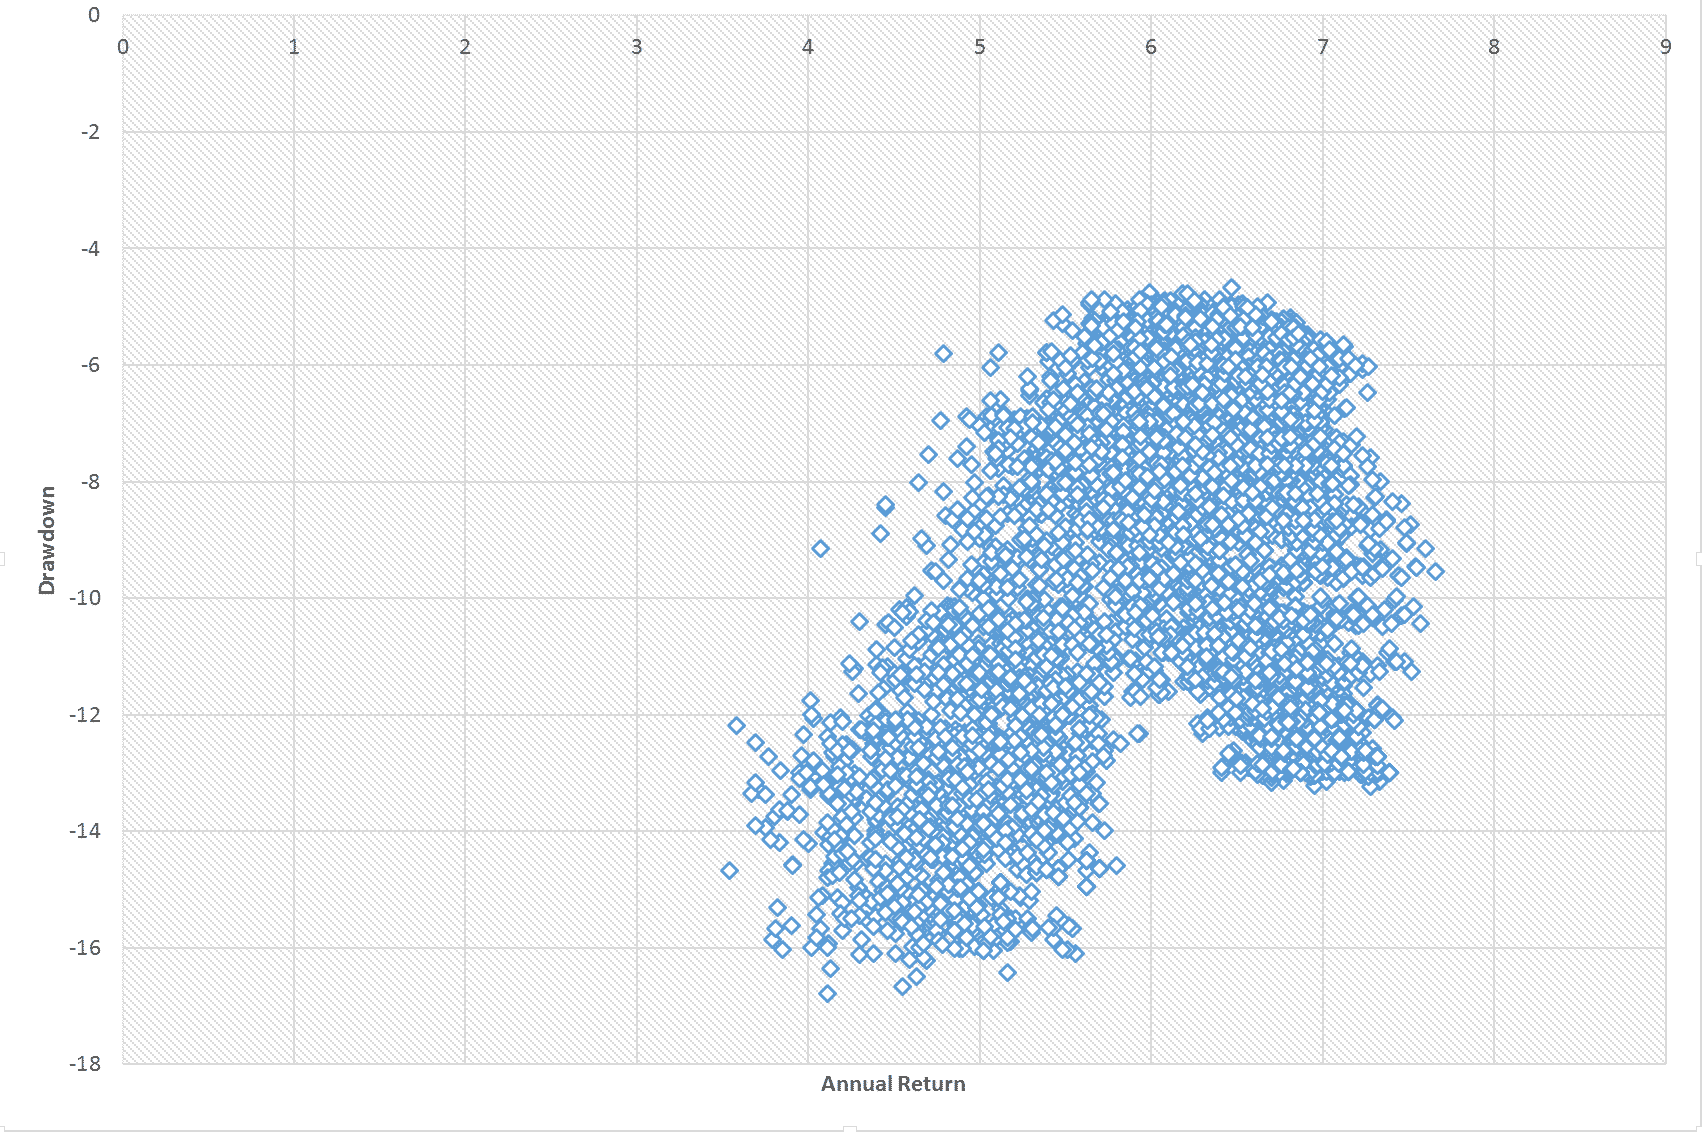
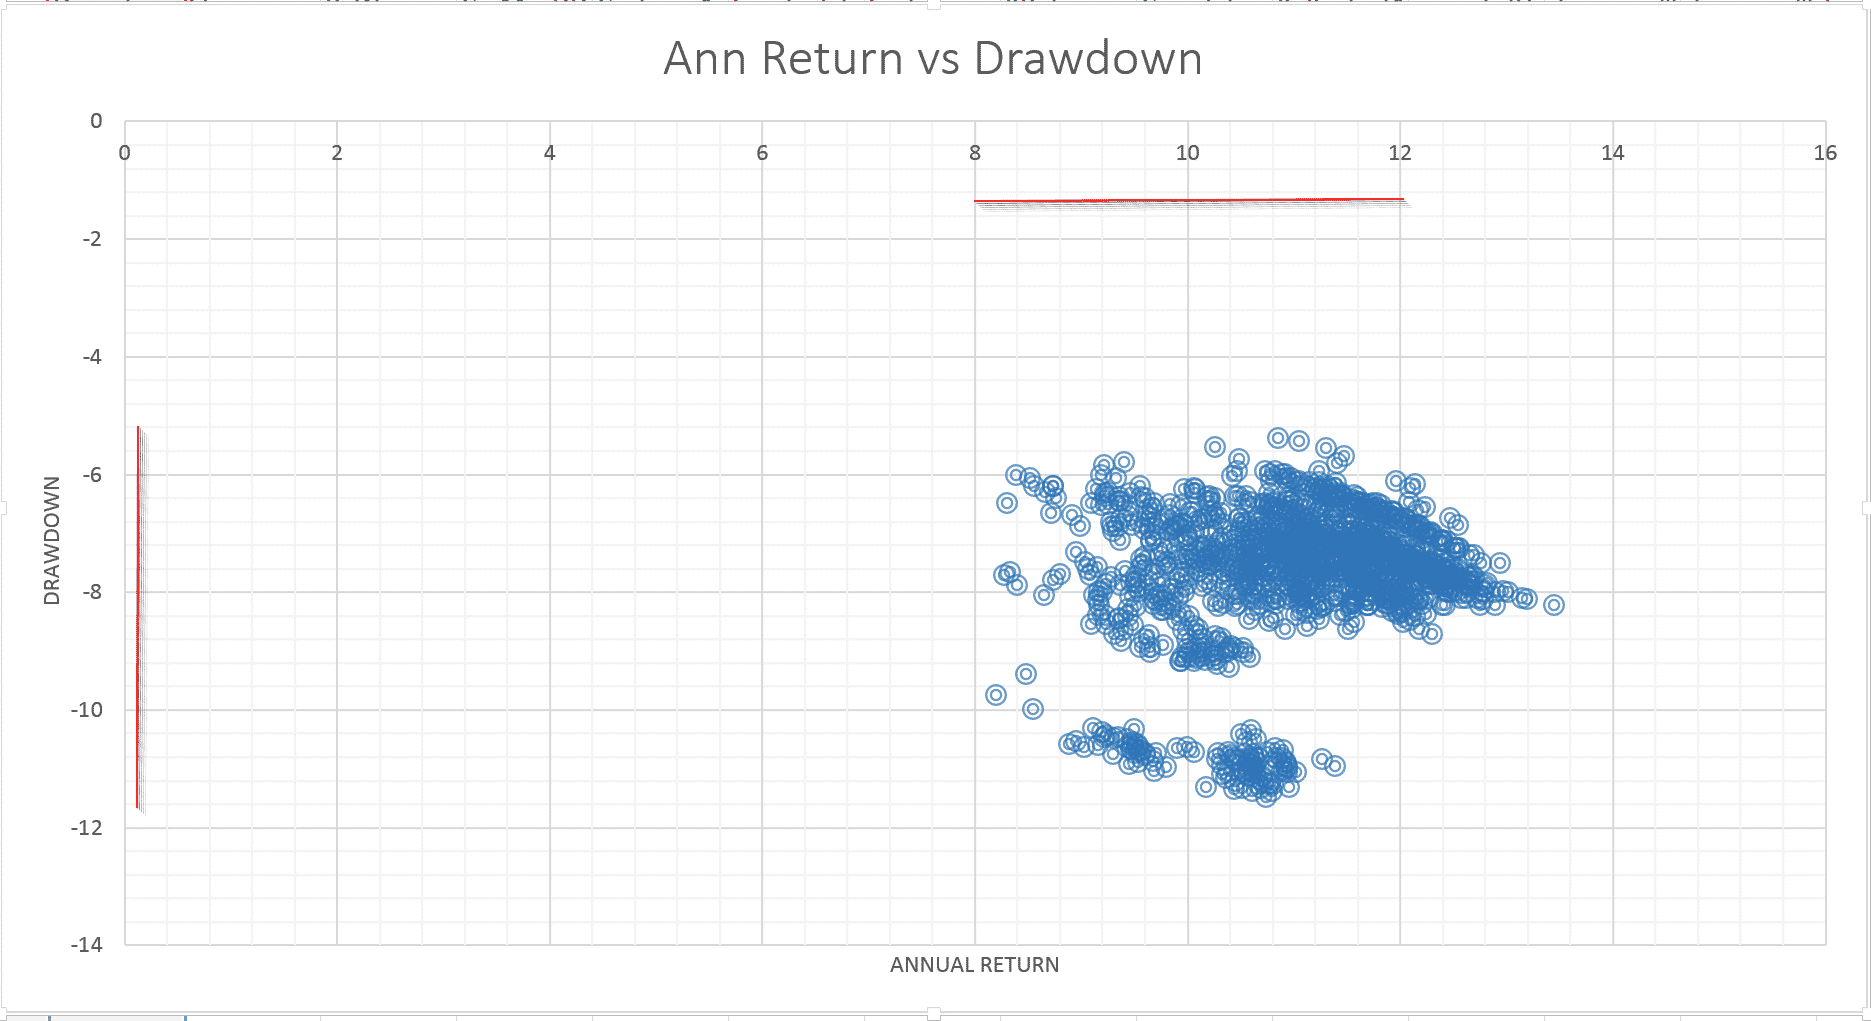
First, let’s look at annual return and drawdowns. Each dot is one combination of parameters. What we are interested in is the range of results.
Maximum drawdown is less than 12% while compound annual return comes in above 8%. Keep in mind that this system is designed for moderate growth with low volatility and risk. It is not meant to offer astonishing returns.
One more graph: Sortino Ratio and correlation to the S&P 500 index. Again we are looking for ballpark ranges.
Let me remind the reader that the Sortino Ratio is a risk adjusted metric similar to the Sharpe Ratio but only takes into account downside volatility. The correlation to the S&P 500 is important to many investors that already have active investments in equity. If the strategy is too correlated to the S&P 500 then it often does not fit into larger portfolios and could be replaced by the index.
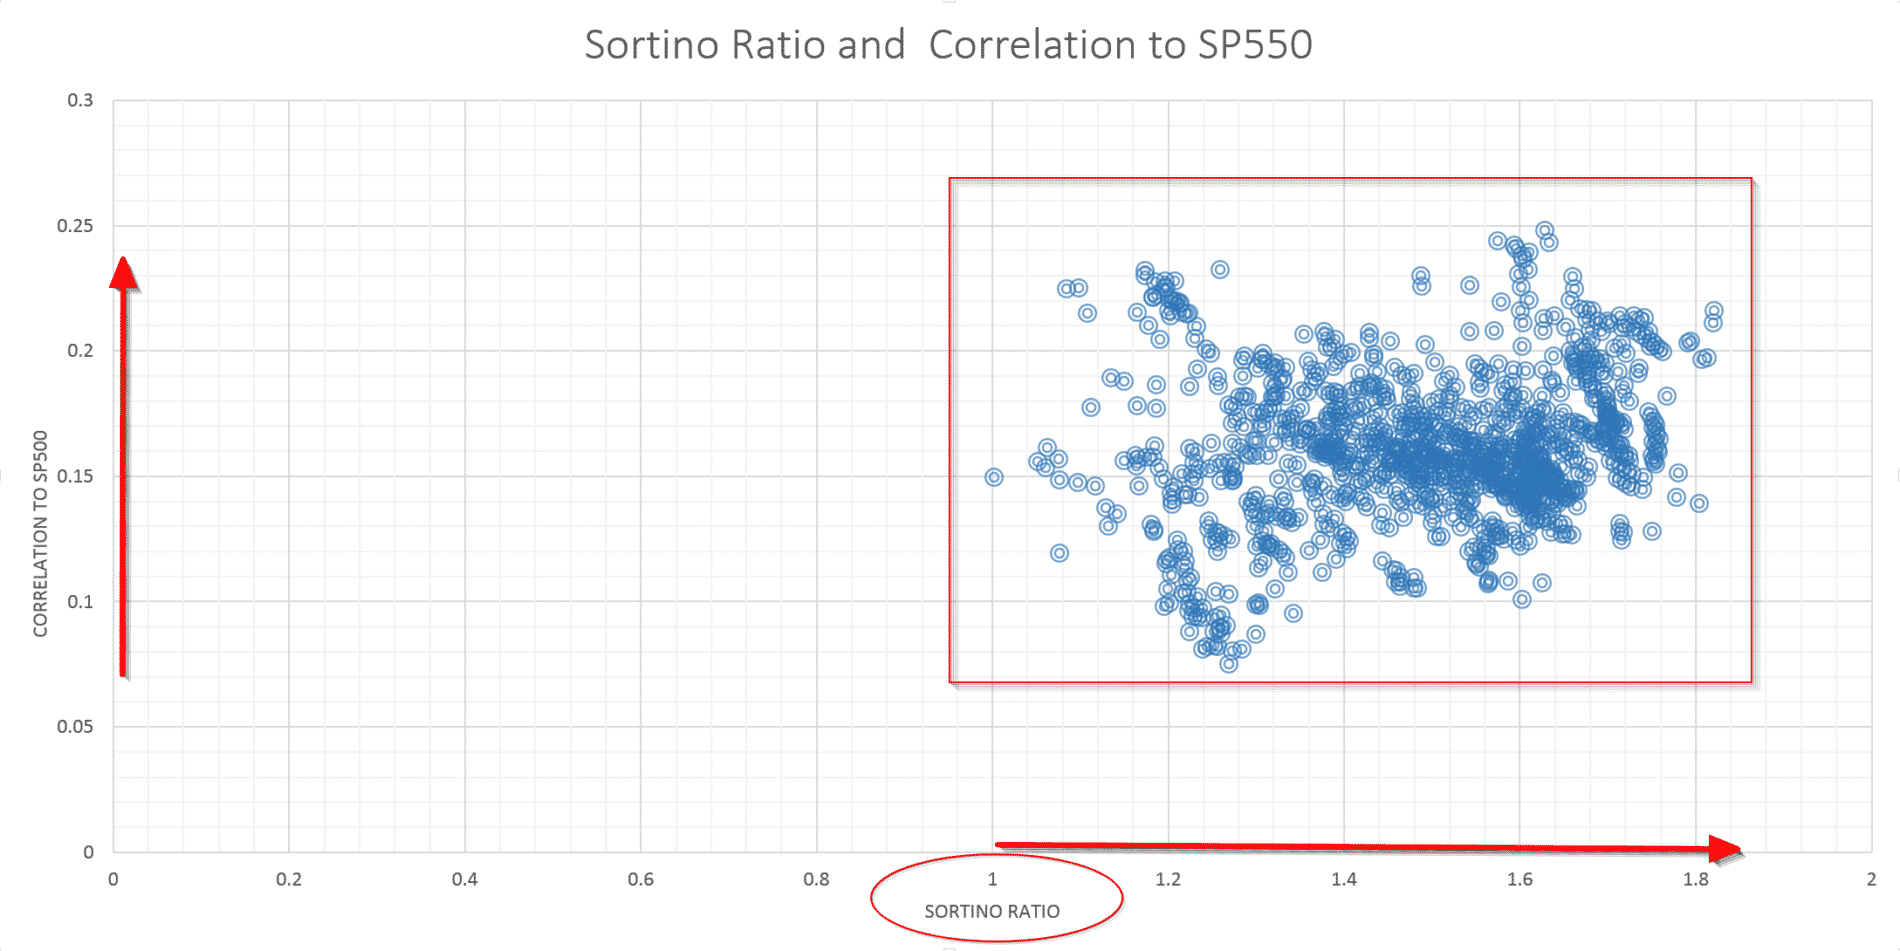
The Sortino ration comes in above 1 while correlation to the S&P 500 index comes in between 0.005 and 0.25.
Trading of the enhanced Permanent Portfolio
This strategy trades monthly.
There’are plenty of ETFs to choose from. As a stock index proxy one can choose from a wide selection that includes SPY, IVV, VOO as well as VTI, SCHB. For treasuries one can use TLT. Gold can be traded through GLD or IAU. And one of many options for cash is using SHY.
Conclusion
| Strategy | CAGR | MAXDD | Sharpe | Since |
| PP B&H | 7% | 18% | 0.58 | 1992 |
| Bug 4 | 12% | 13% | 0.71 | 1992 |
| Bug 7 | 12% | 6.7% | 1.41 | 2007 |
It’s always interesting to look to the past for ideas on strategy development. In building a core, capital preservation strategy one can go back to such strategies as Harry Browne’s Permanent and Bridgwater’s All-Weather Portfolio. The main feature of these portfolios is a price-agnostic view of the markets and basic protection by using simple asset and weight selection.
In addition, in their most basic form, they have proven themselves in true, decade long, out-of-sample testing.
So once the essence of the strategies are incorporated, there is no reason not to include more recent rebalancing practices that have been introduced by academia as well as quant research: Momentum, mean reversion, volatility targeting and the more controversial timing rules.
Four Asset Base case Permanent Portfolio System:
The base case system uses only the 4 core assets and variable leverage.
The system has a compound annual return of 12% with a 13% drawdown since 1992.
Most importantly it has behaved well in recent market corrections.

Moving Forward – Expanded Assets in the new Permanent Portfolio
On top of these ‘layers’ we introduce three more assets that provide a slightly larger opportunity for diversification and a slight bias towards increasing rates. The corresponding ETFs are CWB, TIP and PCY.
Since 2007 the expanded strategy gave an annual return of 12% with a maximum drawdown of 6.74%. An impressive number, especially the drawdown, for a conservative investor.
Too optimistic?
Running through a parameter’s test we still come up with Sortino ratios between 1 and 1.8 and drawdowns below 12%.
Robustness of the new Permanent Portfolio
But is there a bias in the look-back of the Timing rule? Is the 200-day simple moving average chosen “after-the-fact”?
Well, because of the multiple ‘layering’, results seem robust in terms of picking look-back period. In other words, momentum and timing are, in some ways, similar in their effect. If an asset underperforms, it will go underweight using the momentum rule until it crosses its own average and then will be sold. So shifting through parameters in timing or momentum will have less effect than if they stood as single rules.
As for selection bias, keep in mind that the main 4 assets have been tested ‘out-of-sample for some 20 years. The additional three assets, TIPS, Convertible Bonds and Foreign bonds are lower volatility assets that could provide an additional edge in the current environment and should not add excessive risk to the strategy.
Backtesting Bias of Browne´s Permanent Portfolio
Backtesting a strategy does not mean that backtested returns guarantee future returns.
It does mean that one has thought about the strategy and detailed it enough as to create rules that keep an investor disciplined and protect him from his own emotions and the daily market noise.
When an asset failed the 200d SMA test what did you do with its allocation? Keep in cash? Or distribute to other assets that passed the timing test?
How about creating a nice model of this subscribers can invest in?
Thanks for a great simulation.
Mike Begley
Dear Mike,
Thank you for your comment.
When an asset fails the timing test it is sold and the proceedings stay in cash.
You can subscribe to the strategy in our rent-a-strategy section.
https://logical-invest.com/rent-a-strategy/the-bug/
Thank you for your comment as it provides ample opportunity to clear up some possible misunderstandings.
You are correct. The Permanent Portfolio re-balances per your description and does not use leverage. It is a beautifully simple investment strategy. Interested readers can find more here.
What we are presenting is not the Permanent Portfolio strategy. It is a different strategy that we think is an improvement, especially when it comes to adapting to increased market volatility.
The strategy can be successfully employed without leverage. But even with leverage the average exposure of the strategy is below 100%. Overall exposure ranges between 35%-170% and leverage is used to compensate for ‘under-investment’ during volatile times or times that multiple assets fall below the 200-day rule. So at times it is far less invested than a static strategy that is always 75% or 100% invested. That being said, we understand certain account limitations and client preferences and we will include a non-leveraged allocation.
To be honest, I am a bit surprised by the last part of your comment. I am not sure which strategies you are referring to when you say we are “throwing stuff against the wind”. This is the very first strategy we have introduced since the collaboration started. We have done quite a bit of work in backtesting it and stress testing various scenarios. We regret that you do not find that to be enough. We have provided a detailed explanation of the inner workings and a fair amount of data to support it. Keep in mind that this is not how it is usually done. We would like to keep our strategies somewhat ‘open-source’ even if this opens us up to increased scrutiny.
Lastly, we appreciate you kind words in reference to Mr. Grossmann’s strategies. Rest assured that we are here to only creatively challenge Frank and by no means change or tamper with his current and future recommendations.
Hello Ed. I think it is important to understand the difference between Harry Brownes original strategy and the strategies we develop here at Logical-Invest.
First, Harry Browne developed his permanent portfolio (PP) strategy 30 years ago, but already 2500 years ago the Babylonian Thalmud was proposing a similar strategy which was investing similar parts in land, business and silver.
30 years ago, the market conditions for investors have been very different from now. Trading costs (commissions/spread) have been in the order of 2.5%. It is mainly due to these high costs, that Harry Browne had to minimize trading. Today I can buy a 100’000$ SPY ETFs for a commission of 2.5$. This means, that today, trading costs are nearly 1’000x lower. So, except from tax reasons, there is no reason to do less rebalancing if this can increase the return to risk ratio of a strategy.
The second fundamental difference of Harry Brownes permanent portfolio strategy compared to our strategies is that his strategy was a type of value investor strategy. Once invested you never go out of the 3 assets. You stick with it through every financial crisis and even buy more if an asset goes down.
To do such a type of value investing, you need to have a 100% conviction that Treasuries, the stock market and gold go always up long term. From my own experience, I have to say, that most of the time I really lost money was when I tried to do value investing. I know that commodities like gold can easily go to half its production costs which would be about from a max of 1900$ to 500$ and sometimes you need years until an asset recovers. I just don’t have the patience to wait so long.
Also I would not exclude the possibility that US treasuries, stocks could enter a 10 or more year correction somewhere in the future.
If the US economy really gets in serious trouble, like we had it with some European countries, then a strategy like the basic PP strategy has the potential to ruin you, because instead of having an exit, you get more and more invested.
Finally, there is for example a Permanent Portfolio Fund (PRPFX) which is replicating the original type of strategy. The results of this fund are not really good. The last 4 years, it is down 5%. Since 2000 the fund had an average annual performance of about 6%. If you subtract inflation, then there will not be much left. This type of investment is good to park your money if you don’t need it, but it does not allow you to live from your return.
I still think Harry Browne made an excellent choice by selecting these 3 assets and his investment methods have been the best way to go 30 years ago, but today we have much better possibilities to enhance such a strategy. The measurable result is a nearly 3 times better return to risk ratio.
By the way Harry Browne published the PP strategy first in the 1980s and later refined it in the mid 1990s. He died 2006, but I am sure he never thought PP as a strategy which never needs to be adapted or refined to new market conditions.
I agree that the original permanent portfolio strategy with yearly rebalancing would probably be the best to do for normal investors, but this is nearly a “buy and hold” strategy and I think with some relatively simple emotionless algorithms behind, you can do much better. Here is for example an interesting Article by Peter F. Way where he explains why “buy and hold” is not a good way to go anymore.
http://seekingalpha.com/article/2742915-why-buy-and-hold-doesnt-work-for-investor-wealth-builders
I also agree that the idea that US stocks, US Treasuries and Gold go down seems not to have a very high probability, but globally we had several quite big countries (France, Spain, Italy, Russia, Greece ..) which have experienced exactly this scenario. In all of these countries you would have lost a lot of money investing in Gold, local Stocks and local Treasuries. For the US the probability for such a scenario is much smaller, but by far not impossible.