In this article I would like to explain how to create a hedge strategy for an equity position, so that draw-downs, like the current one (December 2018), are minimized.
During this 10-year bull market, many investors have forgotten that investing only in equities can be quite risky. It has been simple to buy the SPY S&P 500 ETF and profit from rising valuations. This year-end 20% correction makes many investors reconsider safe haven assets like gold and Treasuries.
At Logical-Invest.com all of our core investment strategies are hedged. We experienced first hand the 50% drop in equities of 2008 and we like to protect our money from such large corrections.
Applying a Hedge Strategy to Reduce Drawdown
With this paper I want to show to construct a hedge strategy. We will use the Logical-Invest US Market Strategy as an example.
The US Market Strategy is composed of a US Market sub-strategy and a Hedge sub-strategy. The allocation between the two is updated monthly based on a lookback algorithm. A normal allocation would be 50% equities and 50% hedge. The maximum allocation to either the Hedge or US Market sub-strategy is 80%.
The US Market Sub-strategy
Instead of investing only in the SPY (S&P 500) or a similar ETF we designed a simple US Market sub-strategy. The sub-strategy switches between SPY (S&P500), QQQ (Nasdaq 100), DIA (Dow 30) and SPLV (S&P 500 low volatility) ETFs depending on market conditions. All of these ETFs are liquid and have very small bid/ask spreads so switching between them is easy and cost efficient.
In our backtests, the sub-strategy performed substantially better than a simple SPY investment. The average annual performance for the last 10 years was 18.4% compared to 12.7% for the SPY ETF. Switching to the defensive SPLV in times of increased market volatility has worked very well in the past.
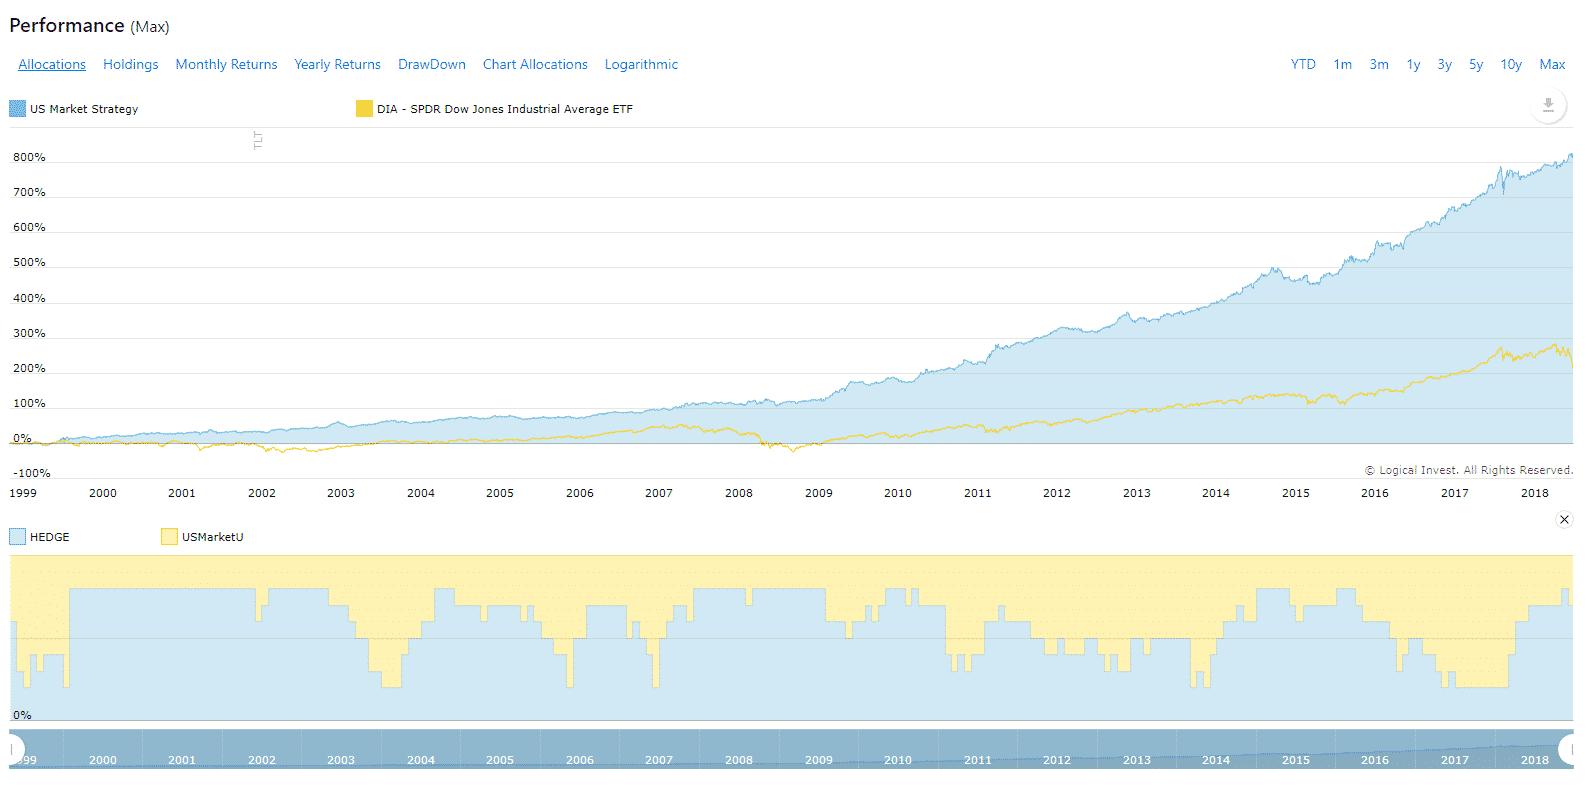
The chart below shows the 10-year performance, labeled as “Strategy”, as compared with the SPY ETF. The colored columns on top show how the strategy switches between the four component ETFs.
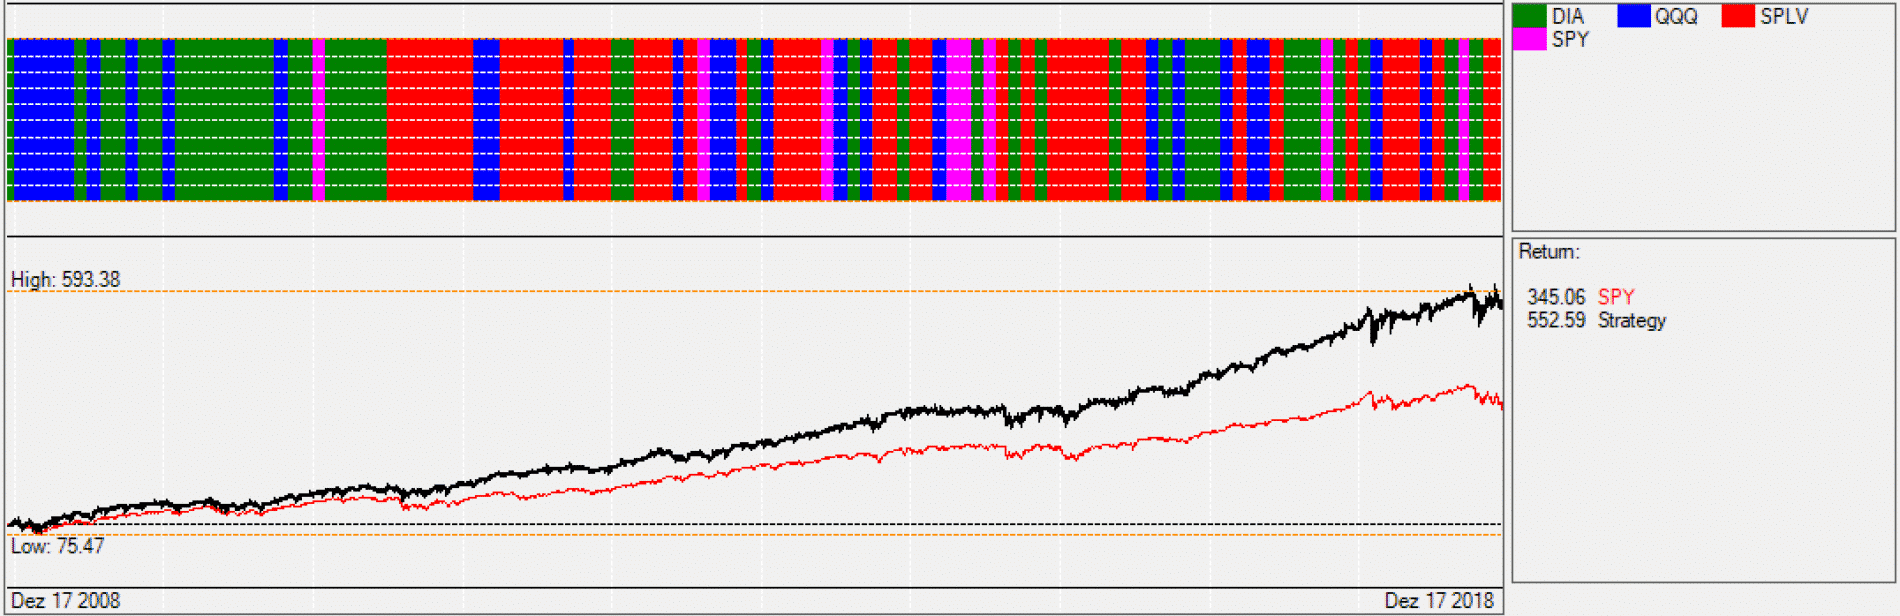
The next chart shows the 2018 performance of the US Market sub-strategy. The strategy invested in the low volatility S&P 500 ETF (SPLV) for extended periods of time, indicated by the red columns in the chart. You can see that in times of trouble SPLV performs substantially better than SPY.
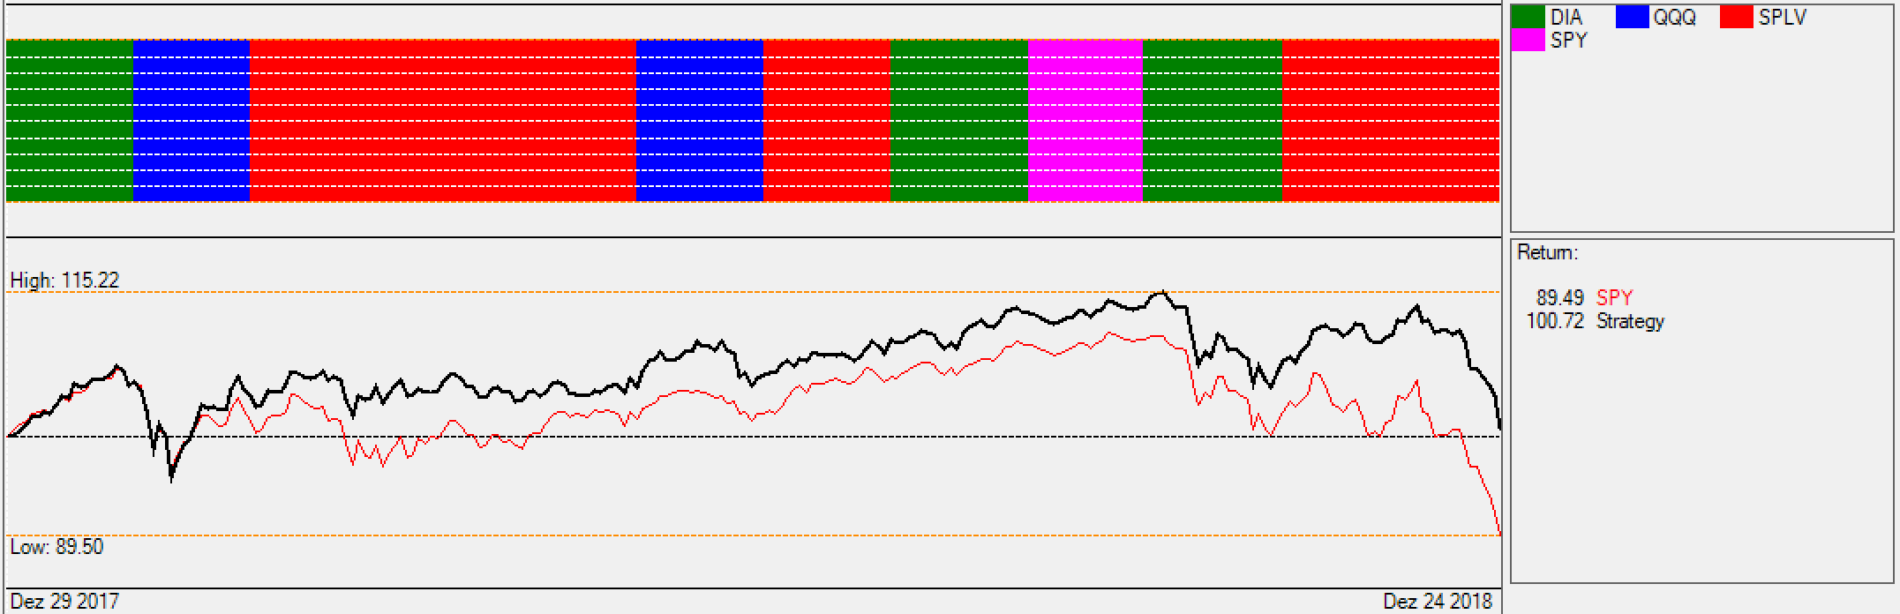
However, as you can also see in the chart, even SPLV will drop in a market correction like the one in December. The best way to further minimize the impact of a correction is to add a hedge to the strategy.
The Hedge Strategy
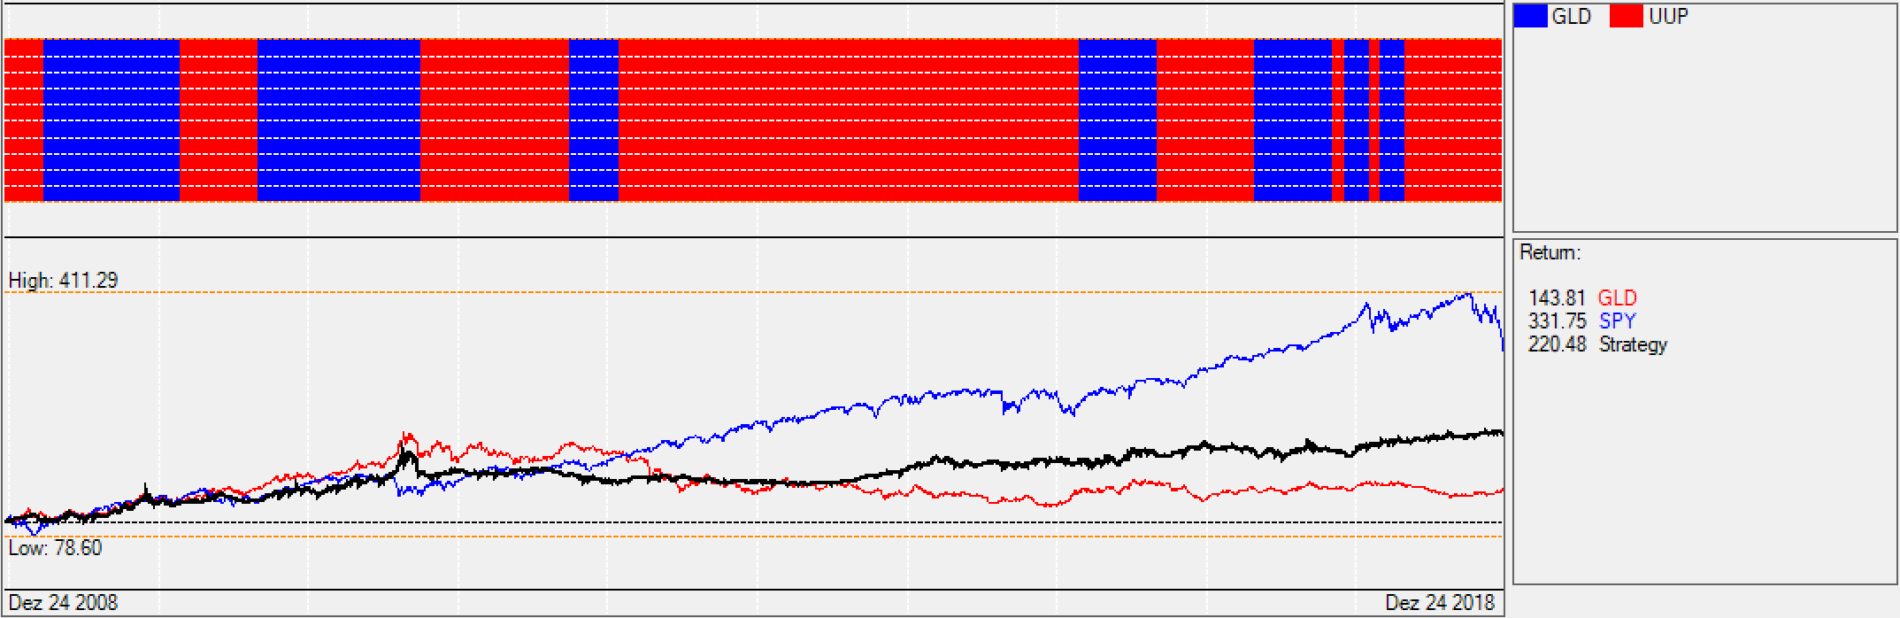
This Hedge strategy is a very important part of all of our strategies. It switches between a Treasury Strategy and a GLD-USD Strategy depending on which one is performing better (using a 42 trading day lookback period). The following chart shows how the Hedge switches between the Treasury Strategy (blue) and the GLD-USD Strategy (red). The combined performance of Hedge sub-strategy is represented by the black line labeled “Strategy”.
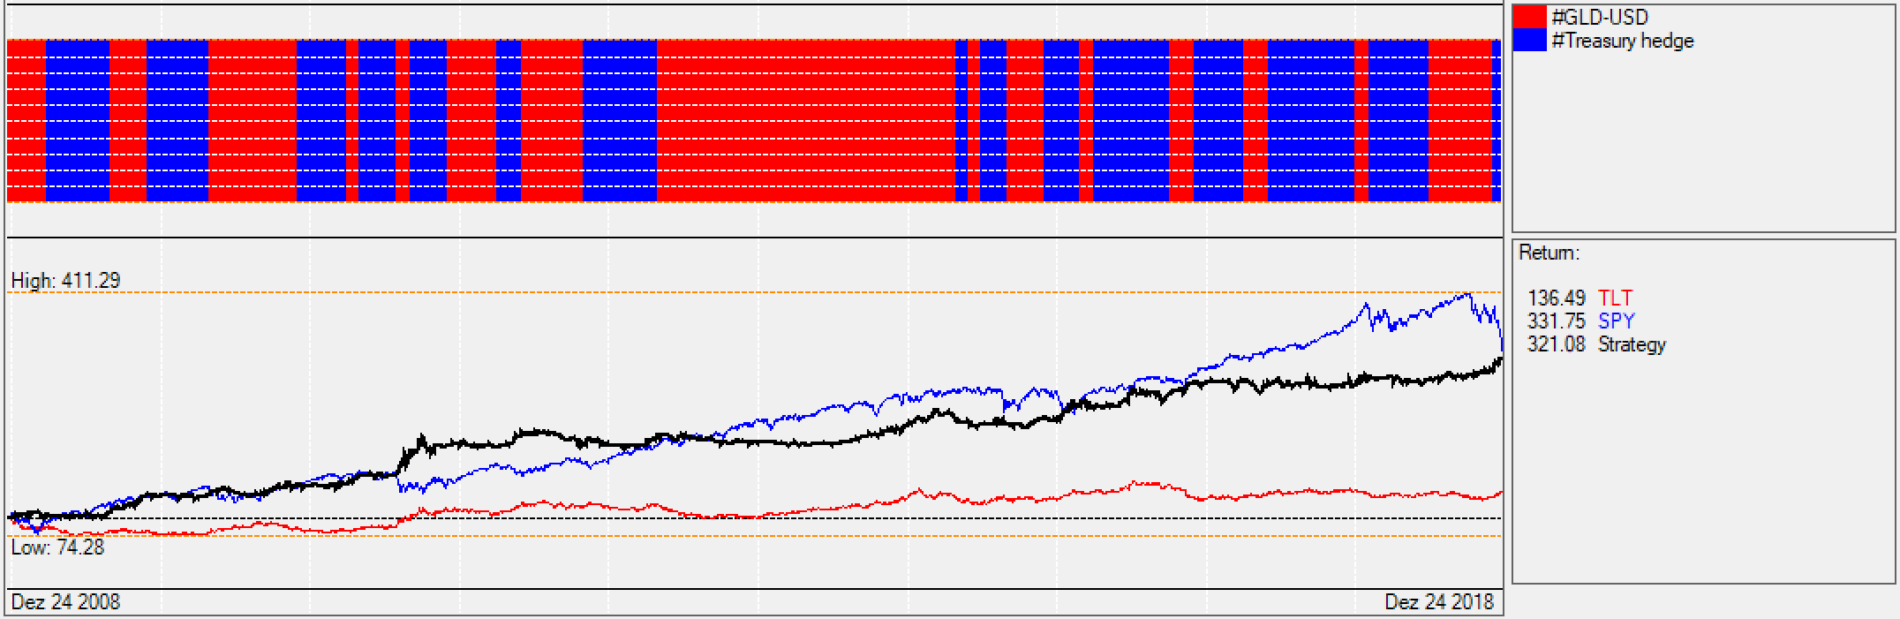
With an average performance of 12.5% per year the hedge strategy has been a good performer by itself. More importantly, it has no, or even negative, correlation to equity strategies. This makes it a good safe-haven for difficult market periods. In fact, you could use this strategy on its own without adding any equity to it.
The hedge strategy does not switch directly between GLD (gold ETF) and TLT (Treasuries ETF) as it would not be able to exceed a 6% annual performance for a 10-year backtest. The reason is that there have been long periods where equity was performing really well and both gold and Treasuries were under-performing. Adding a hedging strategy with poor performance can be quite a drag to the overall return of a strategy. We experienced this ourselves with an earlier strategy that used only TLT as a hedge. It is important to have alternative investments available to the hedging strategy beyond just GLD or TLT.
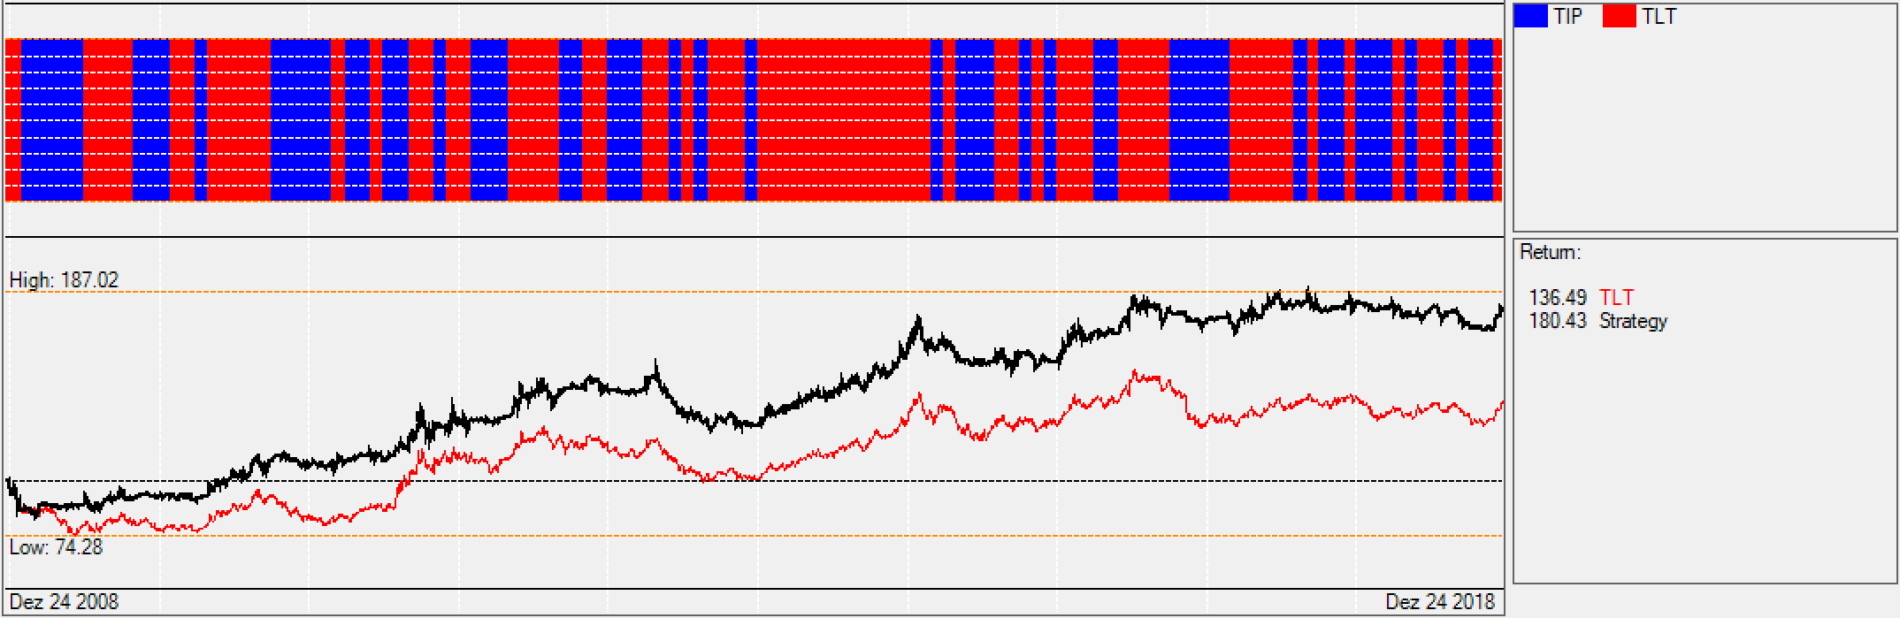
For TLT we had already developed the Treasury strategy in the past which switches between TLT (iShares 20+ Year Treasury Bond ETF) and the inflation protected TIP (iShares TIPS Bond ETF).
The chart below shows the return of the Treasury hedging strategy compared to TLT. With an annual performance of 6%, this strategy performs about twice as well as just the TLT with a 3% annual return.
In the Gold Strategy we switch between GLD and UUP (US Dollar Index ETF). These two ETFs have a negative correlation to each other and also a very low correlation to equities. Looking back at the market corrections of the last 20 years, UUP often acted as a safe-haven ETF. At every correction, at least one of these two ETFs gained in value.
The chart below shows the performance of the Gold Strategy in black in the bottom half. As you see in the allocation section above it, about half of the time this strategy was invested in the US Dollar index (UUP) and was able to avoid most of gold’s post 2011 decline.
Switching between these two sub-strategies (Gold and Treasury) resulted in quite a solid performance of the Hedge sub-strategy.
Combining the US Market and Hedge Sub-strategies
Our QuantTrader software is used to allocate between the US Market and Hedge sub-strategies with a maximum allocation 80% to either one. In the 11-year backtest chart below you can see the 2008 correction on the left where the new strategy allocated the maximum 80% in the Hedge sub-strategy (red). Notice how most of the time the combined strategy maintains a substantial allocation in Hedge. It is rare for it to go “all-in” and allocate the max of 80% to equities, showing the benefit of hedging to building long term wealth.
To determine the allocation to the two sub-strategies, we first calculate the modified Sharpe ratio for the past 172 days for every combination of the sub-strategies from 20%/80% to 80%/20%, then choose the best combination to use for the next month’s allocation. By using Modified Sharpe ratio we favor low volatility over performance.
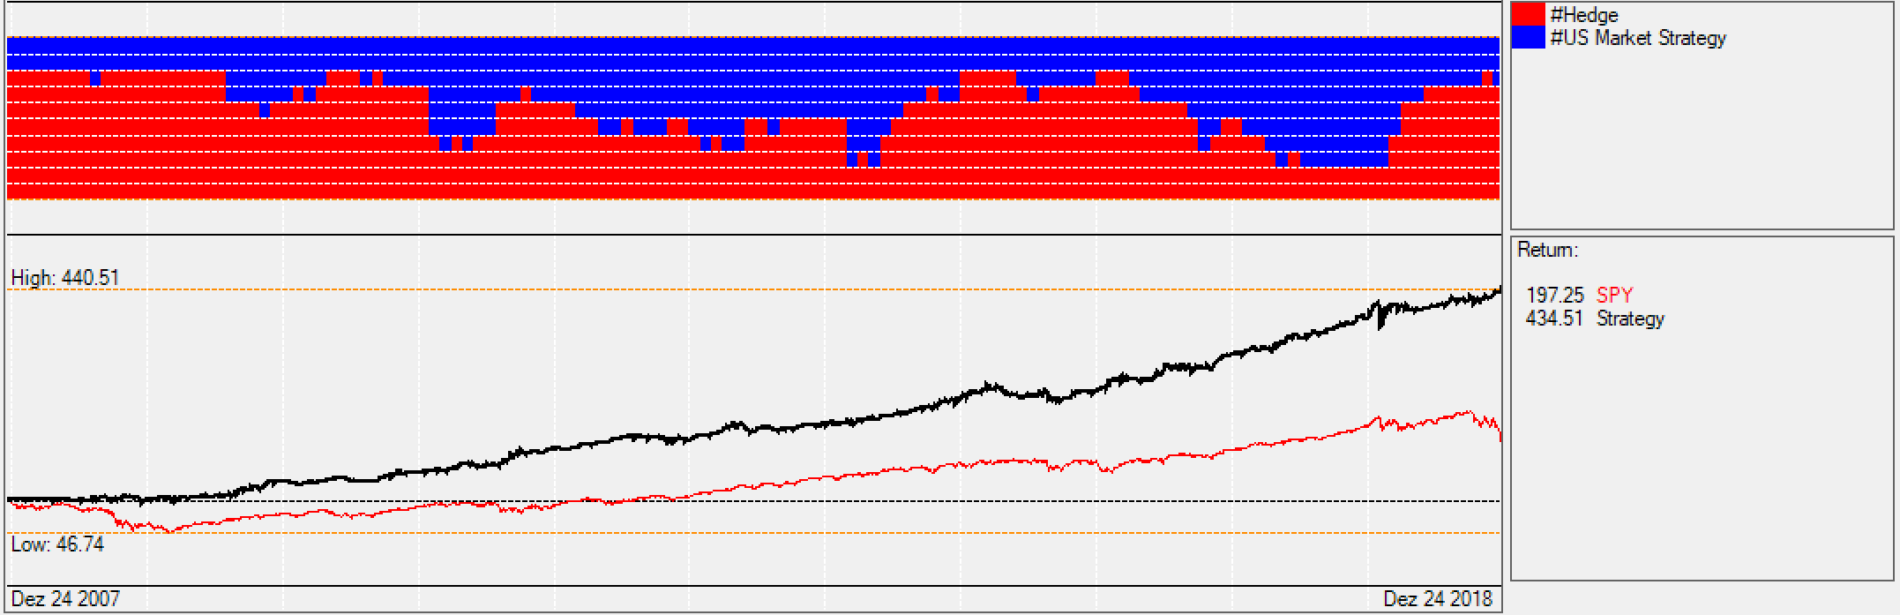
In the 11-year chart below, you can see the allocation of Hedge (red) and US Market (blue) on top half and the new combined strategy’s performance in the bottom half in black. The strategy did quite well during both the 2008 correction and this year’s correction.
For December 2018, the strategy is 70% allocated in the Hedge sub-strategy and 30% in US Market sub-strategy. As Hedge is currently invested in TLT and US Market in SPLV we have had very safe position through this correction.
The 1-year chart below shows the combined strategy’s performance in black in the bottom half and its allocations to the sub-strategies in the upper half.

The combined strategy’s performance for the 11-year backtest is show below on the line labeled “Strategy”. It is interesting to see that the Hedge strategy outperformed the US Market sub-strategy over this period. That is partly because it includes the 2008 market correction which was particularly hard on equities.

The Hedged US Market Strategy returns did quite well in the past, but just as important, its maximum drawdown was only 9.6% compared with 53% for the US market in 2008.
Finally, below is the 20-year backtest. The top section shows the performance of the two sub-strategies. The middle section shows the allocations to the combined strategy and the bottom graph shows the performance of the new Hedged US Market strategy, labeled simply as “Strategy”.
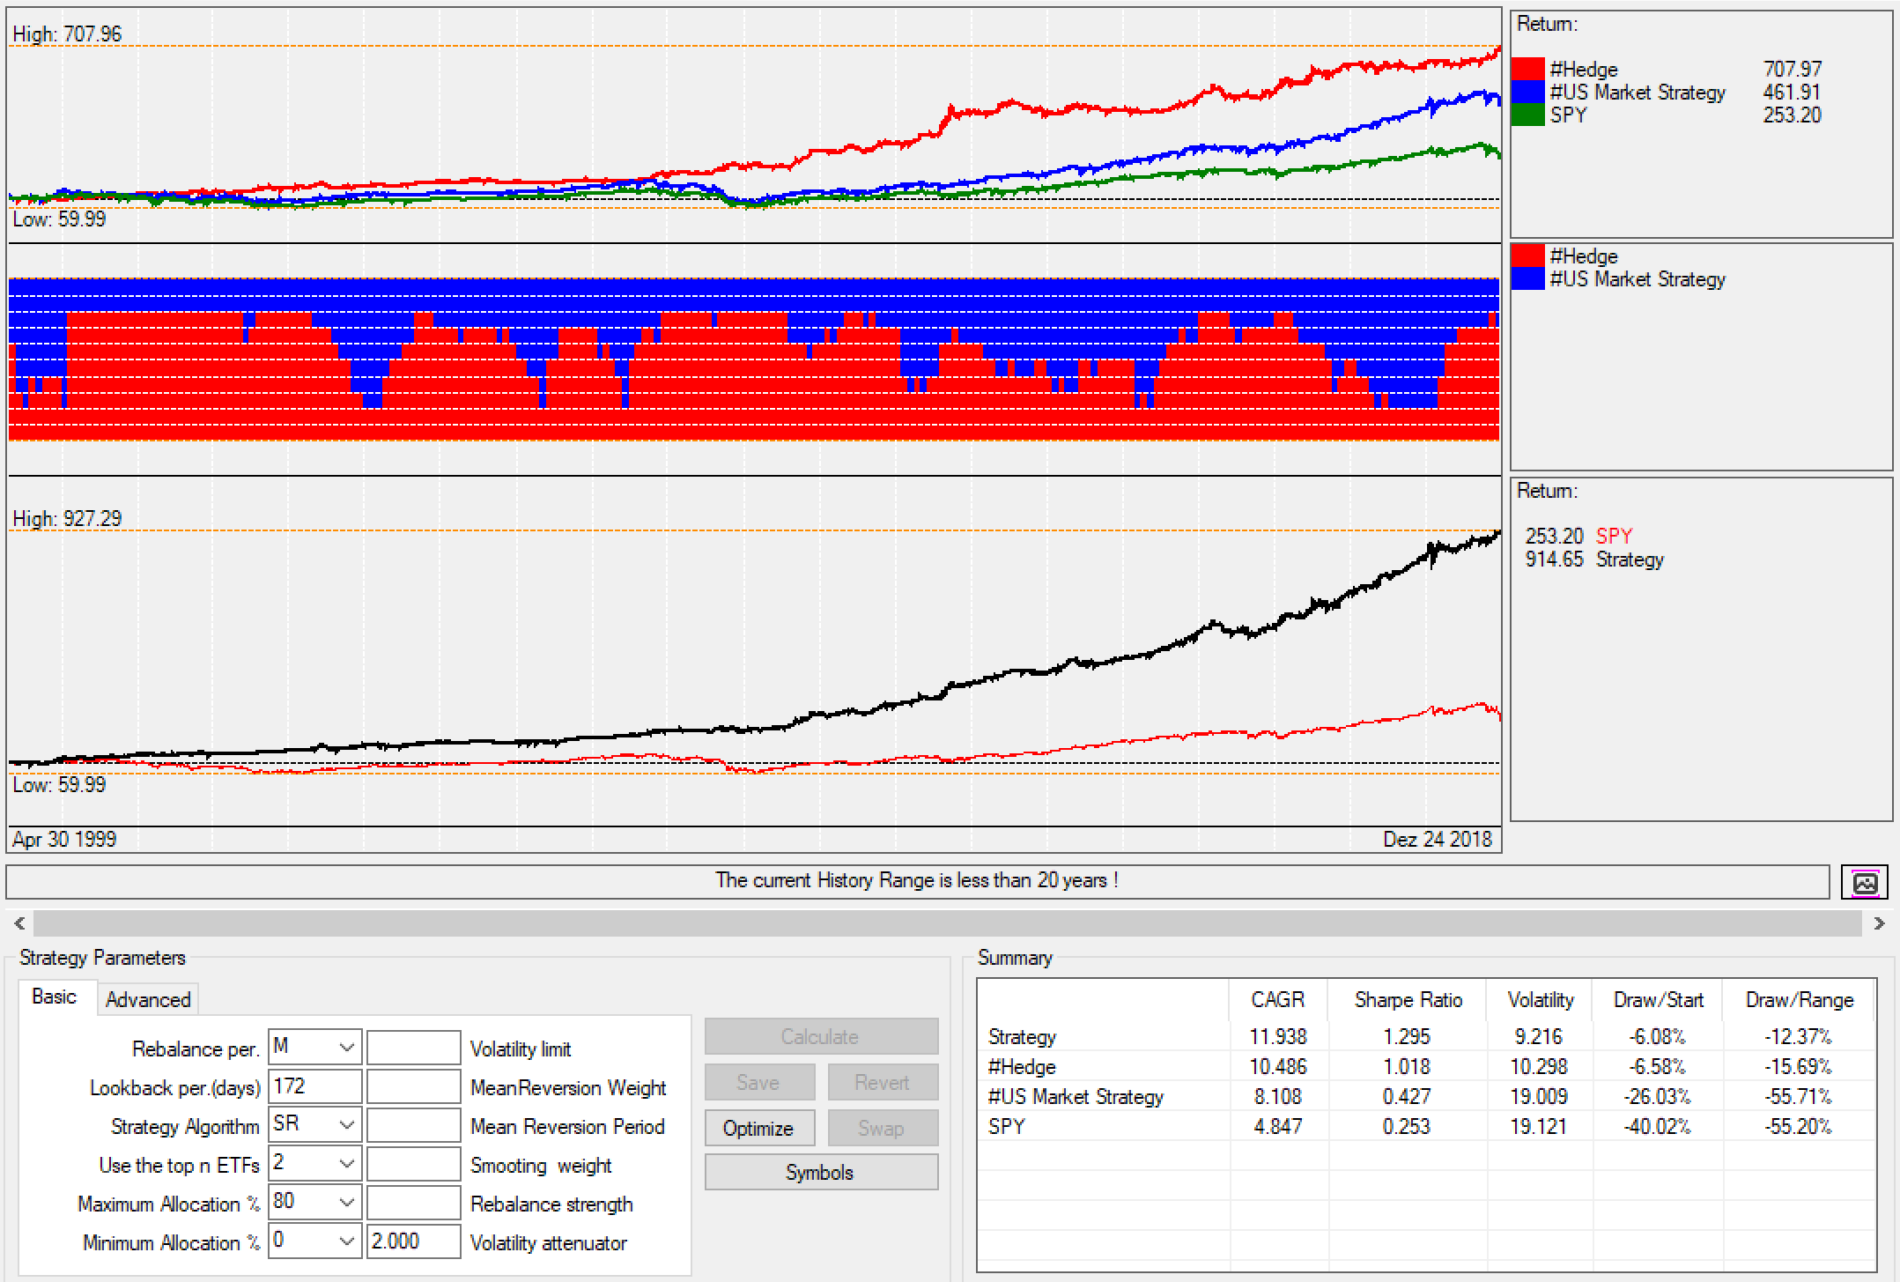
The strategy worked well for the last 20 years and the hedge allocation was always increased early enough to prevent big drawdowns during all major market corrections. This gives the strategy a high probability that it should also work in the future.
An updated chart with more metrics and details on the hedging allocations of this strategy can be found here.
Frank Grossmann
December 27, 2018