


Forum Replies Created
-
AuthorPosts
-
 Keymaster
Hi Michael,
normally the new releases do not affect the strategies, but rather the software functionality. So there is no need to transfer strategies between *.ini files.
Best practice in my view is to have two or three QT folders / versions. One for production, which you normally would not change frequently, and one or more for testing new strategies or portfolios. When you need to setup a new strategy in your “production environment” this needs to be done manually – question of a couple of minutes, and good excercise to understand the strategy from scratch. Either move your own strategies into the newly release version, or vice-versa.
Hi Daniel, Yahoo reports a 3/1 share split on Oct 6, so this explains the difference. See here: https://finance.yahoo.com/quote/ISRG/history?p=ISRG, now prices are already back-adjusted.
Hi Aati, night shift is mine, so let me jump in. We´re offering both the offline and online tools as our followers have different preferences, finally up to you to choose which you prefer.
The Excel tool comes with close prices from month-end – if you do not update them, while the online tool queries realtime prices once an hour, this explains smaller differences in shares.
Think I´ve just replied over email, if not pls let me know.
Hi Mark,
not sure if I understand you, here an example:
1) With 10,000 in cell C4: You assume you added 10k to your account at the beginning of week 2, so account total is 21k. In week 2 you make 2k of capital gains, so your profit % is 2k / (11+10k) = 9.5% or stated differently 23k / 21 – 1 = 9.5%
2) Without 10,000 in cell C4: You did not add to your account, so now the 2k profit are from the 11k you had in your account originally, that´s 2k / 11k = 18% or 13/11 – 1 = 18%.
Important is in this setup the assumption that you add the amount at the BEGINNING of the new week, if you want to add at the END of week 1 then need to change the formulae a bit.
Above is a simple calculation, but basically the same banks do the math.
Hope this clarifies.Hello Richard, I re-activated the option again – the default option was not putting the total in the last row, but now found a way. Hope that works for you, might need to do a CRTL+F5 to refresh.
We will only include the strategies we offer as signal service. For all others you need to use QuantTrader for building a custom meta-strategy.
And you are right, probably I was just trying to please my ego with the advanced optimization :-)
Here the new version: https://logical-invest.com/?gfid=15
Changes:
– Data structure updated back to Jan 2008
– Included US Sector Strategy
– Portfolio Optimized for period Jan 2008 – Sept 2008Pending:
– Post about newly optimized portfolios, now including US Sector StrategyHelp Needed:
– Have been battling with this now for two weeks, maybe somebody has a good idea: For the Portfolio Optimization want to include a min allocation and step size, e.g. for a min 5% and step size 5 possible allocations can be 5%, 10%, .. 95%, 100%. Sounds easy, but requires in Solver:
– Only integers e.g. allowed – this slows solver by factor of 5x
– The min allocation still requires 0% to be allowed for strategies with no allocation, this is not trivial to be
implemented with the constraints, and adding checks in cells slows down-
– Leads to corner solutions, e.g. solver does not find best solution, but sticks to a sub-optimal solutionsIdea for this is twofold:
– For smaller accounts a 2-3% allocation does not make sense from a transaction cost perspective
– For smaller and medium account sizes, it makes no significant difference whether 10%, 9%, or 8% are allocated to a strategy, this is a false accuracy which is easily eaten up by the estimation error of the optimization approach, thus think a 5% or even 10% step size might make sense.Current solution runs, but not stable and a simple run for one portfolio takes >10 min. If there is no feasible solution using the solver will try a brute-force approach, but this will also be painfully slow..
And the winner is this logo! We´ll announce the winning participant by email.
Hi Jason,
you can put all necessary strategies into one meta-strategy and fix the min and max allocation of each strategies to the desired % allocation. See here: https://logical-invest.com/forums/topic/showing-off-the-best-strategies-and-portfolios/#post-38652
Hi Larry,
don’t worry, everything still there, but currently doing an upgrade of the scripts which generate the data, and also the Excel and Online Portfolio Builder. Thought to finish by last week, but have some real headaches with some new functionalities..
So the current file will not update correctly, but this will be solved .. next days! Promise!
Btw, have you seen the “advanced” button on the first tab? This triggers the solver and some other tabs I hide for people who just use the pre-configured portfolios.
Dear members of the QuantTrader community,
we’re currently evaluating a new logo for QuantTrader, please help us decide with your vote for the current shortlist:
https://99designs.com/contests/poll/3e5ki7
… and one more thing: Not a $1050 IPhone X (:-)), but there will be a price awarded by random among all participants, so leave your name in the vote or comment this post with your favorite (#47, 85, 77, 54, 91 or 22).
Winner will be announced by 9/24,
Happy voting,
Your Logical Invest Team
Hi Mark,
you just need to account for the add/withdraw in the performance calculation, so add or subtract both in the past and current period. See example below. Hope this is what you’ve been looking for.
Hi Cal, yes, still both tools are in maintenance. The online chart is fixed now, the Excel still needs some days.
Hi Mark,
yes, that is the best way to describe. Sounds silly, but performance at the end is what you have in your account divided by what you had in the prior period. The new shares to own is total account value multiplied by new allocation %, divided by share price. Sorry if the sheet made it look more complicated :-)
Hi Mark,
yes, my brain just does it the other way around. 60 GLD / 40 YCS equals 60 GDL / 120 DXJ, total 180 so divided by 1.8 would be 33 Gld and 67% DXJ. So you dilute by a factor of 1.8, which means also returns, etc would be reduced by that factor .. bit less considering the loss leveraged ETF occur.
Your calculations are correct from what I see, but our way is slightly different. Instead of calculating in avg dollar and share terms, we simply re-calculate an internal index by multiplying the % invested with the symbol return. The outcome is exactly the same, benefit of using avg dollar and share terms is that’s it more intuitive, but indexing is just simpler.
Attached an Excel sheet with the comparison of both following your example, I ignored full-shares requirement.
Hi reuptake,
think we had this topic before, so same answer. Yes, we use same-day-close prices to calculate our signals and performance – and indeed our signal subscribers can only execute at next open – which indeed leads to small variances.
But as stated before, according to our backtests this variance in performance is in a range of +/- 0.5% p.a. – in some years even higher than what we report. As we´re advocating for a “lazy” monthly rebalancing within the first or even second trading day, we stick to the current way of reporting, which we feel is transparent.
If we´d use next-day-open prices for calculating performance, this would be not in line with the prices we use for cutting signals, not allow us to immediately report performance when we send out signals, and make things more complicated.
Lastly, and in big part to your request, our QuantTrader subscribers are able to cut signals and re-balance whenever they like – even intraday. Personally, being lazy by nature, I don´t do this, and also see no added value in my account.
Hi mlipsman, You´re normally interested in the return over a certain time period, let´s say since you started investing in a strategy, or since beginning of the year. This is why we publish the strategy returns YTD, 12 months, etc. In the charts you can even set your own time frames and see the return. For a portfolio of strategies you can do the same in the Portfolio Builder.
These returns always consider the dividend adjusted and fully re-invested (compounded) performance, and the varying allocation to the underlying ETF. Therefore they considers the average price you realized since a certain point in time. From that perspective it is not relevant if you calculate returns as re-balancing only the needed shares, or complete sell and re-buy (excluding transaction costs, which would hit you more if you did the latter).
So when looking at your portfolio since a certain time, and trying to match your performance to what we report, just take the compounded return over that period, and you see it will match – with a slight +/- due to different execution prices and transaction costs.
Not sure if I got and answered your point, if not please let me know.
Richard, thanks for the hint!
Frank is probably already in bed, so please use this link in the meanwhile.
Yes, seems to be a technical glitch in recent version, worked fine in all V30x, so please try this one – but might encounter issues due to later implemented functionalities you´d be using.
Hi Mark, simply download a fresh QuantTrader install and look at the setting and the included ini file. These include always the current parameter settings for all of our strategies. You can always keep different QT configurations and ini files in separate folders, e.g. one as playground, one for final testing and one for “production”.
Hope this helps
Hi Tanner,
pretty impressive list of custom strategies in your screenshot, congrats! Did you yet hear about our “Post One – Get 10 back from the community” promotion?
Sounds simple, but can you try activating the check box at the min 50% allocation? Normally this option works like a charm. Or pls send me your ini file by email to see in detail.
Hi Mike, welcome to Logical Invest!
we take dividends into consideration, as we use dividend and split adjusted prices for our algorithms. When investing current market prices are used.
Have the same in AVG, but can exclude the QT path under Options>Exceptions. Also have submitted QT to their false positive list and sent them a copy for analysis.
Wir hatten in den letzten Wochen immer wieder Anfragen von deutschsprachigen Anlegern die sich auf englisch nicht so sicher fuehlten. Daher nochmal der Aufruf: “Hier ist der Platz um von Frank und mir auch auf Deutsch verwoehnt zu werden” :-)
Hi Howard,
all of our strategies use medium-term trends, e.g. momentum in prices, volatility and cross-correlation within a normally 20-80 days window. Macro-events like the Chinese sell-off in August just make it difficult to detect these underlying trends, e.g. when markets are choppy there is not much of a trend.
For that purpose we always include hedging instruments like bonds, currencies and commodities in our strategies. In good times they add some performance, in bad times they minimize the impact of the corrections in equities.
Most important is: Never try to predict or time the market. With the benefit of hindsight of your comment made some months ago: Who would have expected such a strong equity market with so much complacency with volatility being below or around 10 in most of 2017?
You can now use the “consolidated signals” functionality of QuantTrader to calculate number of shares. See: https://logical-invest.com/forums/topic/quanttrader-software-updates/
see reply here: https://logical-invest.com/forums/topic/another-newbie-question/
IB has restricted three times leveraged ETF from their IRA accounts. You can instead use non-leveraged ETFs and increase their allocation to keep the intended leverage ratio. This dilutes the overall effect in the portfolio, e.g. you need to allocate less to GLD to keep 100% overall, but is the only way currently.
Alternatively, you can buy the 3x ETF in a non-deferred account as you mention. Buying puts also will not be allowed in your deferred account, and doing so in a regular account requires very good knowledge of the “greeks”.
Another idea for further diversification would be to add the hedge at the portfolio level, if you use QuantTrader. In other words, limit the hedging instruments in the individual sub-strategies, and then add either the BRS or an own hedging strategy at the meta-level. If you prefer the fixed-weight allocations from our online portfolio builder, you can now simulate this much easier with QuantTrader using the “consolidated allocation” feature introduced in version 500: https://dl.dropboxusercontent.com/u/43364046/Logical-Invest%20QuantTrader%20versions/QuantTrader500S.zip
Hi Ben,
even if ZIV is not a leveraged ETF and on the medium term part of the curve, it is still an aggressive instrument. THE MYRS provides some hedging with the TMF allocation, but still I personally would not allocate more than 25% of my investment to MYRS and/or ZIV. See August 2015 as example.
Has been a little quiet here in recent weeks!! Where are these great, second-to-none, unbeatable beast strategies and portfolios, guys?
Quantshare version 500 offers a lot of new features and interface improvements, give it a review and get your own diversified portfolio ready on the next rainy weekend: https://dl.dropboxusercontent.com/u/43364046/Logical-Invest%20QuantTrader%20versions/QuantTrader500S.zip
Give and you shall receive: Any rough strategy idea, complete portfolio or guest post article is welcome.
With more than 2000 people in the Logical Invest community this can be THE exchange everybody has been looking for, just takes some guts to press the “post” button.
Thanks for the hint, Tom, will give it a try.
The new QT version 500 now includes the signal consolidation, e.g. calculation of shares to rebalance: https://dl.dropboxusercontent.com/u/43364046/Logical-Invest%20QuantTrader%20versions/QuantTrader500S.zip
Charlie, here version 500: https://dl.dropboxusercontent.com/u/43364046/Logical-Invest%20QuantTrader%20versions/QuantTrader500S.zip
Hi Charlie,
please try version 500, which has further options. A fresh data download for the standard portfolio takes no more than 5 minutes.
Hi Petr,
there is no direct way to set leverage in QT. Easiest is to upscale the allocations outside QT before doing your rebalancing.
For example, if you´re using strategy A with 60%, B with 80% and C with 60% (total 200%), then you´d use 30%, 40% and 30% in QuantTrader (or let QT decide dynamic allocations), and double the allocations at ETF level before rebalancing.
Hi Doug, when going long TMV, e.g. short bonds there are two things to consider:
– Bonds have historically a negative correlation with equities, and the historically have peaked in crisis times, e.g. when equities fall. Shorting TMV will further add to the downswings of the rest of your equity portfolio, and you loose the hedge we´re normally are looking for.
– In addition you´ll loose from the daily roll costs of these leveraged ETF, which is roughly a 6-8% p.a. Same as TMF, but there the correlation plays in your favour.Combining a long SPXL/TMF with a long SPXS/TMV might work if you choose a shorter look-back, probably in the 20 days range, to catch the short term equity moves as a mean reversion. QuantTrader will tell you, and please share your findings with the audience.
I just doubt whether long term it´s worth loosing the hedging properties of a long bonds position to benefit from the anticipated rate hike- which has been moderate compared to the expectation of the dooms-day sayers.
Hi RD, just working on an article about SPXS-TMV, will be out next two weks. You´re right, no big difference between going long SPXL/TMF or shorting the short SPXS/TMV pair, some 6-8 points p.a. from harvesting the roll-losses of the leveraged shorts. Interesting enough, these vary a lot from year to year, so it´s not a “guaranteed” win to short.
Be careful when comparing the two, we´re long TMF or shorting the short TMV, so both are at the end long positions and would suffer in a similar manner from a continued hike – no difference there.
Hi Greg, probably the table had not been updated yet after the close when you looked at it – that´s done over night. Currently the strategy is down 2.8% since month-end, see here: https://logical-invest.com/portfolio-items/3x-leveraged-universal-investment-strategy/. We only switch once a month, so no change in allocations.
I also had some ETF in the error list after the first try, but after reloading with “retry” it worked fine.
This series of articles is one of my favourite, great stuff! Also make sure to read their “Adaptive Asset Allocation – a primer” whitepaper, excellent and I love these guys!!
We´ve replicated their strategies and get very close to the results they report, very trustworty and solid stuff. And their “Select Top X ETF based on Momentum and Volatility” is actually very close to our methodology in QuantTrader
… we leave it up to our valued followers to judge which is better :-) Public P-Contests are not our style, instead here just a Hip Hip Hurray to Adam Butler and gang!!
I agree to both.
For me drawdown (and time to recovery, or duration) also is a very important soft KPI when looking at an equity line, and trying to figure out if my stomach can handle it. Finally, for most investors, drawdown (not CAGR, Volatility or Sharpe) at the end is the killing factor which makes them (..us) abandom a strategy. I think these are the points in the line of Richard.
On the other hand, I also agree with reuptake. Drawdown, or Maximum Drawdown to be exact, is only describing a historical one-time event within the timeframe of the equity. So statistically it is a weak measure, how frequently is the equity “under water” overall, how long and sharp are the corrections? Was that Max Drawdown due to a specific reason with high or low probability to repeat in future? Ulcer index or MAR improves some of the deficiencies, but is also harder to be interpreted..
So at the end, DrawDown for me stays an important SOFT measure when manually looking at equity curves, but one needs to be aware of the short-comings when it is to statistically evaluate or compare strategies..
And just to throw a new one into the round: R2, or the Coefficient of determination (https://en.wikipedia.org/wiki/Coefficient_of_determination or http://www.morningstar.com/invglossary/r_squared_definition_what_is.aspx) is a measure I´m looking more and more at. In simple terms it explains in percentage terms how close an equity curve is to a straight line (on a logarithmic scale), something we´re finally looking for.
Tom addedd a new thread about this measure recently, and it may also serve as answer to a question by Joachim some weeks ago on how to measure how good a strategy is performaning after inception compared to the backtest: If the R2 after inception is lower than the R2 of the backtest, it is a sign of weakness, or even curve-fitting..
Maybe this is a way to go?
.. may the discussion continue..
This is one of the next features to be released.
Hi Gordon, please see this thread: https://logical-invest.com/forums/topic/setting-up-assets-and-asset-lists/#post-42780
Hi Marc,
we´ve so far not done a white-paper on the Stoxx 600 strategy. But the drivers are similar to the Global Sector Rotation, e.g. single sector ETFs, not as complex as the US Sector rotation with different sub-strategies.
The ranking is based on Sharpe Ratio of last 52 days, e.g. volatility attenuator of 1, plus a mean-reversion correction considering a 15 days timeframe.
The strategy is rather meant as input for developing further EU based portfolios, just to show-cast how to manage data input and currency. For the time being the data availability is a main constraint.
Since we have @Rishi in the loop, let me bounce this directly to him :-)
Yes, trying to have the next one within July timeframe.
Hi Cal, yes, this is one of the next features to be released – after we get the data connections stable..
Tom, as you commented over the phone, in the long run probably the way to go is probably a cloud-based QuantTrader, which would allow more computing power and alliviate some of the data issues. Let us discuss this further, very much appreciate your input.
Hello Richard,
indeed it´s currently not easy to merge strategies between different ini files, need to see if we can come up with such functionality in future, but probably will take some time.
What I personally do is to keep different QT folders, one only with strategies I use in my real trading, one for testing new portfolios and one for “playing around” with +50 different strategies and sub-versions.
Whenever we release a new portfolio or strategy with a new QT version, which I feel worthy to go into my trading , then I manually replicate it – this also helps me to perfectly understand it and get ideas of how to adapt it to my own trading style. Takes 20 minutes in average, which I consider worthwhile..
… but again, a merge functionality might be usefull, I chime in :-)
.. here it is: https://logical-invest.com/spdr-etf-sector-rotation-strategy-model/, and by end of June also in online and offline Portfolio Builder.
We´ll include the newly launched US Sector Rotation Strategy in both the online and offline version towards the end of June.
Think we have addressed this in another thread, but just as clarification here again:
The allocations shown as popup when hovering over the chart are the historical allocations up to that date. The new – or future allocations from the last day shown in the chart are shown in the bluish box at the left of the backtest window. Will make this eadier to read in future QT version.
Hello Howard,
do not think we´re going to lauch leveraged versions of the GMRS or WorldTop4 strategy – at least not as a subscription service. It would be very interesting though to test some versions in QuantTrader, see here for a discussion thread of other strategies from the community: https://logical-invest.com/forums/topic/showing-off-the-best-strategies-and-portfolios/
And if you have not so far, give QuantTrader a try with our free trial: https://logical-invest.com/rent-a-strategy/backtesting-software-quanttrader-free-trial/
here a strategy with biotech stocks Tom Gnade came up with: https://logical-invest.com/forums/topic/showing-off-the-best-strategies-and-portfolios/#post-40451
While not trying to make any predictions, see the impressive ramp-up of ZIV since early 2016 – and be aware of the similarities with the 2012-2015 time-frame – and the correction in Aug 2015.
https://www.barchart.com/etfs-funds/quotes/ZIV/interactive-chart
VIX continues at historical lows (3rd percentile, e.g. 97% of all times has been higher), and we´ll see it moving higher – question is when. MYRS is an aggresive strategy with 23% historical volatility and +20% drawdowns, it is important to diversify it with other strategies. This is something I also have to remind myself from time to time..
Hello Edmund,
thanks for the comment! It is important that you review potential tax implications and ways to minimize them with your tax accountant. Our follower base covers many different countries and tax regimes, so it is not possible for us to dive into all potential aspects – hope for your understanding.
Hope there are other community members who can further comment on this.
Hi Jared,
the dynamic allocation was introduced with the Universal Investment Strategy, see detailed description here: https://logical-invest.com/universal-investment-strategy/.
We then adopted it in all other strategies as well, but on purpose did not change the original white-papers – sorry if this is confusing. If you need any further clarification please let us know.
Sorry for the delayed response, somehow missed your question. We´re aware of the ongoing discussion regarding liquidity concerns in especially bond ETFs, where it seems the tail is whagging the dog, that is trading in the ETF surpasses the underlying instruments, thus potentially leading to pricing effects and concerns regarding liquidity in case of a market correction. Personally I´ve not been aware of the discussion you mention about high-yield bonds, but it seems related.
My take is that while such concerns might be reasonable and probably further increasing due to the ongoing rise in popularity of ETFs vs. underlying instruments and MF – what would be a valid alternative for passive investors? Investing directly into (high-yield) bonds of 30-50 companies, futures or more exotic and less liquid instruments? Completely staying away from (high-yield) bonds?
Following the discussion and being aware of the potential impact is important, but as long as there are no valid alternatives I´d not take an aggresive stance.
Not sure if this is what you´re looking for, happy to continue discussion,
AlexTowards end of June we will update both the online and offline tools to include the newly launched US Sector Rotation Strategy as well, plus some other feature requests.
Deshan, thanks for the note, very much appreciated. We´re working hard to keep us – and your portfolio – at the top!
04/17/2017 at 10:22 pm in reply to: Using synthetic data or external data sources in QuantTrader #40457Yes, fully agree. It was just easier as an example to start at the earliest data as base. Actually best in this case would be to use actual TMF as far as possible, and then plug the 3x TLT below, just a bit more complex to implement.
A recently added feature which is very handy, but probably we´ve not highlighted enough is the option to pull intraday prices into QT.
Why is this handy? Because it allows you to execute your rebalancing at-close with “fresh” intraday strategy signals.
For example tomorrow, March 31st, 2017, you can refresh intraday prices at 2pm EST, and comfortably execute before close of the markets – and relax over the weekend, while we cut signals for our non-QT subscribers.
Here a short instruction:
1) Open QuantTrader
2) Reload the Historical Data
3) Verify the intraday prices in the “Show Stock Data” window of the Trader window.
4) If you like, compare to Yahoo Finance prices.Your strategy signals now consider the last intraday prices.
Warm and cozy feeling – powered by Logical Invest!
All the best,
AlexI´ve opened a new topic for extending backtests with synthetic data and how to use external data sources. See here: https://logical-invest.com/forums/topic/using-synthetic-data-or-external-data-sources-in-quanttrader/
Hi Ivan, thaks for the screenshot, will look into it.
The “notify” button only works for direct replies to your posts, some are new comments to the topic.
Use the “Subscribe to topic” button on top, then you get all posts. Also can subscribe to whole QT forum, then you get everything: https://logical-invest.com/forums/forum/quanttrader-forum/
Hello StFrons, welcome to the Logical Invest family!
Several subscriber have a deferred retirement account without margin, where transactions are only settled after 3 or more days. This is mostly the biggest topic of discussion and concern.
Other than that we do recommend to trade at open after the trading signals are received. But this is more to create a monthly habit, our backtests do not show a significant (>0.5%) deviation in returns if traded within 2 days.
Execution is a big topic, it is important to use limit orders – or adaptive algos like Interactive Brokers offer – to reduce slippage and get good fills. But again, timing is rather on hour or day level, not minutes.
Hope this answers, happy to further elaborate,
Alexplease post the screenshot again, or send it by email to review.
You will find two Nasdaq strategies, the simple one corresponds to the signals we publish, the hedged one you mention is an extra for QT subscribers.
Yup, open the Performance log to see all historical allocations, can also export into csv. For a portfolio this report is on a consolidated strategy level, e.g. without the ETF details – which are available in the performance log of each strategy. See screenshot here: https://logical-invest.com/wp-content/uploads/2016/10/PerformanceLog.jpg
For further details on main functionalities also see our Online Help Documentation.
Hi Ivan,
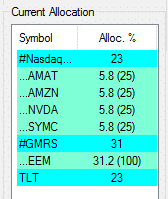
this is already implemented. If you combine your strategies into a Portfolio you can see the strategy alloctions and their ETF constituent’s allocation in the box to the left. See here as example: https://logical-invest.com/wp-content/uploads/2017/02/Portfolio-Optimization-Version-QT2-1024×531.png
These are the signals you´d generate and trade – benefit to the online version is that you select when to generate and trade them, online we always cut signals on the last day of month.
Hi Cal, we skipped this development for the moment to focus on higher priorities, see here: https://logical-invest.com/forums/topic/trader-seems-to-have-gone-missing/. You can download a prior version to see it in action, currently rather a trade execution monitor than an interface to IB.
Yipiyeah, seems we´re getting a nice momentum here, thanks to all!
For those of you who want to extend backtests beyond the ZIV inception in 2011, here a short explanation. Using synthetic ZIV is not hard, see here https://logical-invest.com/forums/topic/showing-off-the-best-strategies-and-portfolios/#post-37547.
Just save the data from this dropbox file as “_ZIV.csv”, and replace the “_ZIV.csv” in the QT folder with it: https://www.dropbox.com/s/jk3ortdyru4sg4n/ZIVlong.TXT.
We can´t do this permanently in QT as Yahoo back-adjusts with splits and dividend, so needs to be on-the-spot. The author seems to be very reliable and runs the data daily from R, but always take synthetic data with a grain of salt.
That´s an interesting approach, guess such cluster algorithms are researched already, let´s see if we find an application. For me it´s always interesting to see how close these optimization algorithms are to image processing.
My personal approach to the optimization heatmap is less scientific though. My brain works very visual, so I need to see and “feel” how sensitive the performance is to parameter ranges. Very often I´m then either confident in the result, take them with a % “grain of salt” discount or even see other “white spots” which look more interesting than what QT has found.
Interested to hear more opinions on how we can further enhance this functionality.
Bullying you? Never have seen me in real action, ha!
Good time to try-out the new “thanks” functionality, see top header of each post. May other 20 follow!
For Ziv there is no replacement, only ETF in the inverse medium category. Volume indeed is lower than we´d prefer but still around 50k shares per day, so liquidity should be ok for retail investor account size, and using limit orders.
TMF has avg 3month volume of 500k shares/d, which is very liquid – even if 90m AUM is indeed low, also no real replacement in the 3x leveraged category. You can use 3x TLT either by using margin or by scaling down overall allocations to stay at 100% total – or futures, but that a different game than ETFs.
We are aware of the concerns, but think it´s manageable for avg account size and using limit orders. Volume data from etfdb.com.
Hi Petr,
glad you liked the Seminar, we need to more of these – we enjoy them as well, but sometimes get lost with our long to-do list. So push us please!!
1) Links to Seminar, these will be valid permanently:
On our site:https://logical-invest.com/webinar-etf-rotation-momentum/
Directly on Youtube: https://www.youtube.com/watch?v=d_YpwxuJkhc2) Generally all strategies and portfolios of strategies should be rebalanced monthly. Only if you trade Maximum Yield, then this should be rebalanced every two weeks. If you have a portfolio of different strategies, with one being Maximum Yield, then rebalance the Maximum Yield ETF every two weeks, but the overall portfolio only once a month.
3) Same as I explain in 2). Best is to rebalance everything once a month, e.g. keep strategy ETF at their allocation %, and make sure the allocation between strategies is also close to the target. If you use the “Consolidated Signals” page, then everything is done in one step, just use the “Total Weighting” column, which is considering the allocations of ETF within Strategies as well as the weighting between strategies.
For the QT process, the lookback period depends on the portfolio setup you´ve choosen. We´ve explained different settings here: https://logical-invest.com/forums/topic/showing-off-the-best-strategies-and-portfolios/#post-38652. If you want sent me your “QuantTrader.ini” files by emial, and I have a look at your specific portfolio – or we can do over Skype.
Hope this clarifies,
All the best,
AlexHere an example of how to replicate the Portfolio Builder “fixed weight” allocations: https://logical-invest.com/forums/topic/showing-off-the-best-strategies-and-portfolios/#post-38652
Here an example of how to replicate the Portfolio Builder “fixed weight” allocations: https://logical-invest.com/forums/topic/showing-off-the-best-strategies-and-portfolios/#post-38652
Had a good exchange with Richard over how to replicate a portfolio from our Portfolio Builder in QuantTrader, versus using the dynamic allocations in different algos.
Here some of the ideas, guess this will develop into a longer post with your support.
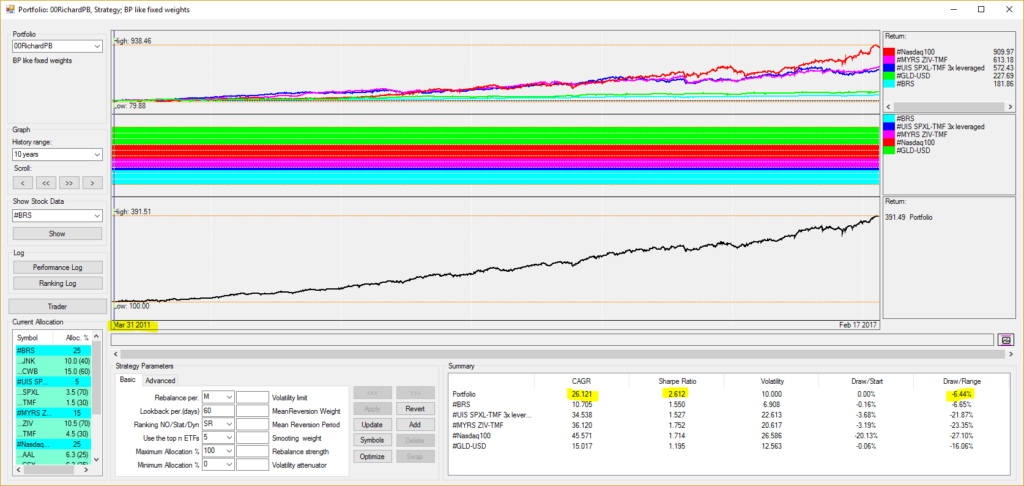
Here the mayor difference between PB and QT: PB uses a “fixed weight allocation”, that is you always stay invested in the same fixed allocation. In the MAX CAGR Vola <7% example this would be 5 strategies with the fixed BRS 25%, 3xUIS 5%,MYRS 15%, NASDAQ 25% and GLD/USD 30% – and all ETF the strategies are invested at each point in time.
In QT you can also do this (example below), but the way we use it to pick the “Top N” best performing strategies in each period and let the allocations between them be optimized. This is the “meta-strategy” algorithm we talked about.
Here the portfolios, in different versions:
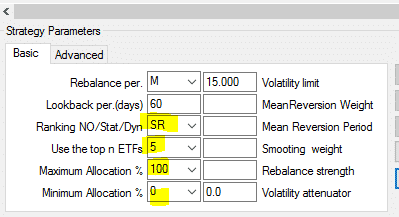
For the PB version I fix the allocations by using the min / max allocations by each underlying strategy, and then use SR ranking algorithm with Top 5 Strategies, so QT cannot modify allocations or pick less than 5 strategies.

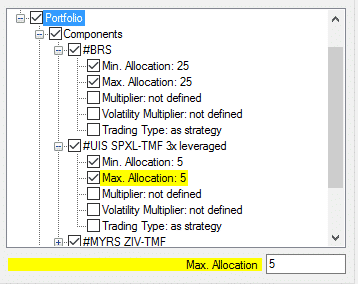

No need to limit volatility, it is 10% over the whole period, only if you choose very short lookback period then one time there is a peak.
Very nice results, but note that the backtest is starting 2011 even if I use 10years window – ZIV data for MYRS is limiting us. Can do a test with synthetic ZIV data later.

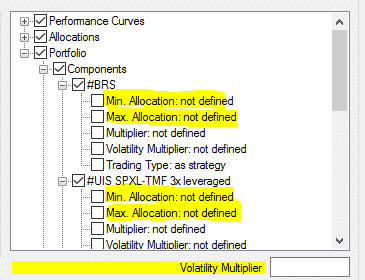
For the QT version, I remove the fixed allocations again, and chose different ranking algorithms, so you see the difference. All of them slightly optimized for lookback and volatility attenuator and limiting volatility to the 15% you used.
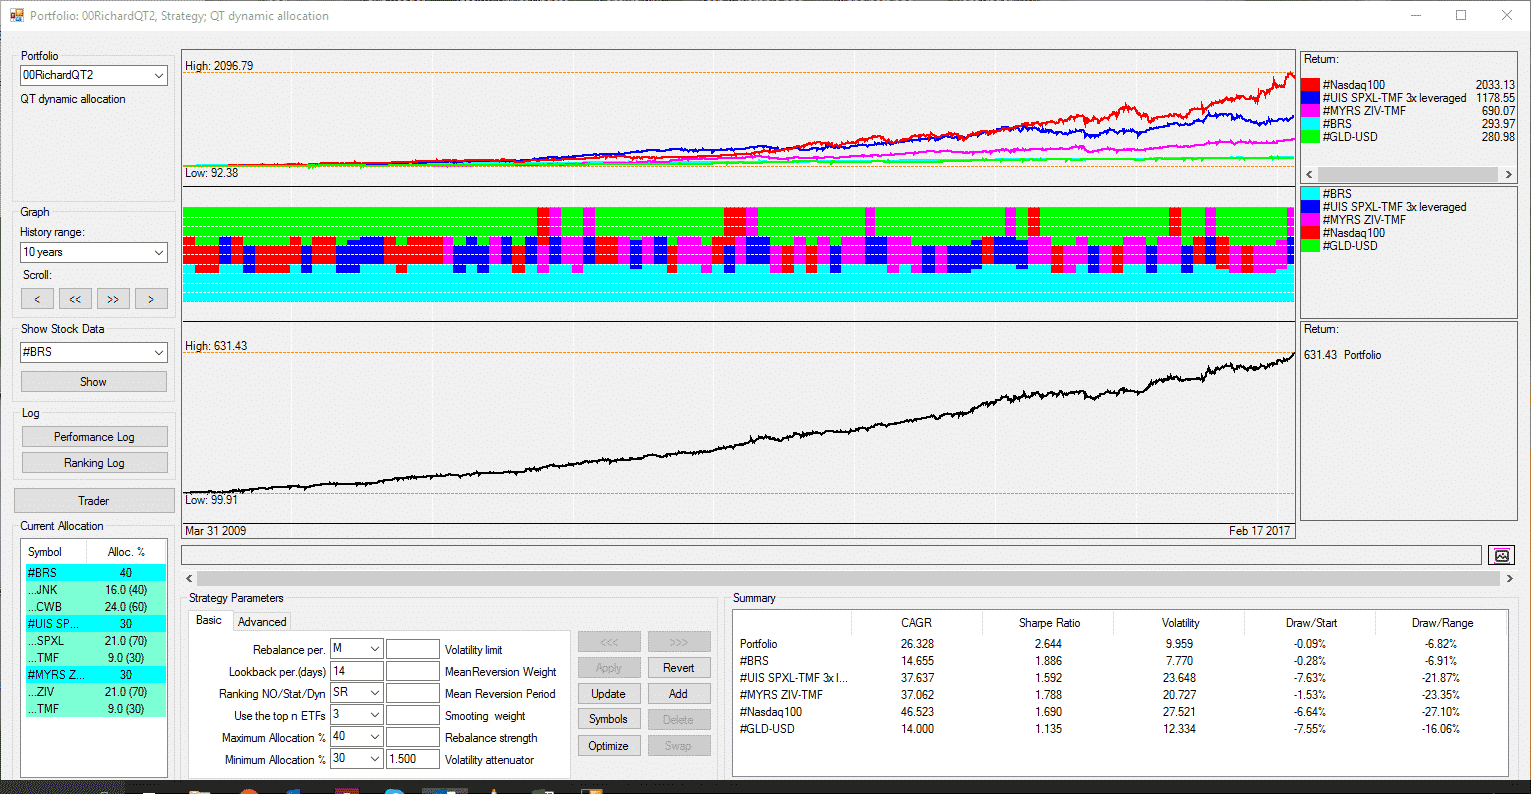
Version QT1:
Static Ranking with Top 3 Strategies, min allocation 30%, max allocation 40%. Similar to last post: Look for the Top3 performing strategies in the last 104 days (5 months), and allocate 40/30/30% to them.

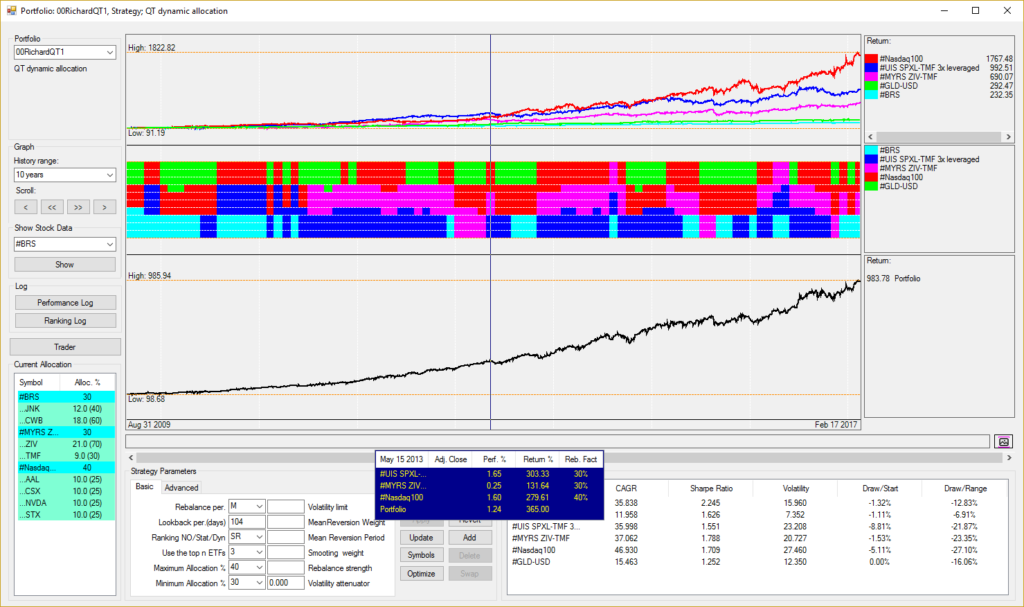
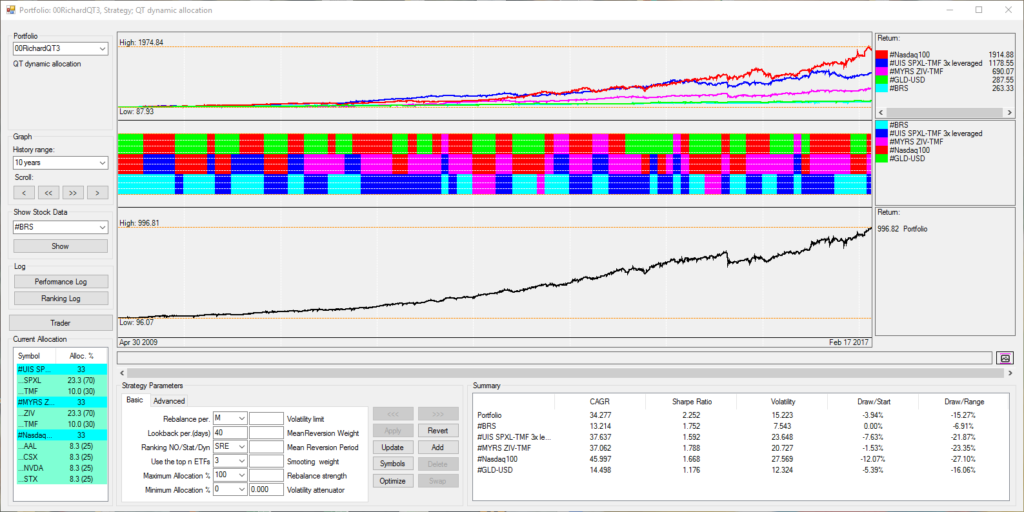
Version QT2: With a shorter lookback (more responsive) and a higher volatility attenuator (more weight on volatility SR = R / Volatility^VAttenuator) I get close to the fixed weight model, but only invest in Top3 strategies.


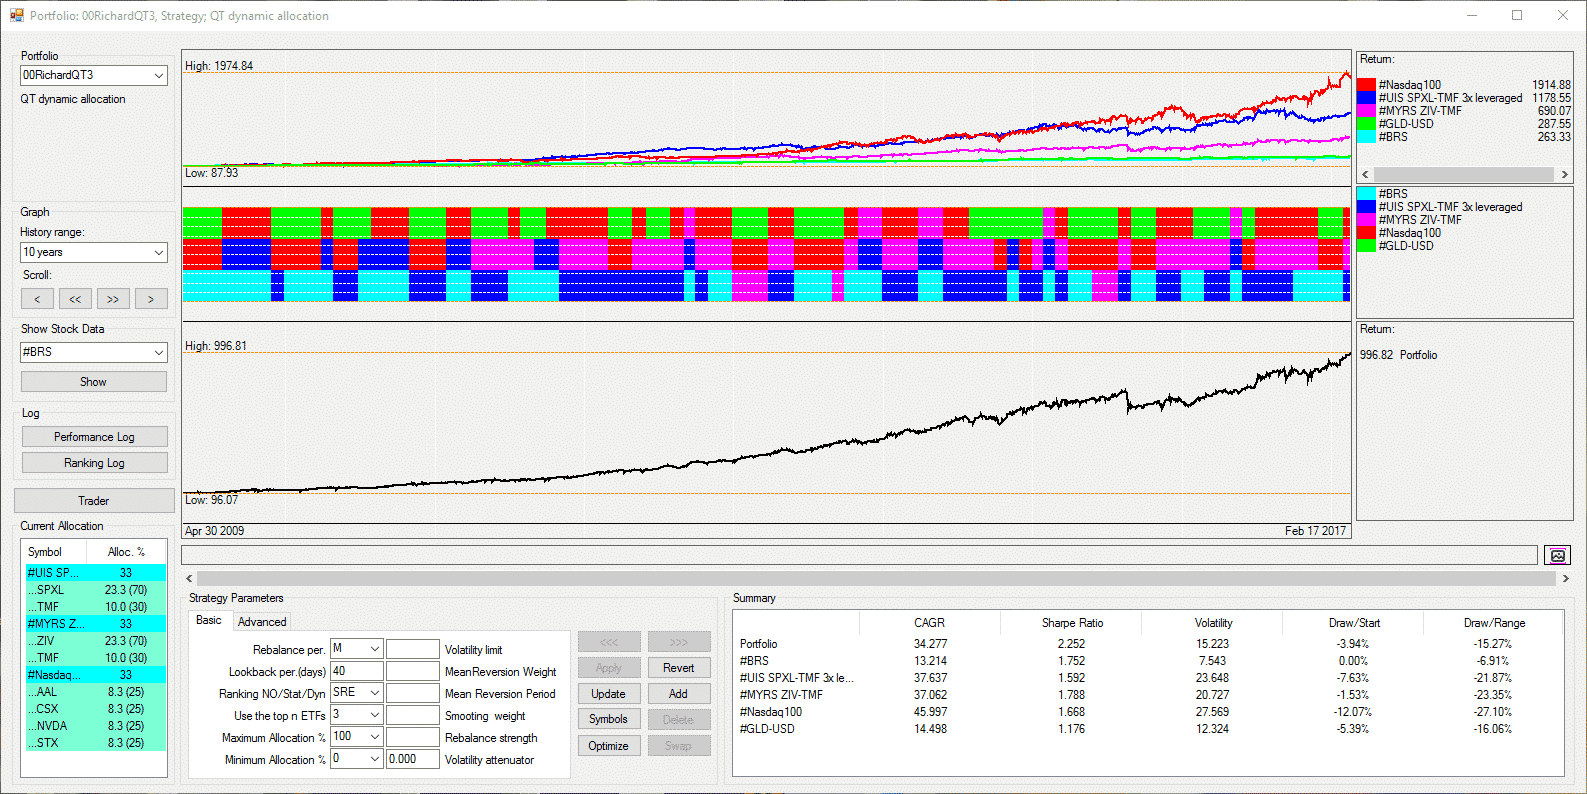
QT3: Now let´s try SRE = Static ranking, equal weight = with Top3 each one gets 1/3. Here I do not need min/max allocation limits. Optimized lookback is slightly longer with 40 days or about 2 months.

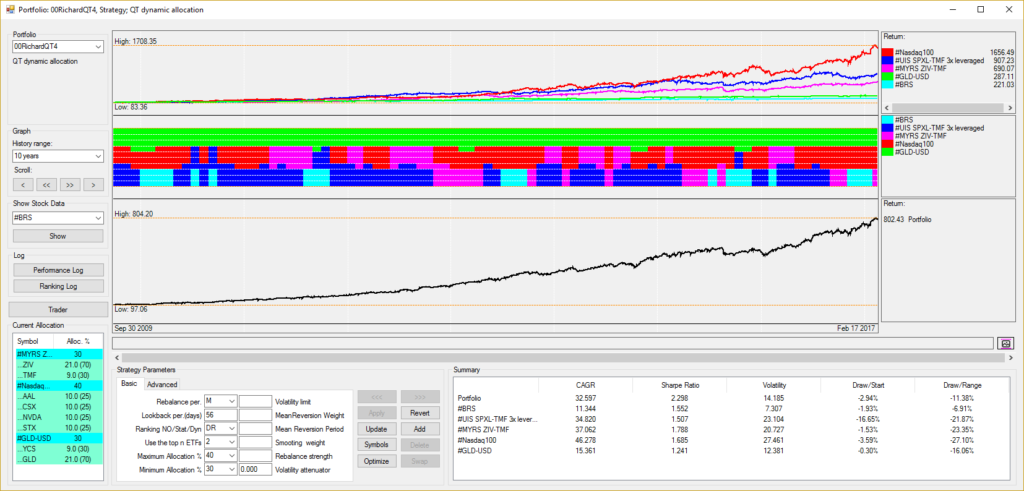
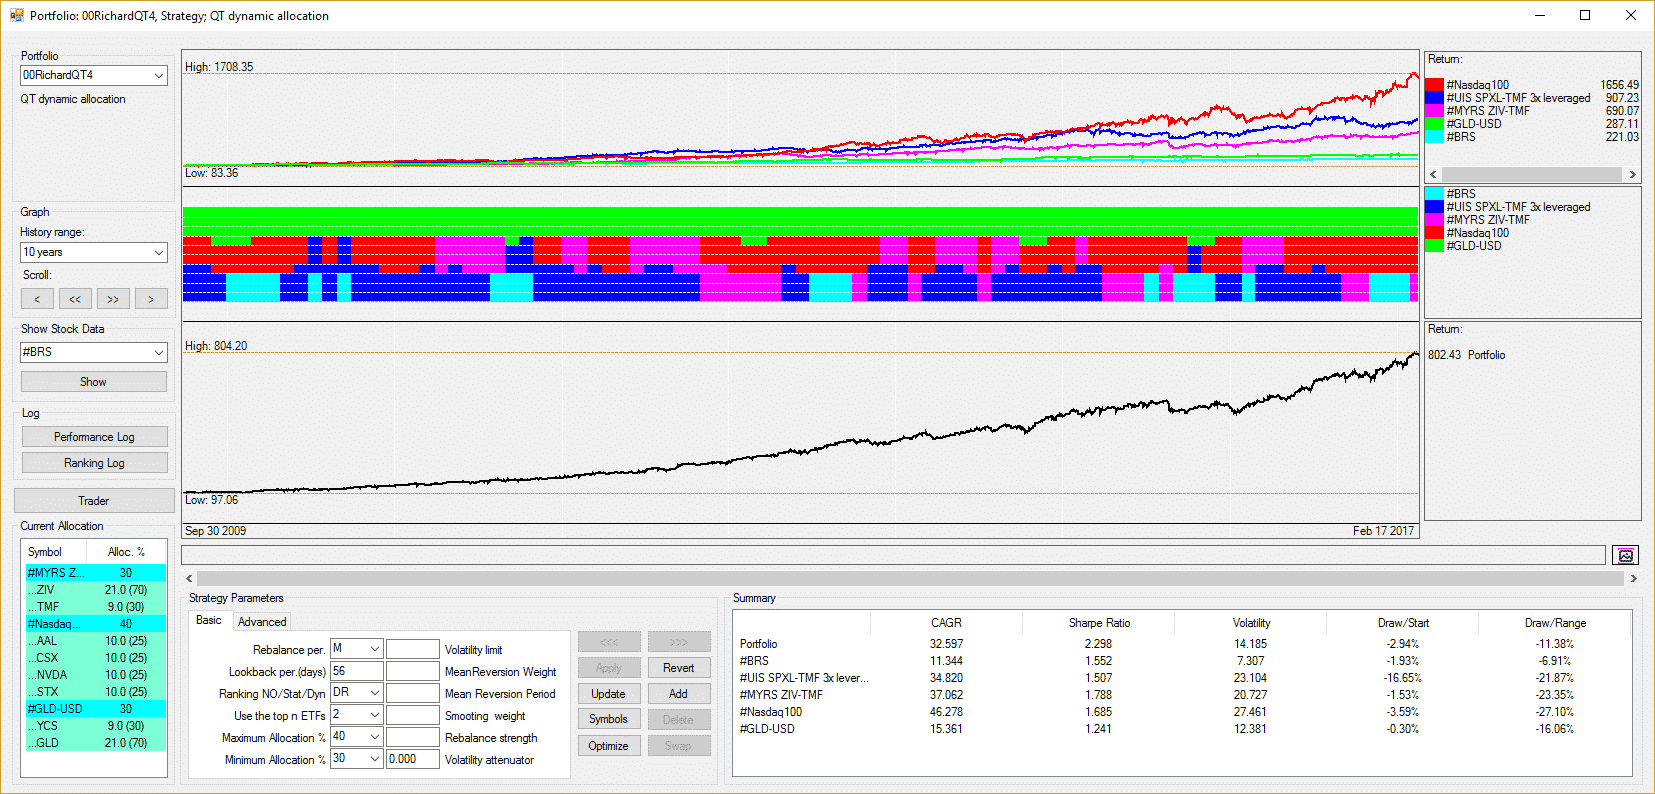
QT4: Let´s try DR= Dynamic ranking where we first rank the “risky assets” and then hedge them with the last strategy in the list. Dot that either BRS or GLD-USD must be last in the asset list, I start with GLD-USD as hedge as it is already last in list:
Note that here Top3 means top 3 risky assets + hedge so total would be 4 invested, therefore I go down to Top2 + hedge. This optimization takes a while…
So basically it´s a two-round optimization:
- Look for the combination of risky assets that has highest modified sharpe each period, and built an equity line from these.
- Take this equity line and optimize it now for modified sharpe together with the hedge.
The DR allocations always have this pattern:
- A certain % goes into the risky assets, this % varies by volatility and correlation to hedge
- Hedge (here Gold-USD) is always invested as it is not “competing” with the risky assets, and allocated to the degree which is needed to maximize the modified sharpe.
Results are not spectacular, but it´s to show how this works, you see the change to the others.

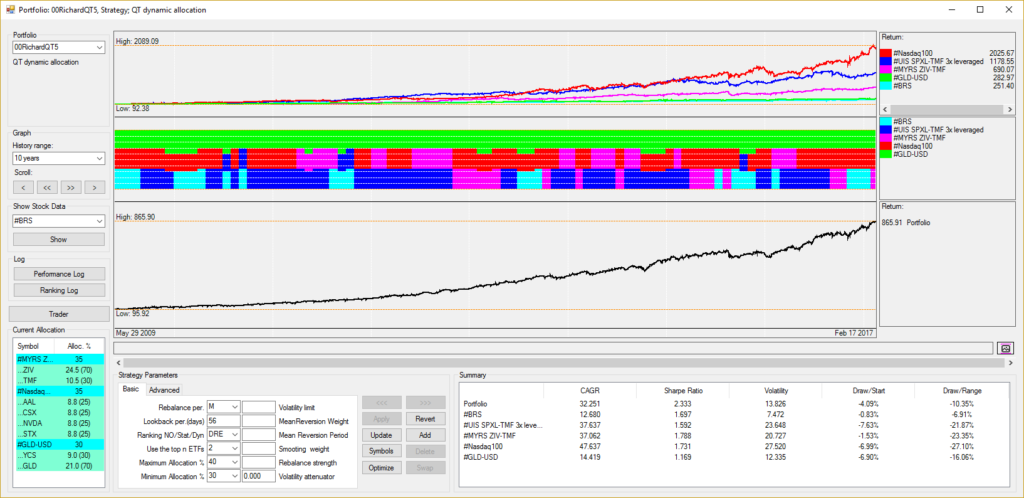
Version QT5: Now I use DRE = Dynamic Ranking Equal Allocation. So first equal allocation between the Top2 and then we add the hedge (GLD/USD).
Basically no change in this example, just to explain the algo.

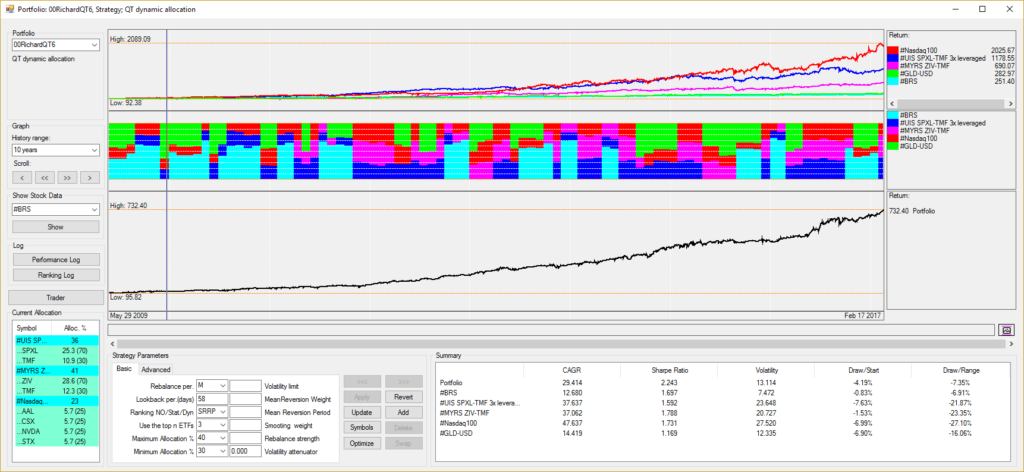
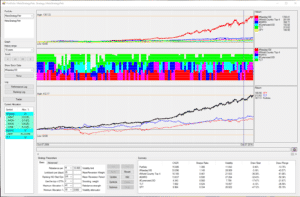
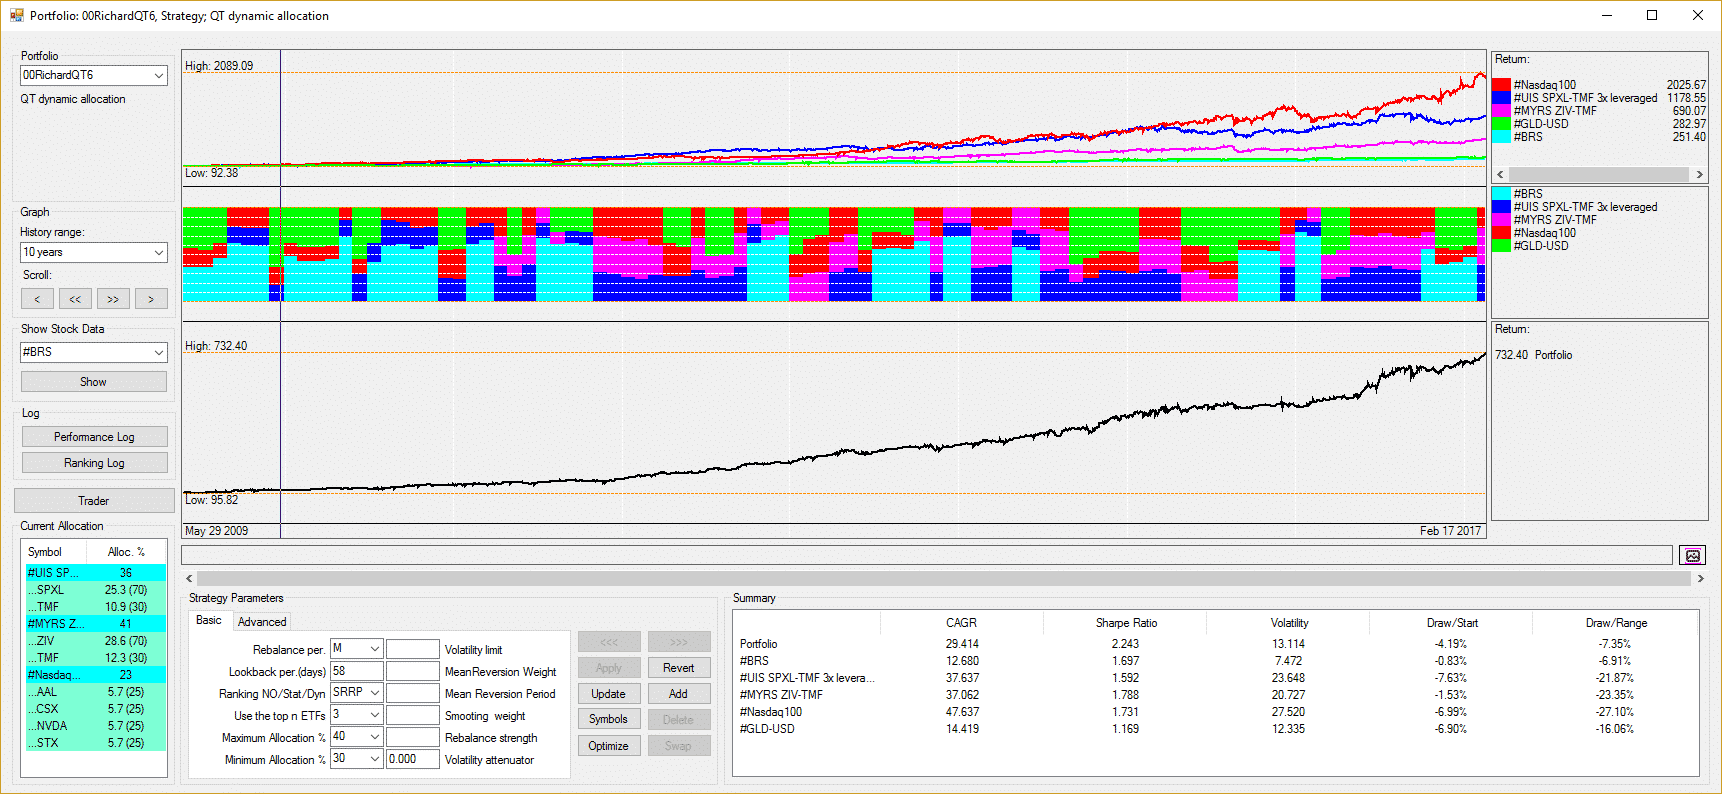
And here, QT6, with SRRP= Static Ranking Risk Parity. The Risk Parity algo is different, as it tries to find an allocation where each asset contributes the same amount of risk (=volatility). Quite popular in big funds and a lot of hype recently as these funds experience big shifts when the volatility regime or correlations shift suddenly – as it has been the case last year(s). Then they basically move the whole market with their re-allocation.
You also see that below: Normally allocations “flow” softly across the month, but then some volatility comes and BRS (light blue) moves in. Nice algo, I like this stuff fundamentally.
DRRP is the same, but again we first run risky assets and then add the hedge.

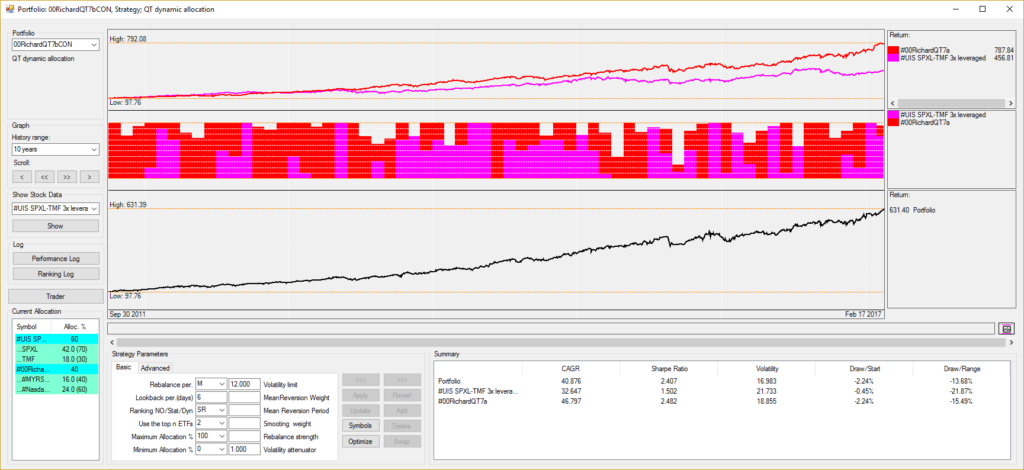
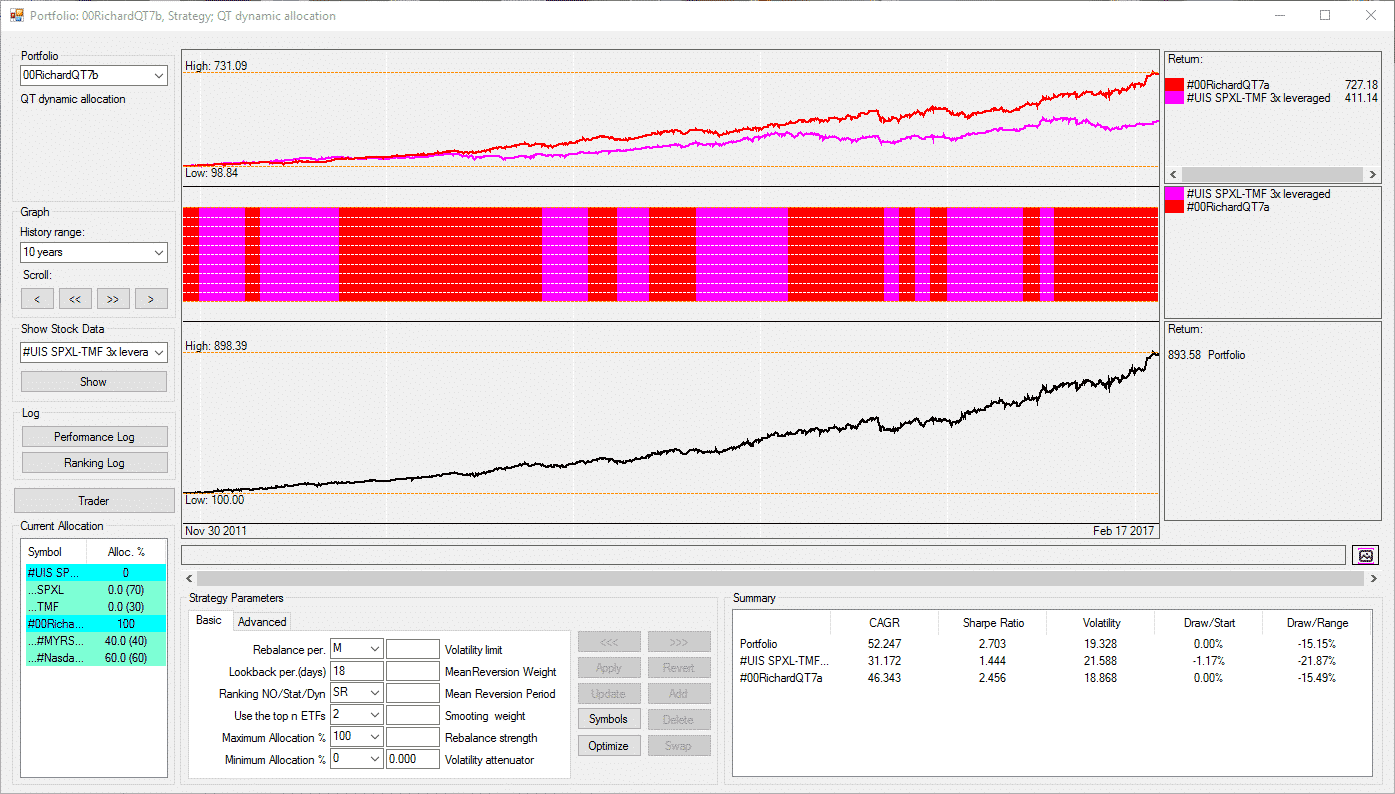
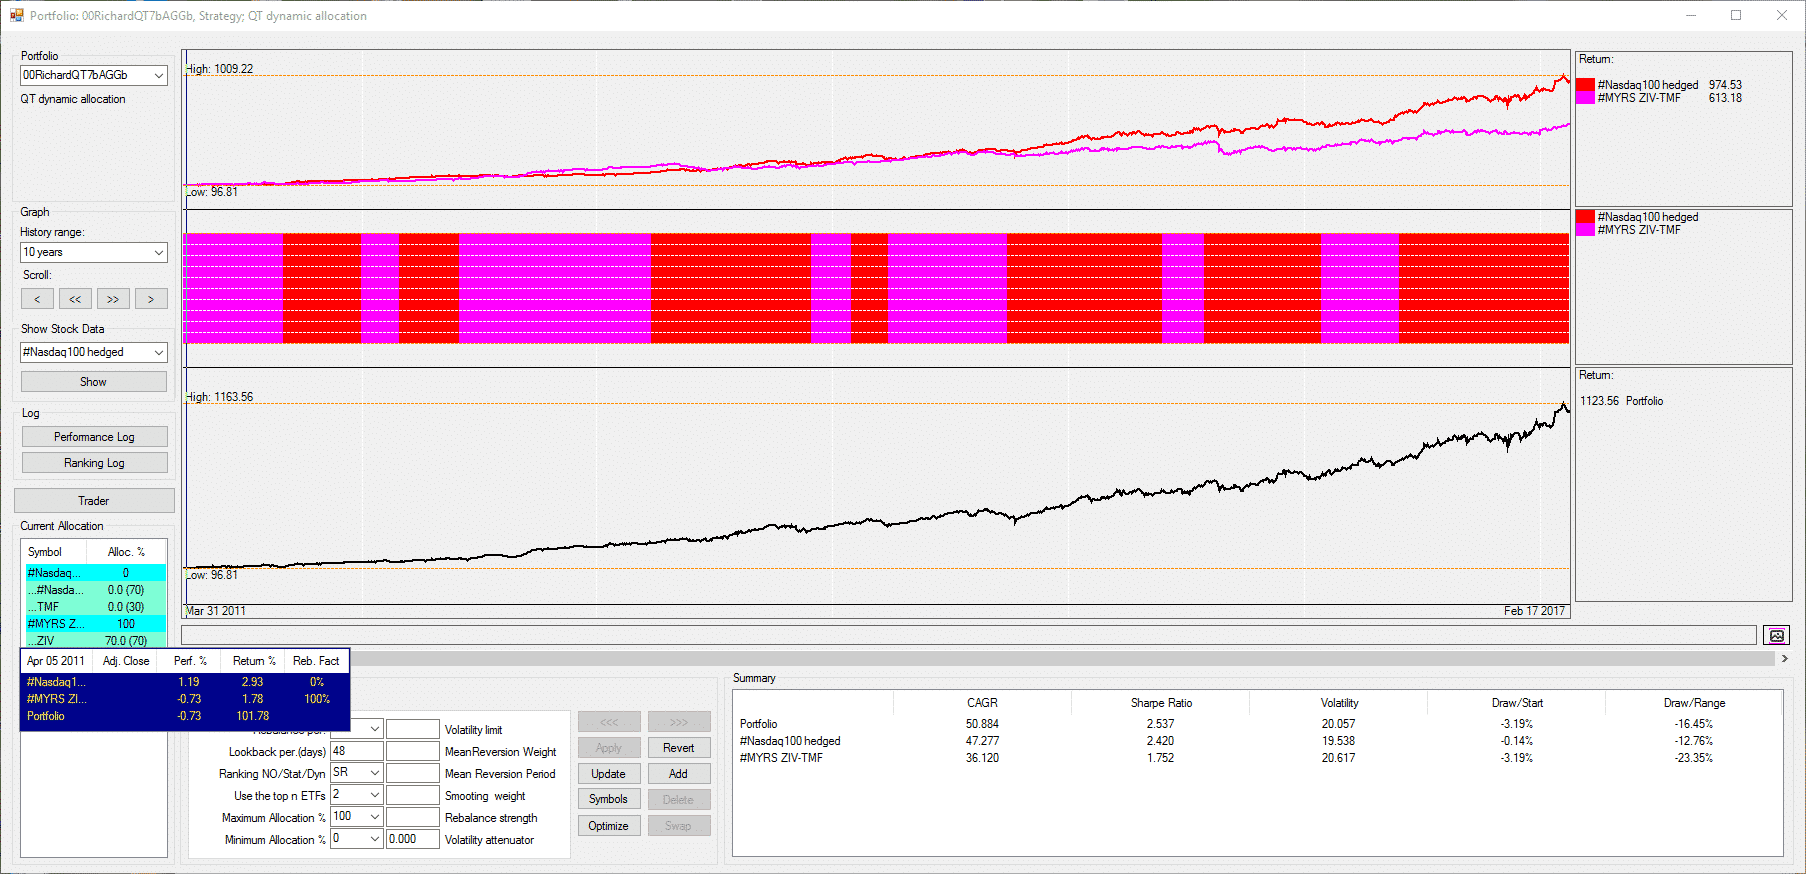
Finally, just to show off a bit: QT7 a Strategy of Strategies of Strategies!!
- QT7a combines MYRS + Nasdaq as the first building block
- QT7b takes this block and adds 3xUIS.
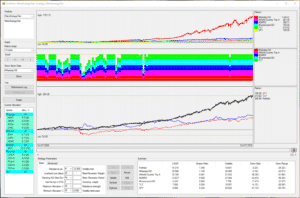
QT7b Aggressive version 52% CAGR with Sharpe 2.7 and DD of “only” 15%.


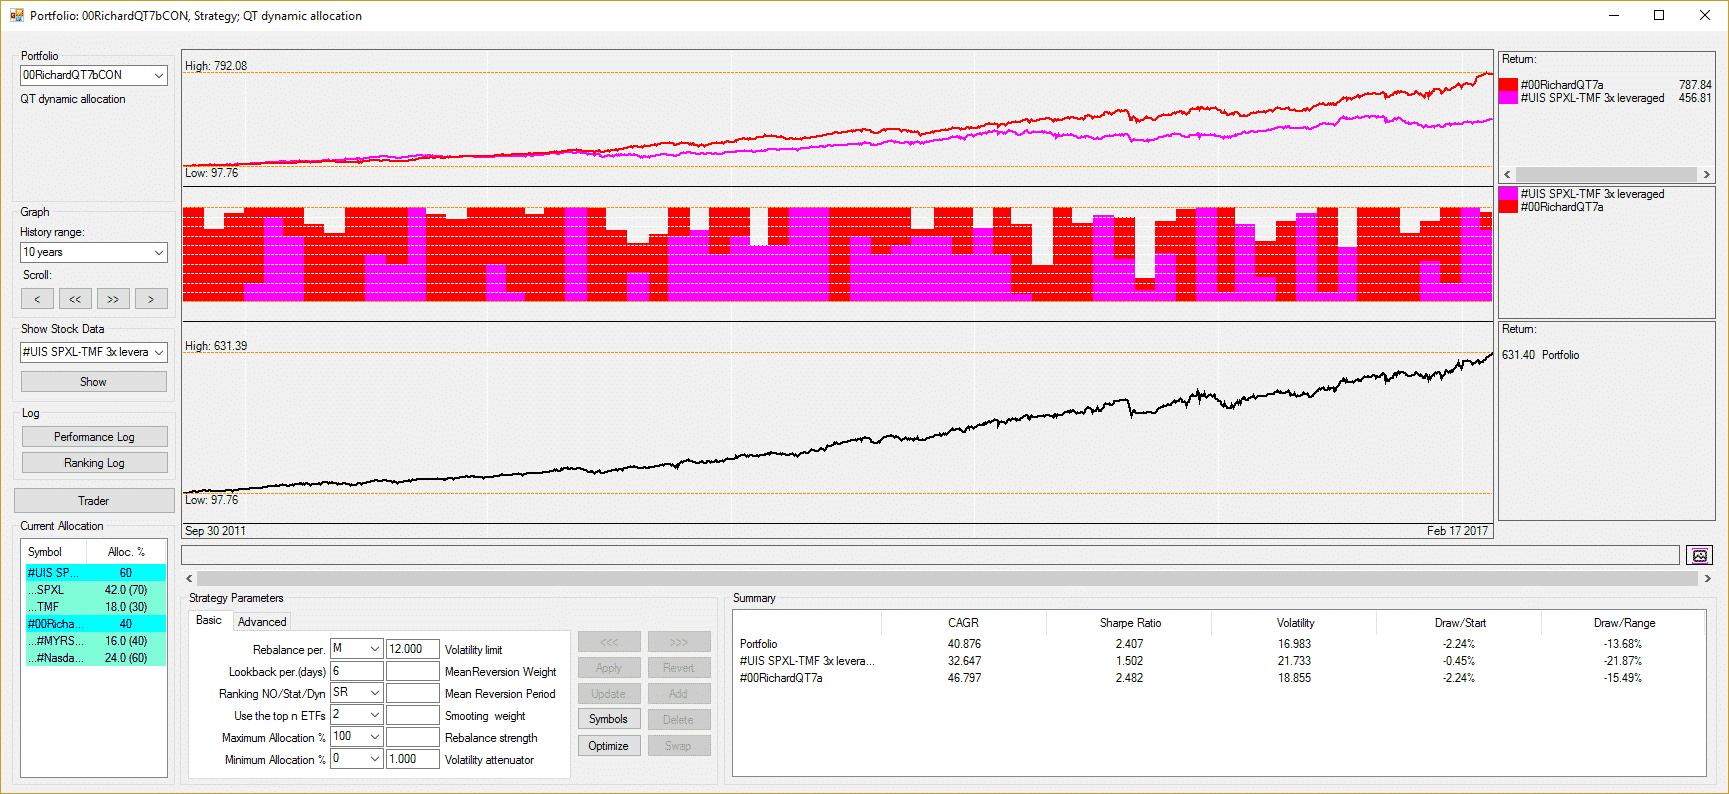
QT7b more conservative with a 12% volatility limit to step out of market in volatile times. Note that due to the 3x leverage and ZIV the overall volatility is still 17%.

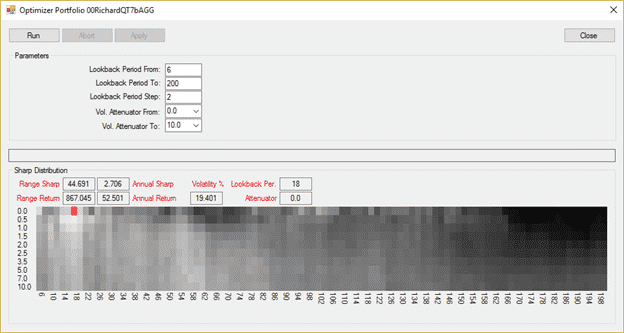
Example over-optimized and curve fitted? Probably a bit as it´s rather about explaining the algos, but parameter range is quite stable (lighter area top left)

And here another by-product QT7bAggb, Nasdaq 100 hedged + MYRS. Try using the hedged Nasdaq in yours, instead of “normal” Nasdaq.


Here a zip file with QT311S and the ini files containing above strategies. After downloading change extension from *.doc to *.zip, put into a new folder, download assets… and enjoy!
https://logical-invest.com/wp-content/uploads/2017/02/QT-311-Examples.doc
Alex
Hi Gordon,
thanks for the comment, great topic as using MF or ETF of the big plan sponsors is one of the things we have on the list.
1) I would not say that one strategy in particular is more suitable for MF. It rather depends on which proxies or similar MF you find to replace the ETF we´re using. For example some like ZIV in MYRS will be hard, while the ones in UIS, GMR or GSR are rather easy. You can also use a mix of MF and ETF, for example run MF in your IRA and ZIV from savings account.
2) You can import all MF into QT to have them available. One way is to import them as a “symbol list”, but then you can´t pick them individually for a strategy, but only the whole list. So best is to Copy&Paste them one by one as new symbol, or send me the list and I paste them for you with a little trick.
Using more than lets say 10 MF in one strategy will not render good results. Look first for the fundamental reason of why to combine some of them. What´s the fundamental performance driver of your strategy? Sectors, equities, bonds, global assets, commodities? Pick ones that have bout the same volatility. Some should have low or negative correlation to each other. The reasoning of our strategies might be a starter, or look for other asset allocation strategies.
3) Lookback depends on their volatility and other factors. Run a quick optimization to see in the heatmap where you have stable ranges. In many cases it´s around 50 to 70 days, or 2-3 months.
4) Benefit of using MF, especially Vanguard, is that many have a long history – but others don´t. So pick the ones with at least 10 years history, even if you might want to use other similar ones in real trading due to being free or any other reason. But first backtest 10 years, and then confirm on a shorter timeframe with the same parameters.
Finally, feel free to open a dedicated topic here in the forum and use services like https://snag.gy/, http://pasteboard.co/ or https://onpaste.com/ to share your screenshots – I´m sure other community members will then jump in, and we can support.
All the best,
AlexQuantTrader Webinar
Sat, Feb 11, 2017 10:00 AM – 12:00 PM EST (4pm-6pm CET)Please join my meeting from your computer, tablet or smartphone.
https://global.gotomeeting.com/join/167951525You can also dial in using your phone.
United States: +1 (224) 501-3217Access Code: 167-951-525
More phone numbers
Canada: +1 (647) 497-9391
Denmark: +45 32 72 03 82
Germany: +49 (0) 692 5736 7210Latest QuantTrader Version 310S with the updated ini file of our strategies.
310S Changes:
– several smaller Bug fixes
– Now the strategy always loads the 15 minute delayed prices if you start it during normal market hours. This allows you to start it for example the last day of the month at 3pm and then you can do your allocation changes during the last hour.
– The strategy drag down field now automatically gets large enough so that you can read the complete strategy names.
Download link: https://dl.dropboxusercontent.com/u/43364046/Logical-Invest%20QuantTrader%20versions/QuantTrader310S.zipAgenda:
1. How to get started?
a. File management – File structure, file names, import/export portfolios.
b. Main functionalities: New Symbols, New Strategies, New MetaStrategy
c. QuantTrader Dynamic Allocation vs Online Portfolio Builder Fixed Weight Allocation
2. Trader Window – discussion of Strategy Parameters
a. History range & impacts on lookbacks
b. Volatility Attenuator
c. Min/Max Allocations vs Top n ETFs
d. Ranking SR/DR advantages & disadvantages
e. Mean Reversion Weight
f. Mean Reversion Period
g. Smoothing Weight
h. Rebalance Strength
3. Discussion of optimization routine and how to avoid over optimization.
a. Inverse ETF vs Short ETF
b. Hedging and Delta Neutral strategies
c. Extending backtests with synthetic tickers
4. Consideration for combining strategies with different optimum lookbacks
5. Showing off – Some of the best strategies and portfolios so farPlease block your calendar for next Saturday Feb 11 10am EST / 5pm CET, will send an invite shortly. Agenda will be fixed during the week in the forum, please see link here, same as Webinar links and dial-in numbers.
Have a good start into the week,
AlexHi Mark,
sounds like a great idea to me! We had some seminars on other topics back in 2015, but never could get big enough of an audience, but let´s try again. Let me send an email to the user community to see interest, then we can discuss topics to be covered and dates here in the forum. There has been quite an exchange with several guys over the last weeks, but sadly mostly over Skype without recordings – but the “crowd power” is growing.
We can also do a 1:1 walkthrough first to get you started, just pick either Switzerland, Greece or Mexico and one of us is there for you.
Hi Jamie,
Thanks for your interest! Depends a bit on your account size, for example if running less than $50k I would drop the smaller allocations to some strategies (let´s day the 1-5% ones) and rebalance only if deviation to target allocation gets bigger than 5% precisely to reduce trading costs. As is I would guess about 120 transactions a year, but you can reduce it probably to half without impacting performance too much.
Use the Max CAGR Vol 5%). The tool will then create orders translated to shares.
This is what I mostly do, keeps cost down and speeds rebalancing up to 15-30 minutes.
Deshan,
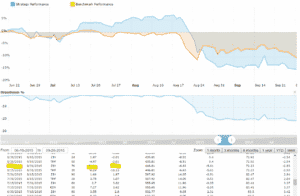
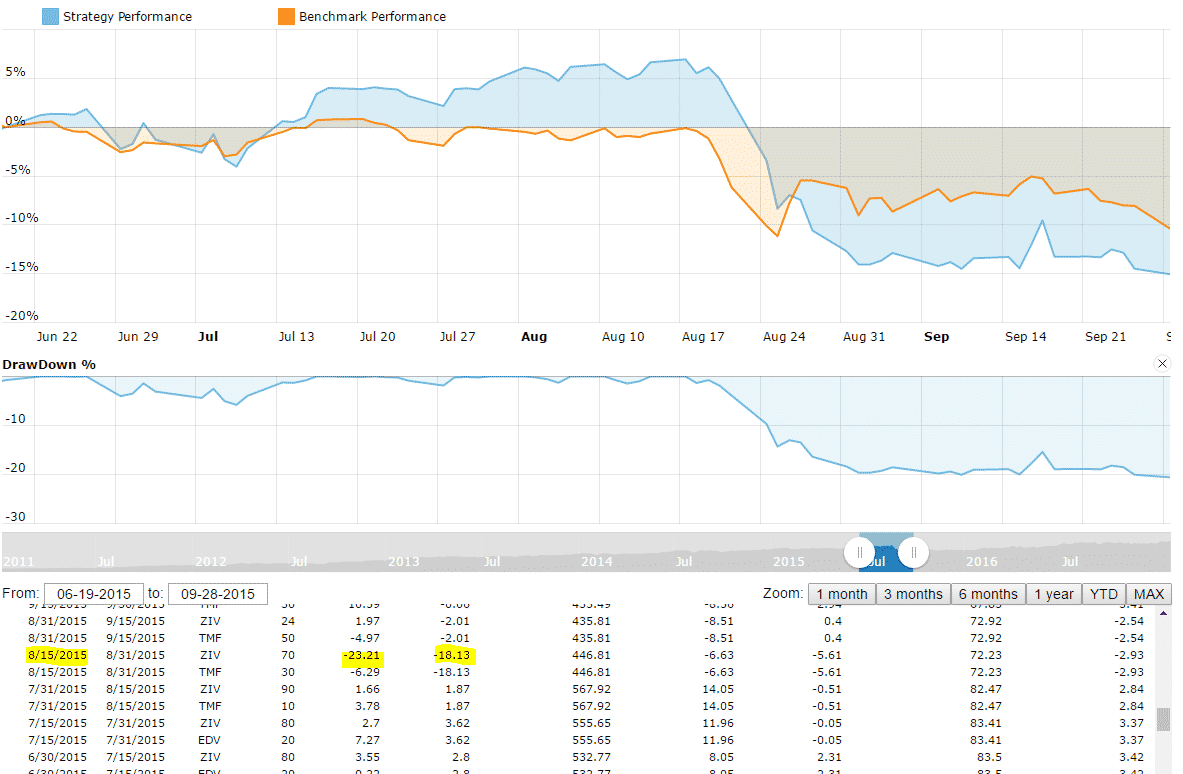
I appreciate your comment very much, good encouragement for other subscribers also! Yes, second half of 2015 was a difficult time, especially for recent subscribers who just signed up some months ago.
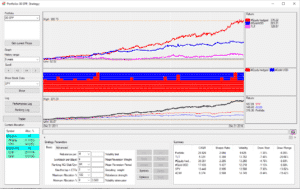
Here the picture of what they experienced, must have felt like falling off a cliff. And then psychology plays it´s games and it´s hard to stay the course, same to everybody.

Your tip of virtually starting the strategy in different point of times is great advise. When I develop a strategy I also “walk it through” with a limited window of time visible in the chart, trying to understand how it works and how it “feels”.
We´re currently again in a low volatility environment, with good contango, but a lot of noise out there. So it´s just statistics that there will be a jump in the VIX some time, but till then it´s important to stay course and harvest the risk premium others pay to avoid the jump. Not intuitive, but money-making!
Thanks again,
AlexFor those of you who want to extend the backtests of volatility strategies, you can use these synthetic tickers with history back to 2004. These have been shared by Helmuth Vollmeier on https://quantstrattrader.wordpress.com, another great blog from our buddy Ilya:
https://www.dropbox.com/s/jk3ortdyru4sg4n/ZIVlong.TXT
https://dl.dropboxusercontent.com/s/950x55x7jtm9x2q/VXXlong.TXT
https://www.dropbox.com/s/jk3ortdyru4sg4n/ZIVlong.TXTSimply download into a csv file and match the file name of the symbol in the QT folder. Once you update history from Yahoo, obviously these are gone.
These are synthetically calculated and match quite nicely in the period when real data is available. Still take these with a grain of salt..
Hi John, thanks for your interest. Looking into it and will come back in some minutes.
Hi Ivan,
pricing of bonds indeed is all a science, here a good compendium: http://www.investopedia.com/university/advancedbond/
What we´ve seen recently are two effects:
1) Increase in rates due to the (anticipated) Fed hike. This affected the whole curve, e.g. from short term to longer duration.
2) Increase in expected inflation due to Trump’s announcement of heavy public spending. This effects more the longer dated bonds, and is one of the reasons we moved to the new approach incorporaing TIPS (inflation protected) ETF.Where will this go, especially if the FED indeed hike three times in 2017? There are manhy conflicting voices (lock 5 economists into a room and you get at least 10 opinions…)
-As the current 10 years yield is above or at least around the S&P500 dividend yield some people do not expect the 10ys yield to rise significantly.
– For Foreign buyers the US bonds are a paradise considering very low yields in Europe and Japan, so they are buying heavily, especially if current USD strenght should continue.
– If the Trumponomics due not work as expected (or only partially and delayed), inflation might my overestimated, so bond prices might fall.
– In case of any major trouble, bonds are still a reliable safe haven, e.g. in a crisis they will rise due to money flow.With our broader bond strategy we feel to be fine in any outcome, but also our glassbowl is not big enough to make a call right now.
Hi Ben,
yes, Ilya of QuantStratTrader is a sharp guy and has replicated several of our strategies, mostly at least.
Dividends can be a concern due to their different taxation in the US if bond ETF are held outside a tax deferred account. This is especially true for the Bond Rotation Strategy, as dividends make a good chunk of the performance. This is NOT an issue if held in a tax deferred account (IRA, Roth, etc).
The second comment regarding dividend adjusted data from Yahoo is really less of a concern. What happens is that after a dividend distribution the past prices are adjusted to eliminate the price drop which follows any dividend payout. This adjustment can go back weeks, sometimes even months. The first trap some people fall in is that they do not consider this and do not “refresh the past” in their data when calculating signals. The second trap is that data is adjusted only some hours after the market close, this is the reason why we do our signals overnight and not right after the closing.
So yes, there are traps related to dividend adjusted data, but we feel we have addressed them in our calculations. Generally we do not think Yahoo price data to be less confident when working with monthly strategies as ours, but indeed some people do not share our opinion here.
Hope this answers, if not please let me know,
AlexYes, we also hope that little by little we can create an exchange of strategies, portfolios and further ideas here.
To start-off and keep you motivated, how do you like this one?

This is the EPP strategy (Enhanced Permanent Portfolio) with the QuantTrader.ini file attached. It is composed by a gold and a equity sub-strategy. The equity sub strategy is composed by a DOW30/Nasdaq100 strategy, a world country strategy and a Eurostoxx 600 sector strategy.
Simply download the QuantTrader.ini file and put it together with the QuantTrader.exe into a new folder. Then on startup it will load the necessary symbols.
No, beside the technical hurdles, I doubt you would get any suitable result running on such huge number of stocks. In our experience it´s better to stay at the index level for a market, or to use a limited number of index constituents (Dow, Nasdaq or sub indexes of the S&P500).
Hello Mitch,
thanks for your interest and the question. The volatility limit is based on historical volatility during the lookback period as you describe (annualized standard deviation). So whenever the historical volatility in the lookback period exceeds the limit, then the allocations for the next period are scaled down accordingly. This is a big assumption in the sense that past historical volatility is a prediction for the future – which obviously is not the case all the time.
The prediction error is what you see: Instead of exectly matching the historical 8%, the real result is slightly above with 9.5%. Keep in mind that the algo is scaling down allocations, it is not using any stop mechanism (which would be harmfull in our experience).
The shade is reflecting the Range Sharpe, the range which is optimized. Normally as Frank said, you would first optimize for a shorter range, and then extend the backtest once you find a stable range. This also helps to confirm the stability of the parameters.
Yes, for Static Ranking (SR) the algo permutes (runs through) all possible combinations of the constituents to find the best combination in terms of modified Sharpe.
In difference, for Dynamic Ranking (DR), the algo would first permute all combinations of all non-bond ETF to find the best combination in terms of modified Sharpe, and then in a second step add the bond ETF in its best mix.
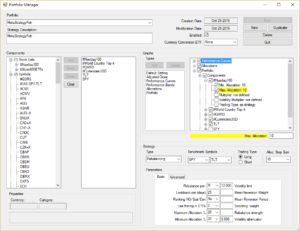
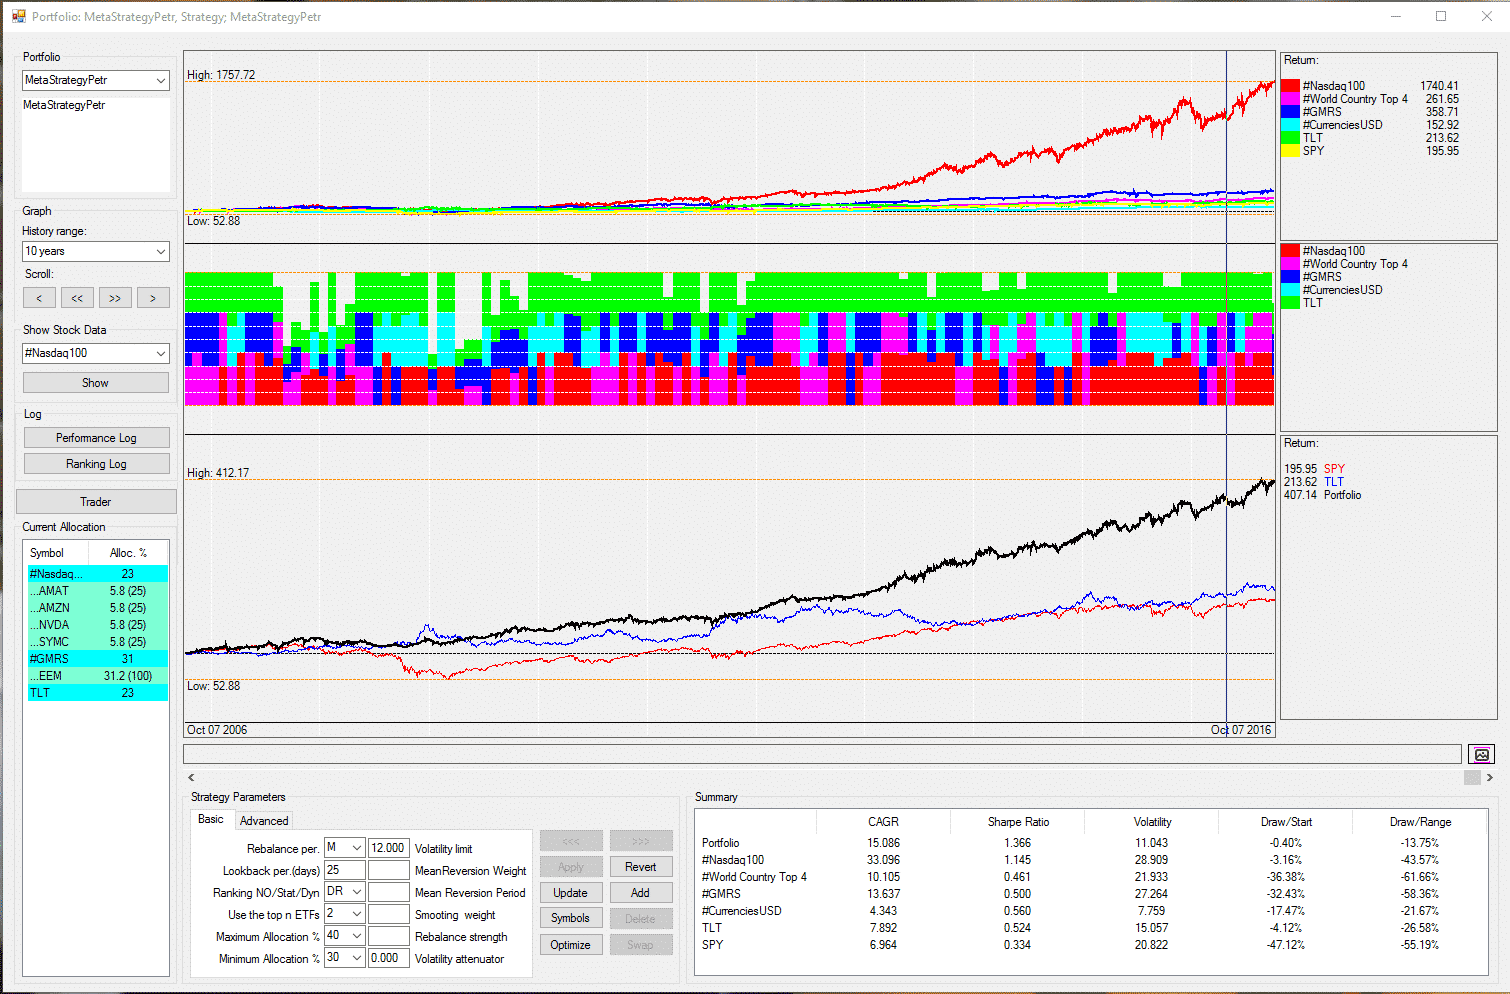
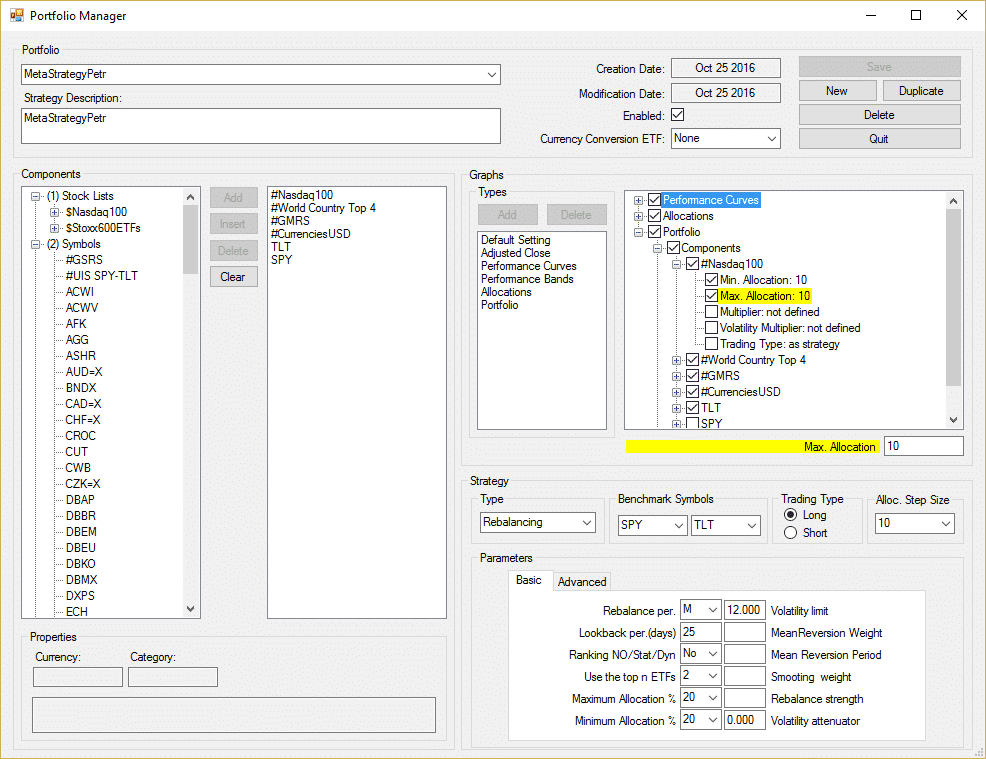
I received a question on how to build a meta-strategy and or fixed weightiong portfolio, which I´d like to share:
Q:”I am subscriber of your software. Currently, I am using your standard strategies, which you are email me each month, I would like to set optimal alocation in QUANT Trader for these strategies next month. Can you get me clue how to divide alocations by Quant Trader between all strategies to get best ratio?”
A:”QuantTrader allows you to build what we call “Meta-Strategies”, these allocate dynamically to the underlying strategies and react much better to different market environments. This is what you are looking for, I guess.
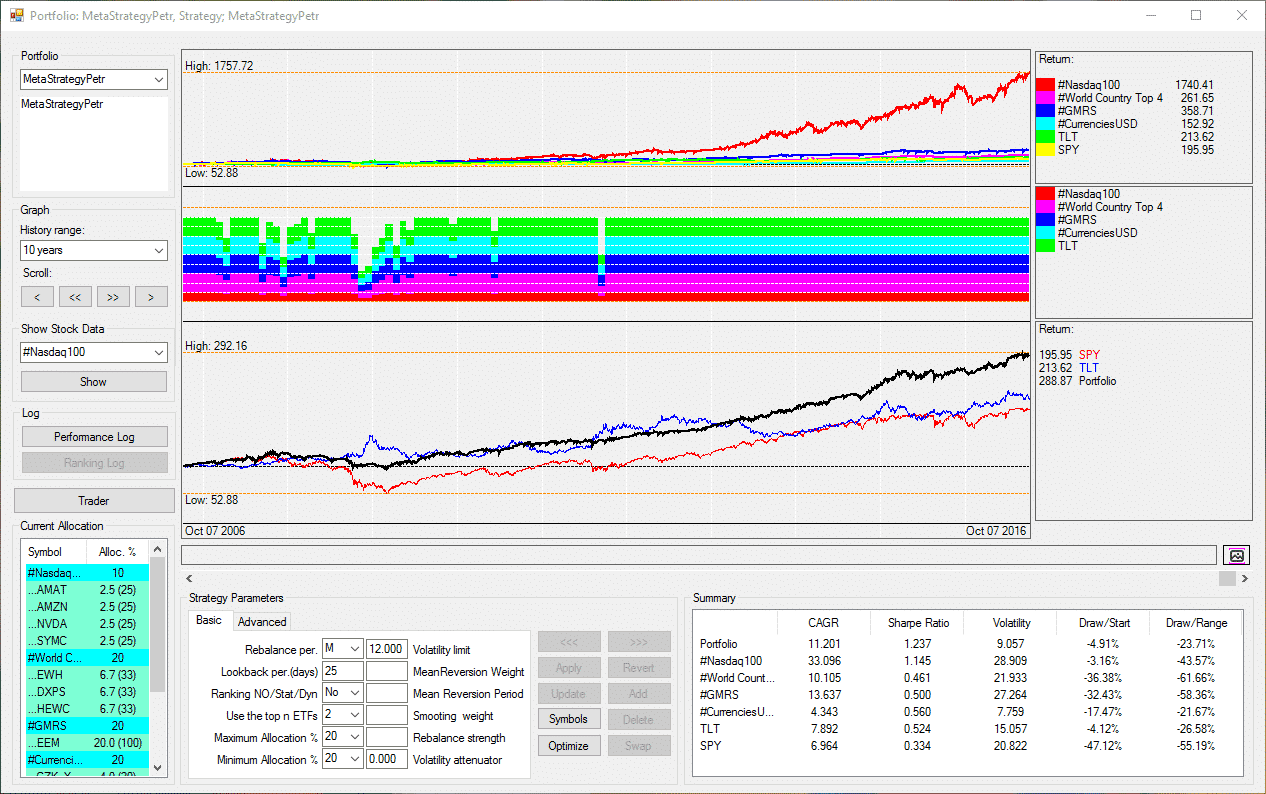
See example below:
– Equity: Nasdaq + World Top4 + GMRS
– Currency / Gold as non-correlated strategy
– TLT at portfolio level on top as hedge
– Portfolio level volatility limit of 12% (sometimes goes to cash)Look for different ranking algos (No, SR, DR) and different min and max allocations to get to a well-balanced approach, e.g. avoid extreme corner solutions. I attach a DR example, e.g. first optimum allocation between strategies, then best mix with bond, and a min 30%, max 40% allocation with about one month lookback. Another option is “No” ranking, e.g. equal weight between the five components, which looks similar, but you see bigger drawdown. Tip: Select only 3 or max 4 strategies, with a fundamental reason, e.g. equity, correlation, hedge.
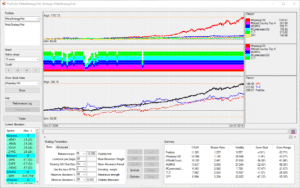
Then automatically you get the allocations to strategies and ETF each month, like below:

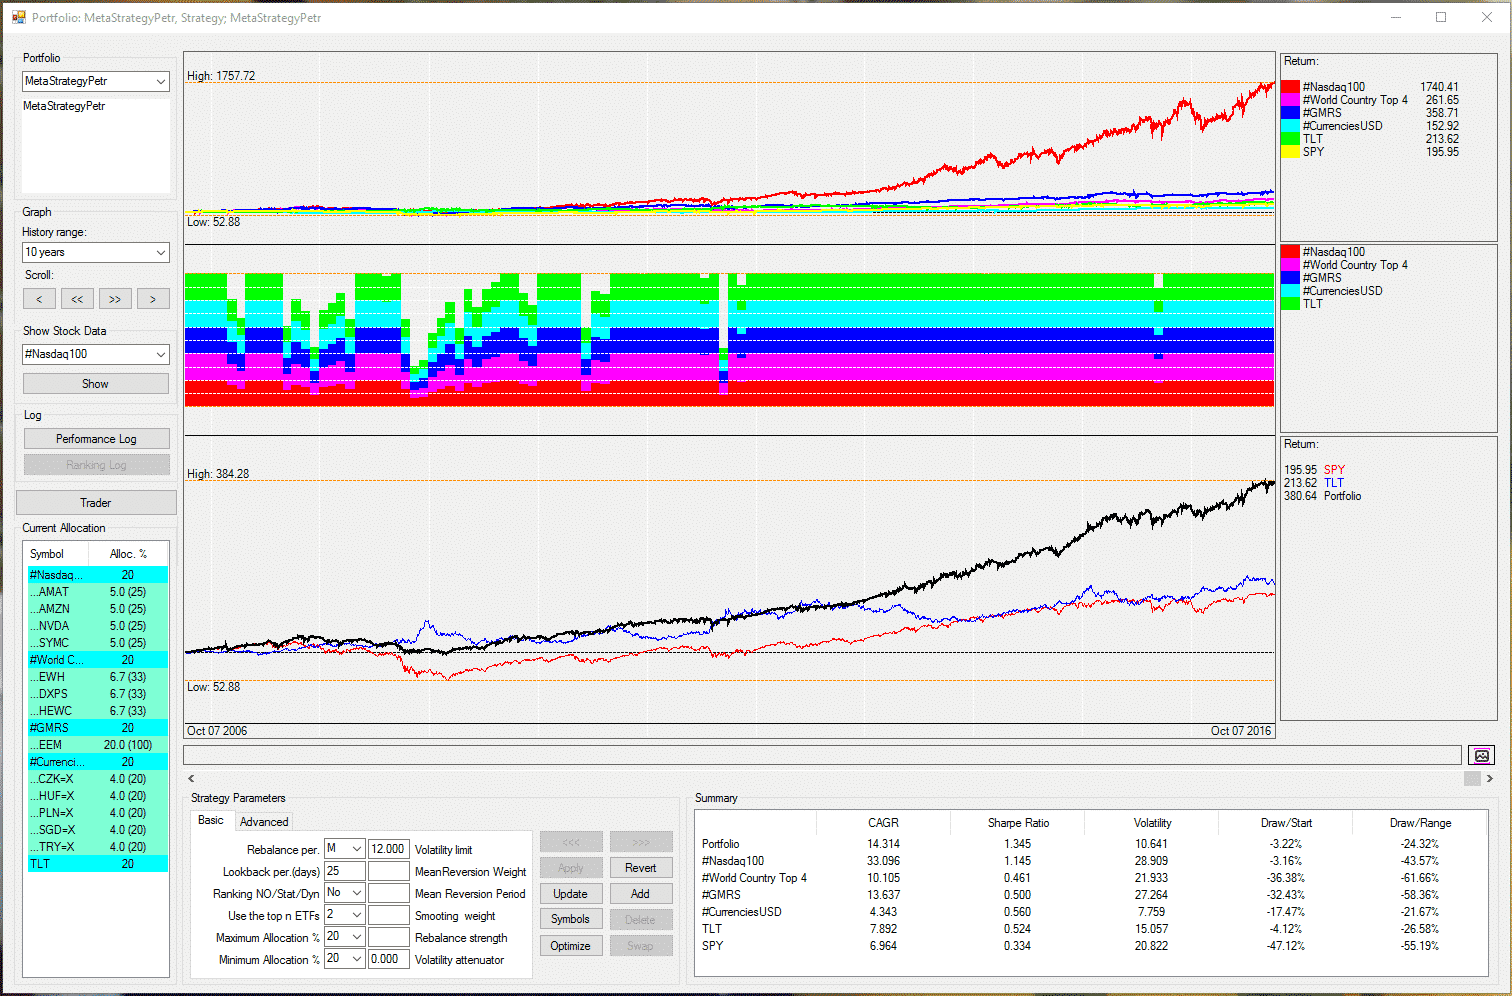
If you prefer to stick to static, fixed weighting among the strategies, then you can set the min/max weightings in the Portfolio Manager window for each strategy, see last screenshot. I think the dynamic approach like above is more advanced though.
This is just a quick example, by no way the best. Let me know what you find, or post as example for others in the forum. I open a topic with this explanation.
Hope this helps.
AlexExample Dynamic Ranking:


Example Fixed weight 10% for Nasdaq:


Hello Reuptake, thanks for sharing your results, hope this evolves into a discussion among the community.
– Saving strategy files, like #BRS: We just a released a new version which does this automatically.
– The optimization for MetaStrategies indeed can take some time, as first each strategy is optimized and then the portfolio. Let me know what time – in minutes – it takes aprox to see if we need to speed up this process.
– Heat-map: Agree, maybe we need to make the screen bigger and use colors instread of the “50 shades of grey” (- bad joke..). The 3D models of Amibroker are nice, but also hard to read, think we´ll find a suitable 2D way to visualize.– Agree on a risk of curve-fitting, but the best medicine is to do what you are doing: Look for broad strable ranges of parameters, and compare between different options, e.g. dropping a component or adding one.
Would you mind sharing some screenshots of your results (use: https://snag.gy or similar) and/or the “_QuantTrader.ini” file so others can replicate?
Hola Michael,
I´m not aware of any objective statisctical way to measure the degree of curve fitting. Maybe the confidence ranges of a Monte Carlo Simulation would be such a measure? For me the ultimate measure is the performance in live trading, which sadly you only know after the fact and some years.
Hi Elsid, yes, we´re considering the compounding of percentages, that is, we would also show 100k * 0.8 * 1.3 = 104k or 4% gain.
-
AuthorPosts


