For our „All Strategies“ Subscriber who use the Portfolio Builder to build own ETF portfolios by blending their own mix of Logical Invest Strategies, here some updates and a short mid-year review:
- We have now included the “World Top 4 Strategy” into both the online and offline Excel tool. To keep the charts readable, we opted for replacing the Aggressive Version of our “Global Sector Rotation”.
- The preconfigured and optimized Markowitz Portfolios have been updated, only slight changes in the allocations occurred – all are <5%, so in most cases these can be neglected due to account size.
Overview of Strategies and Markowitz Optimized ETF Portfolios:
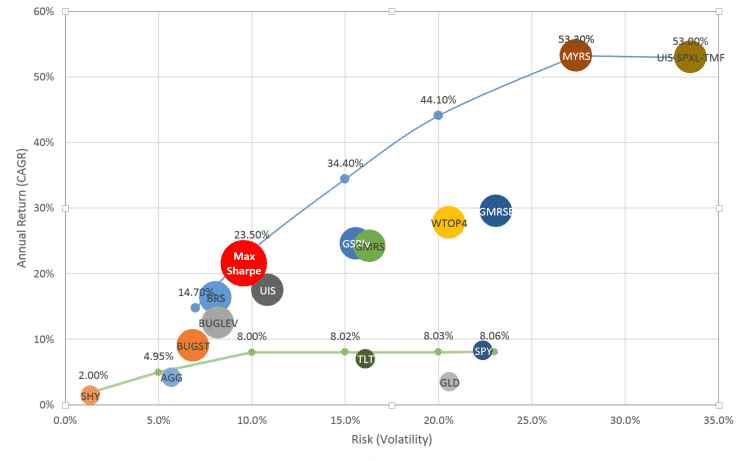
The Markowitz Risk/Return plot displays the major changes:
- The newly introduced World Top4 Strategies is located between our moderately aggressive Strategies, namely Global Sector and Global Market Rotation.
- The 3xUIS has in the recent months fallen short of expectations, therefore moving the whole upper end of the efficient frontier down from the picture as of beginning 2015.
- The BUGs, Bond Rotation and Universal Investment Strategies remain calmly as main diversifier, and with extremely low correlations to S&P500.
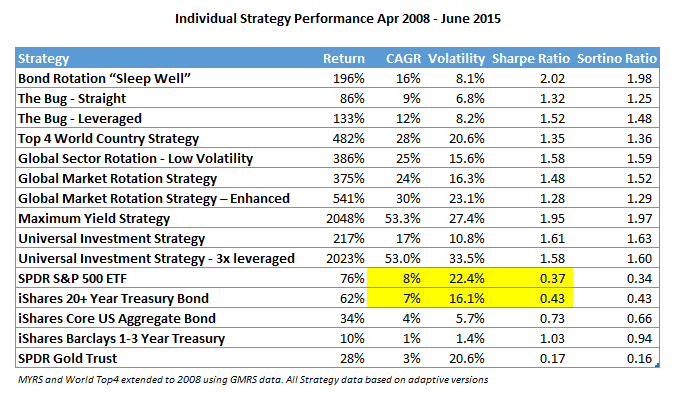
While the current sideward and very choppy market it not an ideal environment for Rotation Strategies like ours, below table shows that all strategies continue to deliver to their promise of delivering higher return and lower volatility, thus superior Sharpe Ratios, than their benchmarks.
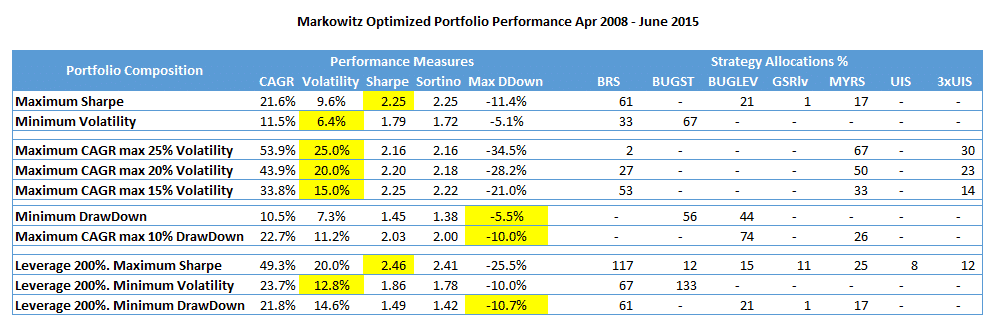
What about the Markowitz optimized fixed weight ETF Portfolios? Below a selection of the most requested solutions with updated performance measures and allocations to the individual strategies. Highlighted in yellow the respective optimization constraints for easier reference.
Note that these are “raw” ETF portfolios with exact allocations from the optimization, depending on the account size, allocations of less than 5% might be dropped to reduce complexity and transaction costs. As example, a “Maximum Sharpe” portfolio with allocations of 60%, 20% and 20% to Bond Rotation, BUG, and Maximum Yield, respectively, has delivered a CAGR of 22%, Volatility of 10%, thus a Sharpe Ratio of 2.2 – very similar to below optimization.
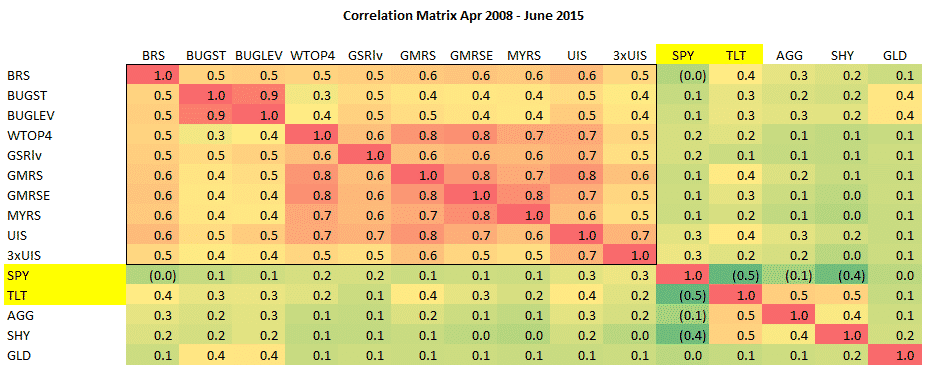
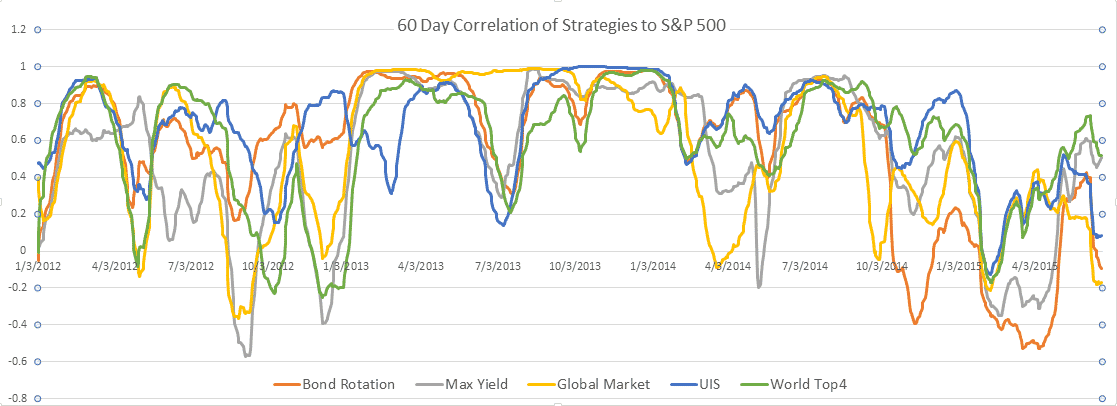
And finally a look at the underlying correlations in ETF Portfolios: The average 60 day Correlation of our Strategies to the S&P500 since Apr 2008 continues below 0.3, thus offering good protection versus market risk. Cross-correlations of Bond Rotation and BUG to all other strategies remain lowest, making them good candidates for a diversified portfolio – which explains why they appear in all before mentioned portfolio solutions.
Reviewing the correlation of selected strategies versus S&P 500 on the timescale, you can observe the effect of the “risk-hike-mania” earlier this year, when suddenly treasuries dropped from all-time highs, thus our strategies moving back into risky assets with a time lag, causing a momentary drop in correlations to the S&P500, and a later increase to still moderate levels between 0.2-0.5 recently.
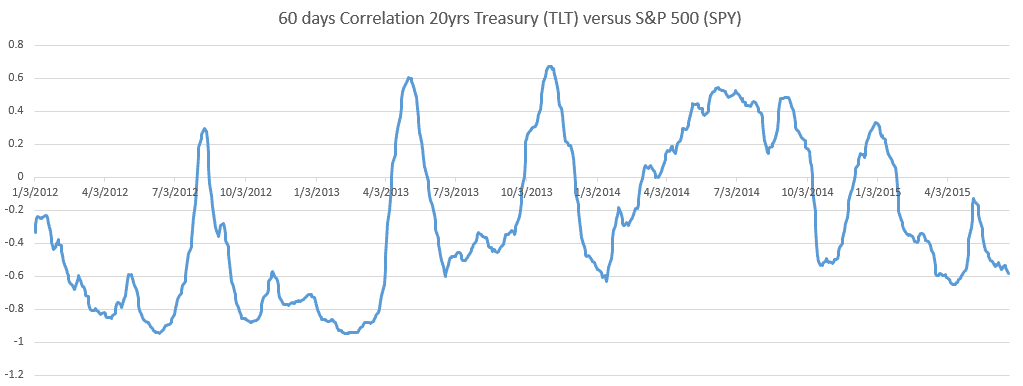
To emphasize on above, long term treasuries continue with clearly negative 60 days correlation throughout 2015, thus remain our crash-protection of choice for our strategies and derived portfolios. We continue to expect them to absorb a significant part of the money flow in case of a correction in risky assets – independent from the ongoing discussion whether they rightly priced and anticipating any eventual rate-hike.
In anticipation of a vivid discussion,
all the best, this time from Germany,
Alexander Horn
I want to be sure I understand how some things are calculated in the custom portfolio builder.
In the UIS if I short SPXU and TMV I believe that is considered the leveraged version? But does that mean still investing the same amount of cash as if using SPY and TLT or does it mean investing 1/3 that amount?
In general if I short TMV as a replacement for TLT in any portfolio would I still use the same investment amount or 1/3 that amount? Specific example in BUG leveraged if I substitute shorting TMV for TLT do I use 29% or 9.67% ?
There are two ways to leverage the UIS: The “Hell on Fire” looked into using long bull SPXL and TMF, the other way is using 3x bear SPXS / SPXU and TMV like you mention. You can either invest 100%, thus using the full 3x leverage, or stay at 1/3, thus having a similar exposure as UIS but “freing up” capital for other purposes – while suffering a bit from the roll losses leveraged ETF create.
In your example of the BUG, you would invest 1/3 of the TLT capital into shorting TMV, so the ratios of the underlying signals are not distortioned.
Hope this clarifies.
Yes thanks.
Alexander
I really don’t understand why you guys keep including in your portfolios ETFs that have very little volume. The results of the strategies in which you do that become totally hypothetical because the can not be implemented with any portfolio beyond a very modest size.
Ben
Ben, I recognize that some of the ETF used in the Global Sector Rotation and World Top 4 have less liquidity than the ETF used in the other strategies. However, using limit orders you should be able to get reasonable trades for an account of 200-300k USD. Also recall that often the rebalancing is not 100%, but gradual shifts of allocations.
When selecting the ETF to be included we go for the ones with best liquidity, but when dealing with global sectors or individual countries the availability is limited – and dropping them would hurt the selection bias.
So we need to find somehow a compromise, hope for your understanding. We make it clear that the performance figures do not include transaction costs, spreads, slippage and tax – as all of them depend on the individual trading environment.
We have now included the “World Top 4 Strategy” into both the online and offline Excel tool. To keep the charts readable, we opted for replacing the Aggressive Version of our “Global Sector Rotation”.
i don’t see the name as “world top 4 strategy in the excel version online for the percentages. Am i missing something or is the top 4 not included in the excel version?
Also i don’t see it in the updated performance – there is not a world top 4 updated daily. i know you can see this in the performance chart but you don’t see it in the screen that has all the tabs where you can see the performance and old trades for the other strategy? Will this be enhanced to have the World Top 4 Strategy in that section going forward?
HI Greg,
in the Excel tool I use abbreviations, so look for WTop4 in the forth line for the World Top 4 Strategy, see screenshot below. The performance data is updated using the “Refresh Quotes..” button.
I’m not displaying the trade data (ETF, allocation %), but only the daily return data, which is used to compile the statistics.
Hope this clarifies,
Alex