We received a lot of constructive feedback after introducing the “Universal Investment Strategy” (UIS). Therefore here now the leveraged version employing the ETF SPXL & TMF. The strategy can be traded shorting the ETF SPXS and TMV, which we will analyze in future.
3x leveraged Universal Investment Strategy with SPXL & TMF
- Aggressive leveraged version of our previously published Universal Investment Strategy
- Variable SPXL / TMF allocations dynamically adapted to the market conditions.
- 45% annual return with a Sharpe Ratio of 1.3 since 2002.
We’re received a lot of constructive feedback after our recent article introducing the “Universal Investment Strategy” (UIS). Many bloggers have contributed to validate the strategy with their own backtests. Among them Ilya Kipnis from QuantStrat Trader, and Michael Kaplan from Systematic Investor. In its January 2015 meeting, Al Zmyslowski and the CI-MI group of the AAII Silicon Valley chapter discussed the Strategy in detail. They were kind enough to post the videos (Part I, II and III).
Due to its simplicity and low correlation to the S&P 500, there is a continued interest in the UIS version that uses 3x leveraged ETFs: ETF SPXL (Direxion Daily S&P 500 index Bull 3X Shares ETF) and TMF (Direxion Daily 30-Year Treasury Bull 3x Shares ETF). Following the suggested nickname by Al from AAII SV we call this version “Hell on fire”. This alludes to the high risk/return profile of the strategy. We will show ways to blend this strategy in a well-balanced and risk-optimized portfolio to overcome the generally negative perception towards leveraged ETF.
The interested reader might ask, why a separate article for this? Why not simply use the signals of the non-leveraged strategy, but execute with the leveraged ETF? Or just use margin? We will come back to this question after introducing some methodology used in our extended backtest.
Synthetic time series for extending backtest of SPXL and TMF
Due to the limited history of both funds ETFs (SPXL & TMF) we decided to extend the time series to include the 2008-2009 timeframe.
The approach we took was to determine a multiplication factor to the daily returns of SPY (TLT) which would minimize the sum of squared differences of the leveraged and non-leveraged versions. Applying the resulting factor of 2.84 for the SPXL ETF (3.04 for TMF ETF) visually confirms the good fit.
But why not apply the UIS signals to trading the 3x leveraged ETF? The answer lies in the effective leverage both ETF offer versus the base version.
SPXL results with factor of 2.84 and falls short of the 3.0 leverage target. TMF delivers a 0.28 higher leverage, and with a factor of 3.04 more than delivers the targeted leverage. We show that using the synthetic 3x leveraged time series in the algorithm results in better performing trading signals.


For the backtest we use the same ‘modified Sharpe Ratio’ algorithm as introduced in the original UIS. Normally the Sharpe Ratio is calculated by Sharpe = rd/sd with rd = mean daily return and sd = standard deviation of daily returns. We don’t use the risk free rate, as we only use the Sharpe ratio for ranking the funds ETFs.
Our algorithm uses a modified Sharpe formula: Sharpe = rd/(sd^f) with f=volatility factor. The f factor allows us to change the importance of volatility.
We analyze the performance of three different backtests and present the charts from our “QuantTrader” software:
1) Formerly ‘plain’ UIS with the SPY and TLT ETF for Jan 2002 – Mar 2015

2) The 3x leveraged UIS since inception in 2009 to Mar 2015

3) The 3x leveraged UIS from 2002 to Mar 2015

4) Same as 3), using lookback and f factor as in 2).
This to confirm the parameter stability of our extended backtest, discussed later.

5) – 10) The plain and leveraged versions since inception and extended to 2002.
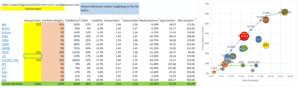
The performance statistics of the backtests and their underlying ETF in comparison:
| CAGR % | Volatility % | Sharpe | Max DrawDown % | ||
| 1. | UIS SPY/TLT 2002 – 2015 | 13.57 | 10.10 | 1.34 | -17.13 |
| 2. | UIS SPXL/TMF 2009 – 2015 | 53.27 | 25.26 | 2.11 | -19.28 |
| 3. | Synth. UIS SPXL / TMF 2002 – 2015 (selected for publication) | 44.78 | 33.59 | 1.33 | -43.95 |
| 4 | Synth. UIS SPXL / TMF 2002 – 2015 (same parameter as 2) | 35.72 | 32.65 | 1.09 | -48.97 |
| 5 | SPY 2002 – 2015 | 8.92 | 19.36 | 0.461 | -55.19 |
| 6 | TLT 2002 – 2015 | 7.81 | 13.84 | 0.56 | -26.58 |
| 7 | SPXL Jul 2009 – 2015 | 44.17 | 47.69 | 0.93 | -53.82 |
| 8 | TMF Jul 2009 – 2015 | 20.04 | 45.88 | 0.44 | -53.33 |
| 9 | Synth. SPXL 2002 – 2015 | 15.93 | 56.81 | 0.28 | -94.18 |
| 10 | Synth. TMF 2002 – 2015 | 16.39 | 42.15 | 0.39 | -66.39 |
Note the Maximum DrawDown of -94% (-66.39%) in the synthetic SPXL (TMF) from Oct 2008 to March 2009. In practical terms, $100 invested in SPXL would have decreased to $6. We estimate only few people on this planet would have gone through this roller-coaster without de-leveraging. Thus with the retrospective knowledge that the world did not ‘go bust’, losing a major part of their account.
That said, it is also clear that any leveraged strategy with fixed (not adaptive) allocation ratios, would not survive a 2008 crash. It is just an absolute necessity to reduce the allocation if you go through a longer market correction. Unfortunately these 3x leveraged ETFs have all been issued after the 2008 crash. Since then we had a continuous bull market which makes any post-2009 backtest look really attractive.
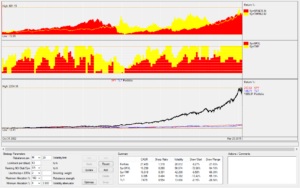
Performance Analysis of the leveraged version
There is a notable different behavior of the strategy before and after the financial crisis in 2008/09, which is visible in the chart. Only after the 2008 correction investors seem to really see Treasuries as a save haven asset which goes up when the stock market goes down. Since 2008 the average correlation between the stock market and Treasuries was about -0.5. Before 2008 it was only around 0.
Due to more stable performance over the whole 2002 – 2015 period, we select Option 3) for inclusion in our overall portfolio of strategies. All further analysis refers therefor to this option.
Parameter stability in the extended 2002 – 2015 period
Our algorithm optimizes for the ‘modified Sharpe Ratio’, so we plot this instead of the regular Sharpe Ratio, together with the Annual Return (CAGR) and volatility with the horizontal axis representing our f factor, and the vertical axis the lookback period.

You can see that both the annual return and volatility are very stable across the parameter range. Values go from 39%-45% annual return, and 32%-34% annualized volatility – even our heat-map plot goes aggressively from ‘very green’ to ‘very red’ in these close ranges.
Portfolio options for calming the ‘Fire in Hell’
As we stated in the beginning, this SPXL / TMF “Hell on fire” strategy might look excessively aggressive to many private investors due to the 3 times leverage resulting in relatively high volatility. So why do we present this here? Well, we see this strategy as a very good complement even to conservative or moderately growth seeking portfolios.
Here are two examples of how this strategy might be blended with other Strategies. We combine ‘Hell on fire” with two other strategies we had previously introduced in SeekingAlpha: The “Sleep Well Bond Rotation” and the “Maximum Yield Rotation” Strategies.
The first Portfolio of Strategies (“Custom Portfolio”) seeks maximum annual return with a maximum Volatility of 20%, so suited for investors looking for rather aggressive growth:

By allocating 23% to the 3x UIS, this portfolio delivered a very aggressive 45% annual return, but backed up by a dream Sharpe Ratio of 2.2.
The second Portfolio option (“Custom Portfolio 1”) also seeks maximum Annual Return, but this time with a maximum Volatility of 13%. This is better suited for investors who seek moderate growth or require a low volatility portfolio with stable returns due to having reached the retirement age:

In this portfolio we observe that by just allocating 5% to the 3x UIS, we achieved a very good 23% annual return, with an even higher Sharpe Ratio of 2.3.
Custom Investment Portfolio employing the SPXL / TMF model
Plotting the custom portfolios together with the different strategies on a Risk / Return chart:

These blends of strategies deliver dramatically better results. Even compared with what would possible using any combination of some common market proxies we included in the plot chart.
Yet the same ‘power of diversification’ like in conventional asset allocation still applies. Using a blend of a Bond Rotation Strategy, an Equity Rotation Strategy, and as additional diversifier some inverse volatility and treasuries we achieve results which again drastically outperform each individual strategy performance. Using this blend of strategies also enables us to configure virtually all possible portfolios targets through our Portfolio Analyzer and Builder. Either by constraining volatility, classically optimizing for Sharpe Ratio or setting minimum or maximum weights by asset class.
Inverse leveraged using TMV and SPXS ETF
Part II of this article will look at the same model, but executed with the inverse -3x leveraged SPXS and TMV funds ETFs. By shorting SPXS and TMV we benefit from harvesting the daily roll losses of the funds ETFs even after absorbing the daily borrowing cost, that is we we expect to further enhance the total return.
SPXL can be replaced by either the 2x SSO ETF or 3x UPRO depending on the availability of the ETF in your plan and your personal risk appetite. Shorting the TMV and SPXS ETF can be done by inverting the long signals.
Interesting. Are there variations using short EDV in place of TMF that are superior?
I do not understand something about the CARG in the portfolio options at the bottom of the article. For example the MYRS in one has a CAGR of 54% and the other has 13%. Are they different time frames? My definition of CAGR would not change because of % allocation changes.
Hmmmm. no way to edit a posted message. I meant to say are there variations using short TMV in place of TMF that are superior.
Nelson, yes, watch out for ‘Hell on Fire’ – Part II, where we will introduce the SPXS-TMV version. Corrected the wrong MYRS CAGR, sorry for the typo.
what strategy is the above graph for? Custom portfolio, or Custom Portfolio 1 ?
The dynamic chart and shown portfolio options use the strategy version 3) with parameter range optimized over the complete 2002-2015 range, e.g. CAGR 44.78%, Volatility 33.59%. This is also the equity line shown in the Portfolio Builder.
what is return profile for 50%Bond Rotation, 25% MYRS, and 25% 3X UIS?
This portfolio blend would be about in the middle of the shown portfolios. CAGR 38%, Volatility 16.7%, Sharpe 2.25, MaxDD (daily) 23.34%.
You can see the equity line by simulating it in the portfolio builder, here a quick screenshot, click to enlarge:
Received a good comment from Peter by mail. Obviously UPRO is pretty much exchangeable to SPXL in terms of liquidity, expenses and return. Depending on your plan you might have a preference.
http://etfdb.com/tool/etf-comparison/SPXL-UPRO/
http://finance.yahoo.com/echarts?s=UPRO+Interactive#%7B%22range%22%3A%7B%22start%22%3A%222009-12-25T18%3A00%3A00.000Z%22%2C%22end%22%3A%222015-04-02T18%3A00%3A00.000Z%22%7D%2C%22scale%22%3A%22linear%22%2C%22comparisons%22%3A%7B%22SPXL%22%3A%7B%22color%22%3A%22%23cc0000%22%2C%22weight%22%3A1%7D%7D%7D
I remember someone at LI stating this strategy would go to all cash if neither ETF met a minimum performance requirement. That doesn’t happen in this backrest.
Specifically, I’m concerned with the possible raising of interest rates and a simultaneous negative stock market reaction.
Is there a plan to introduce a cash allocation to this or do you hold on to one of these no matter what?
Stephen, you are right that we’re not considering any downscaling in the 3x version. Main reason is that – in contrast to the ‘plain’ UIS – we really see this as a smaller complement to a broader portfolio (5% – 20% as mentioned in article), so the hedging / balance would come at portfolio level from the other strategies like Bond Rotation.
Here a backtest which limits exposure to meet a 20% volatility target during any lookback period. As you see the performance drops significantly, so I rather would do this exposure or volatility limiting at the portfolio level, not within the strategy itself.
Click to expand
I don’t find the allocation percents for the current period. i am an all strategies subscriber
stephen
Stephen, subscriber signals and charts are updated, press Ctrl+F5 to refresh your browser cache if necessary. We’ll add the signal consolidation for May with the other ‘alternative options’.
i get my strategy allocations from the emails that i receive. When i look under the strategies tab the current ETF allocations are up to date only for the previous periods. i usually use a MAC not a PC. I don’t know what ‘alternative options’ are or where to find them
stephen marsh
Stephen, have a look at ‘Strategy Blog updates’ in the ‘My Account’ Menu (or this link: https://logical-invest.com/blog/subscribers-only/). There you see all recent signals in different forms.
The ‘alternative options’ are for example using TLT instead of EDV, or using short ETF for the MYRS. We will add the calculations to the consolidation sheet by lates May 1st.
Got it . thank you
stephen marsh
Here’s a “Hell On Fire” allocation that I think looks good:
http://content.screencast.com/users/sMark220/folders/Jing/media/89f67c30-0a56-4ebc-ba33-9c76c7fbb246/2015-04-06_1802.png
Yes, excellent. The BUG also correlates very low with the 3x UIS and therefore it makes sense to use it alternatively to the BRS.
Yes, I was looking for more diversification with similar stats as the “Custom Portfolio 1.”
Hi!
I asked elsewhere, but this homepage is rather hard to navigate :)
I am trying to figure out when the costs of using 3x inverse ETFs like TMV and SPXS outweights the benefits?
My current US broker request 2%/year (for TMV, do not know the fee for SPXS yet) in “hard to borrow fee”. On top of that comes the actual margin rate you have with the broker- so we could be looking at 5% or even 10% in costs.
Appreciate any thoughts on this.
Cheers!
Ben, I take the hit on the hard to navigate site, indeed getting confusing between post comments and forum entries… :-)
Here is where you had raised the question, and can see my answer also there: https://logical-invest.com/forums/topic/3x-leveraged-universal-investment-strategy/
It seems the message is mixed about the 3x hedge, even from the name “hell on fire,” so I’d like to review the pros and cons. On the one hand, Frank mentioned in a comment to the SA article that instead of a $100k unlevered hedge, you could invest just $33k in the 3x version. But he also points out above that the latter would have lost 94% during the ’08 crash. So if you only invest a third as much but you’re 3 times as likely to lose it, it’s no saving. Of course, if one side is going down 3x and the other is going up 3x, it shouldn’t matter. And what we learned from the crash was that everything recovers eventually, though not necessarily to where it was before, and it may take a while — about 3 years in the case of SPY.
Above, an example shows investing 5% in the 3x, but in another thread, someone asked about consolidating EDV, TLT, and TMF. Frank recommended converting it all to TMF, amounting to 17% of the portfolio. That could be a damaging loss. But unlevered, it would mean tying up 50% of the portfolio in a hedge. Is this the only alternative to the 3x?
Also, on SA, Cliff Smith wrote about a similar strategy that uses a moving average crossover to get out of SPY and TLT or the leveraged versions, especially when both are going down at the same time. Have you considered this?
Ray, sorry for the delay in the reply, bit busy to deliver our overdue promises :-)
Let me cut this elephant in pieces, the comments were made in different context:
– Franks statement of investing $33k in 3x leveraged vs $100k in plain ETF was to show that investing 1/3 of your account in 3x leveraged ETF is not riskier than investing 100% in plain ETF. Yes, you will incurr in some roll-losses, but you have 2/3 of cash available for other investments, and your risk is limited to the 1/3. See here: http://seekingalpha.com/article/3050016-hell-on-fire-the-3x-leveraged-universal-investment-strategy-part-i#comment-50997366
– The loss of 94% was referring to buy & hold of SPXL (without tactical layer / pair switching with TMF) during 2008/2009, assuming some kind of constant withdrawal indeed the account would have ‘touched ground’, or the buy & hold would have been abandoned (without recovery). This is meant as an example of why a tactical approach helps to survive such drastic correction, see below 5) in the article: http://seekingalpha.com/article/3050016-hell-on-fire-the-3x-leveraged-universal-investment-strategy-part-i
– Yes, we advocate to invest only a smaller part of your account in the 3x UIS, and mention a 5-20% in the examples. This is not contradictionary to consolidating your TLT, EDV and TMF investment into a single TMF position, maintaining the overall exposure. Example at portfolio level: 20% TLT from BRS + 20% EDV from MYRS (see 1.5 ‘leverage’ vs TLT) + 10% TMF from 3x UIS would mean aprox 20% + 13% + 3% = 36% TLT = 12% TMF. Same risk, but free cash with assuming some rebalancing losses.
– Instead of using a 200d, moving average crossing, etc as ‘market-timer’ to take some investment into cash, we generally advocate for using a risky asset paired with a long-term bond as crash-protection mechanism, that’s the main difference to other authors as Cliff, Meb Faber, etc. We think this makes the crash protection more stable and enhances long term returns.
Hope this explains,
Alex
I’m a bit confused on what this strategy would have actually did during the 2008-2009 crisis. If I run a normal back-test of a 50/50 TLT/VTI or similar non leveraged, it appears they would have cancelled each other out for a break even or maybe slight loss.
So if you would have had TMF/UPRO or similar what happened? I know with extreme volatility it can really throw the leveraged funds out of whack so they don’t track well, but how far off track during this time?
I would think that the TMF would have almost tripled while the UPRO would have lost almost everything… thus break even or worse if tracking error and volatility factors were off.
Thanks
As you can see in the charts and allocation table above, the strategy would have gone agressively into bonds (TMF) by mid 2008 and only back to SPXL in the second quarter of 2009. From Sept 2008 to March 2009 the strategy would have performed flat, but indeed a wild ride in the months in between.
Recall the underlying algo is looking for optimizing the “modified Sharpe” as described in the article, so any attempt to replicate with a simpler algo will fail.
When do you plan on writing Part 2 of this article? I would love to see what the implications of shorting the inverse strategy does for an account.
Hi Caleb,
had troubles getting the historical borrowing rates from IB for TMV and SPXS, this is why I never published second part.
But let me try again to convince them, or at least show the results with a simulation.
Thanks for looking into Alex.
I’m using the Hell on Fire strategy as a core of my IRA. Before I use it as a part of my margin account, it would be great to know if TMV and SPXS are worth the effort (Quantrader says “yes”).